Zip Codes with the Highest Percentage of Population Taking Taxi / Cab to Work in Corsicana, TX
RELATED REPORTS & OPTIONS
Taxi / Cab
Corsicana
Compare Zip Codes
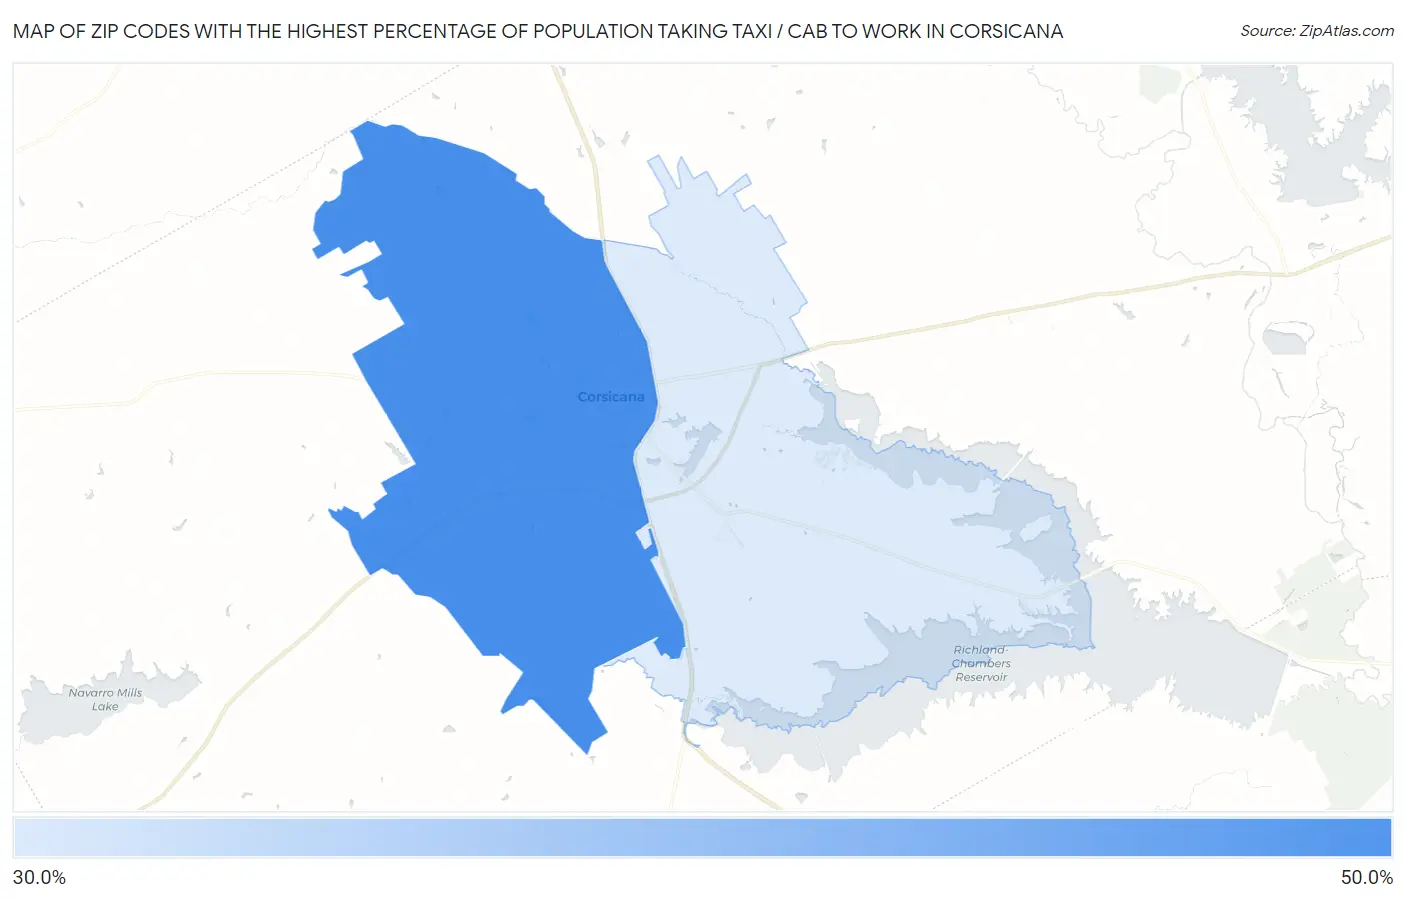
Map of Zip Codes with the Highest Percentage of Population Taking Taxi / Cab to Work in Corsicana
0.0%
50.0%
Zip Codes with the Highest Percentage of Population Taking Taxi / Cab to Work in Corsicana, TX
| Zip Code | % Take Taxi / Cab | vs State | vs National | |
| 1. | 75110 | 42.0% | 36.9%(+5.10)#344 | 38.2%(+3.80)#5,722 |
| 2. | 75109 | 34.9% | 36.9%(-2.00)#554 | 38.2%(-3.30)#8,949 |
1
Common Questions
What are the Top Zip Codes with the Highest Percentage of Population Taking Taxi / Cab to Work in Corsicana, TX?
Top Zip Codes with the Highest Percentage of Population Taking Taxi / Cab to Work in Corsicana, TX are:
What zip code has the Highest Percentage of Population Taking Taxi / Cab to Work in Corsicana, TX?
75110 has the Highest Percentage of Population Taking Taxi / Cab to Work in Corsicana, TX with 42.0%.
What is the Percentage of Population Taking Taxi / Cab to Work in Corsicana, TX?
Percentage of Population Taking Taxi / Cab to Work in Corsicana is 34.5%.
What is the Percentage of Population Taking Taxi / Cab to Work in Texas?
Percentage of Population Taking Taxi / Cab to Work in Texas is 36.9%.
What is the Percentage of Population Taking Taxi / Cab to Work in the United States?
Percentage of Population Taking Taxi / Cab to Work in the United States is 38.2%.