Zip Codes with the Highest Percentage of Population with a Degree in Physical and Health Sciences in Corsicana, TX
RELATED REPORTS & OPTIONS
Physical and Health Sciences
Corsicana
Compare Zip Codes
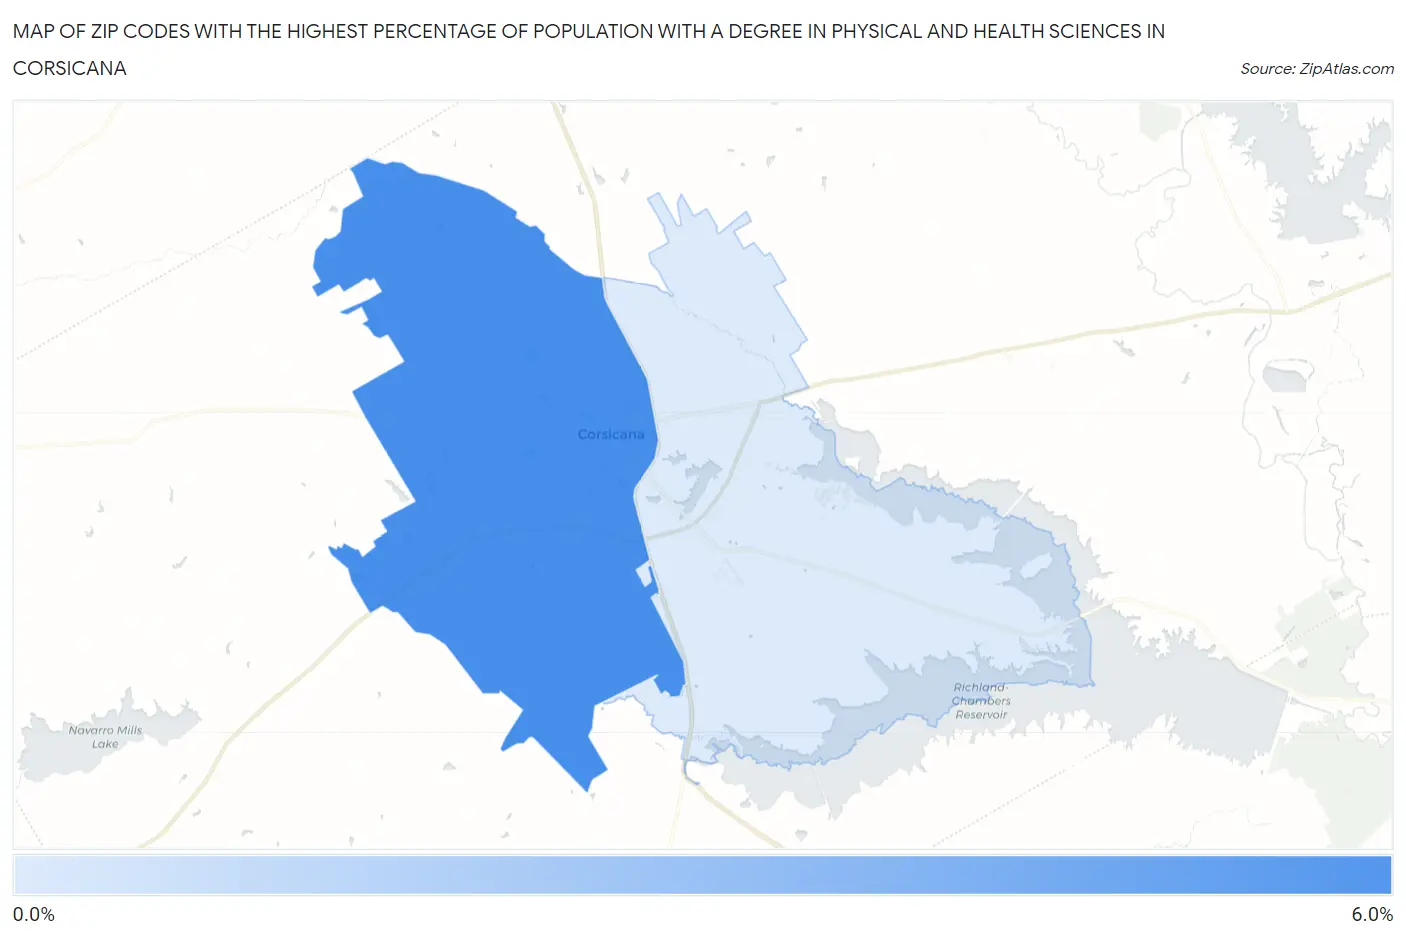
Map of Zip Codes with the Highest Percentage of Population with a Degree in Physical and Health Sciences in Corsicana
0.0%
6.0%
Zip Codes with the Highest Percentage of Population with a Degree in Physical and Health Sciences in Corsicana, TX
| Zip Code | % Graduates | vs State | vs National | |
| 1. | 75110 | 5.4% | 3.3%(+2.08)#265 | 3.1%(+2.30)#3,954 |
| 2. | 75109 | 0.92% | 3.3%(-2.40)#1,209 | 3.1%(-2.18)#19,500 |
1
Common Questions
What are the Top Zip Codes with the Highest Percentage of Population with a Degree in Physical and Health Sciences in Corsicana, TX?
Top Zip Codes with the Highest Percentage of Population with a Degree in Physical and Health Sciences in Corsicana, TX are:
What zip code has the Highest Percentage of Population with a Degree in Physical and Health Sciences in Corsicana, TX?
75110 has the Highest Percentage of Population with a Degree in Physical and Health Sciences in Corsicana, TX with 5.4%.
What is the Percentage of Population with a Degree in Physical and Health Sciences in Corsicana, TX?
Percentage of Population with a Degree in Physical and Health Sciences in Corsicana is 6.7%.
What is the Percentage of Population with a Degree in Physical and Health Sciences in Texas?
Percentage of Population with a Degree in Physical and Health Sciences in Texas is 3.3%.
What is the Percentage of Population with a Degree in Physical and Health Sciences in the United States?
Percentage of Population with a Degree in Physical and Health Sciences in the United States is 3.1%.