Zip Codes with the Highest Percentage of Population Employed in Architecture & Engineering in Lorain, OH
RELATED REPORTS & OPTIONS
Architecture & Engineering
Lorain
Compare Zip Codes
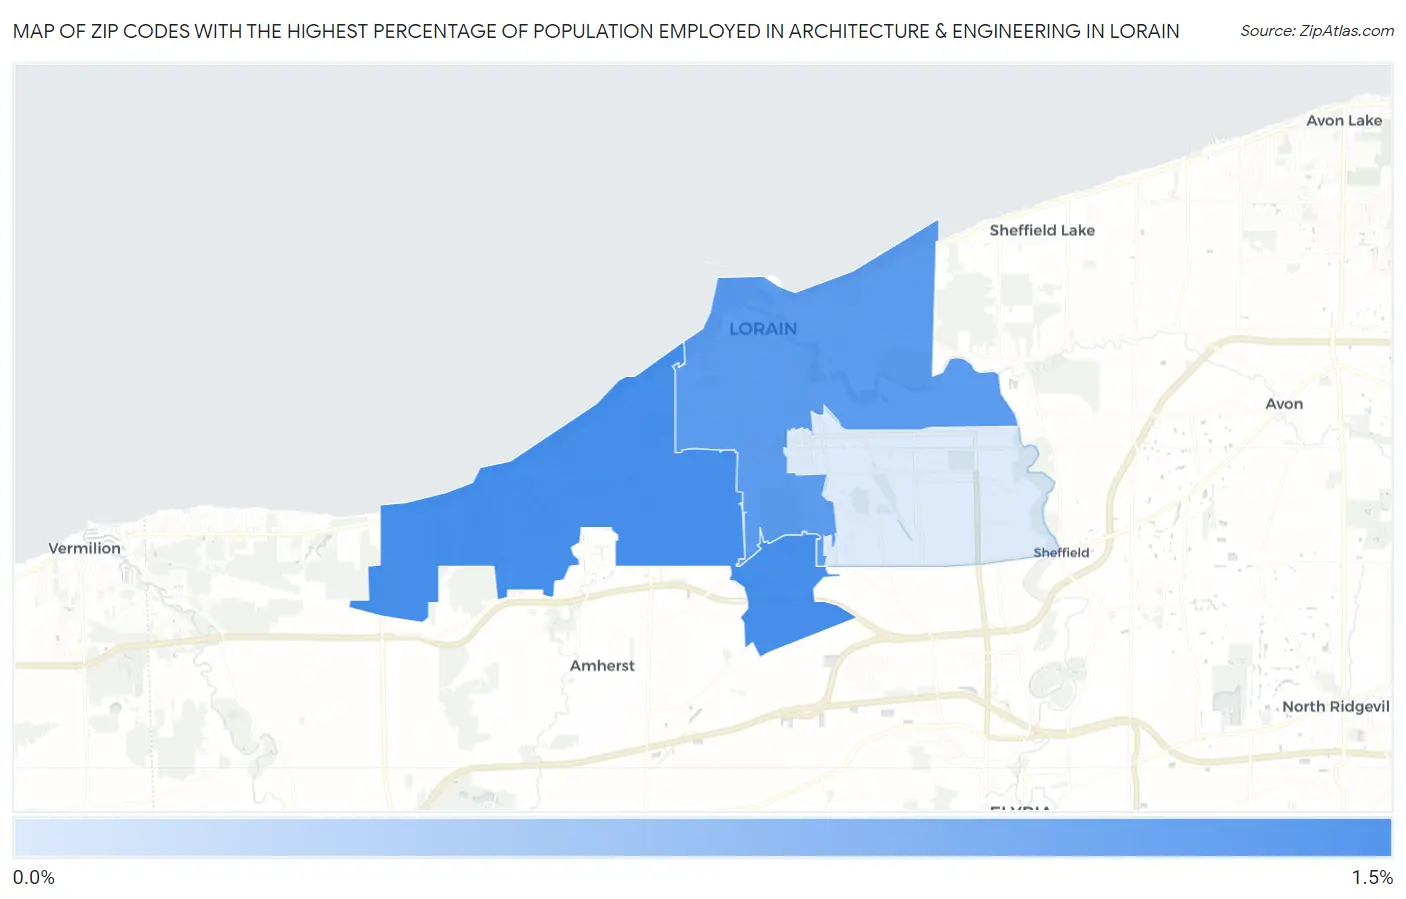
Map of Zip Codes with the Highest Percentage of Population Employed in Architecture & Engineering in Lorain
0.0%
1.5%
Zip Codes with the Highest Percentage of Population Employed in Architecture & Engineering in Lorain, OH
| Zip Code | % Employed | vs State | vs National | |
| 1. | 44053 | 1.4% | 2.1%(-0.742)#584 | 2.1%(-0.757)#13,642 |
| 2. | 44052 | 1.2% | 2.1%(-0.888)#637 | 2.1%(-0.904)#14,711 |
| 3. | 44055 | 0.33% | 2.1%(-1.80)#883 | 2.1%(-1.82)#21,399 |
1
Common Questions
What are the Top Zip Codes with the Highest Percentage of Population Employed in Architecture & Engineering in Lorain, OH?
Top Zip Codes with the Highest Percentage of Population Employed in Architecture & Engineering in Lorain, OH are:
What zip code has the Highest Percentage of Population Employed in Architecture & Engineering in Lorain, OH?
44053 has the Highest Percentage of Population Employed in Architecture & Engineering in Lorain, OH with 1.4%.
What is the Percentage of Population Employed in Architecture & Engineering in Lorain, OH?
Percentage of Population Employed in Architecture & Engineering in Lorain is 1.1%.
What is the Percentage of Population Employed in Architecture & Engineering in Ohio?
Percentage of Population Employed in Architecture & Engineering in Ohio is 2.1%.
What is the Percentage of Population Employed in Architecture & Engineering in the United States?
Percentage of Population Employed in Architecture & Engineering in the United States is 2.1%.