Zip Codes with the Highest Percentage of Population Employed in Architecture & Engineering in Strongsville, OH
RELATED REPORTS & OPTIONS
Architecture & Engineering
Strongsville
Compare Zip Codes
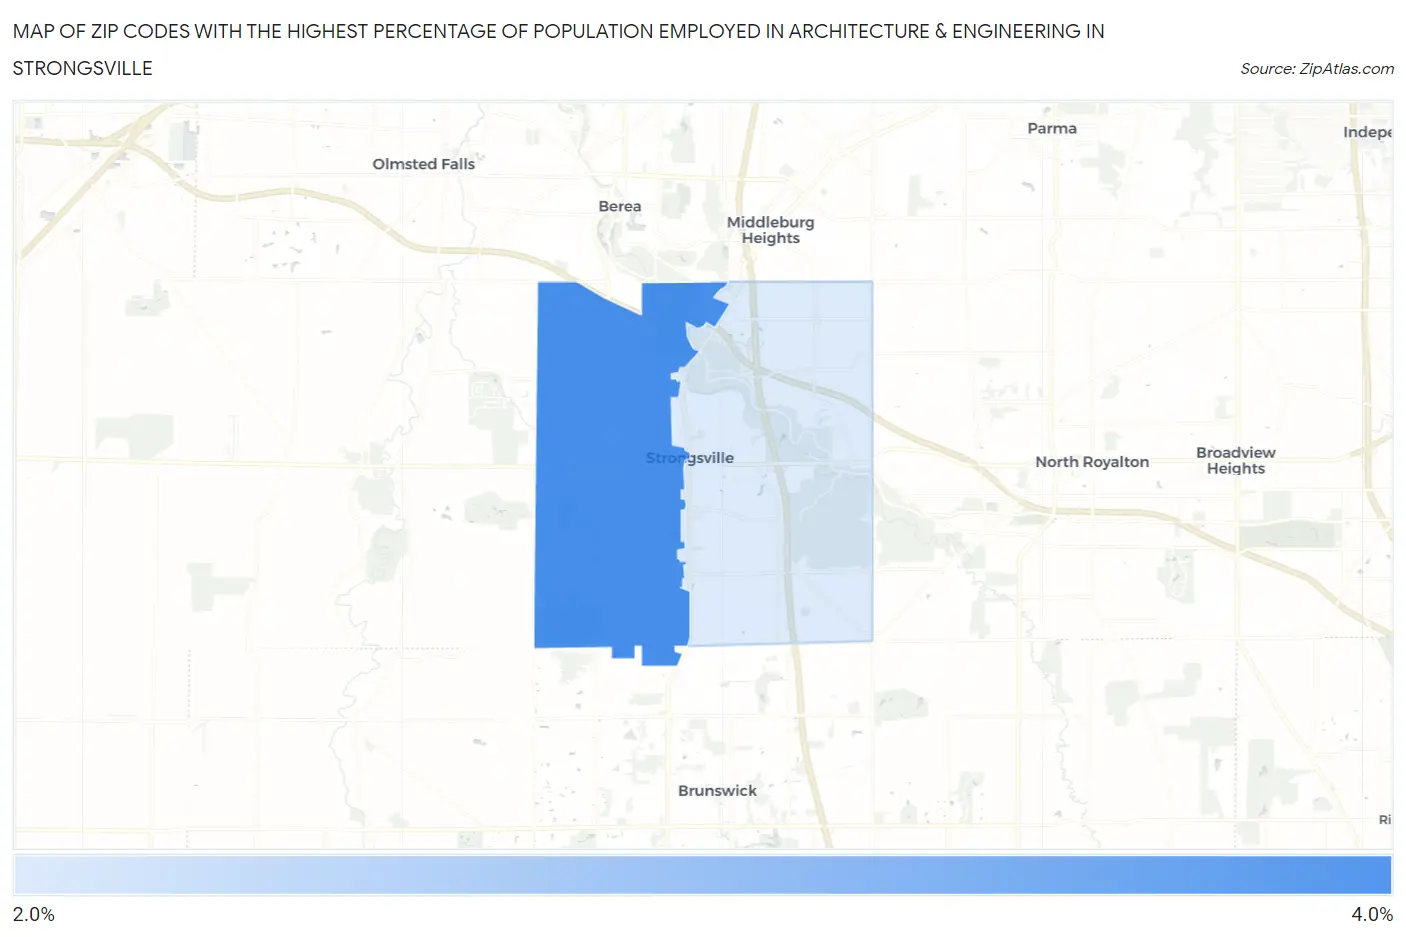
Map of Zip Codes with the Highest Percentage of Population Employed in Architecture & Engineering in Strongsville
0.0%
4.0%
Zip Codes with the Highest Percentage of Population Employed in Architecture & Engineering in Strongsville, OH
| Zip Code | % Employed | vs State | vs National | |
| 1. | 44149 | 3.6% | 2.1%(+1.44)#149 | 2.1%(+1.42)#3,561 |
| 2. | 44136 | 2.1% | 2.1%(-0.054)#405 | 2.1%(-0.070)#9,159 |
1
Common Questions
What are the Top Zip Codes with the Highest Percentage of Population Employed in Architecture & Engineering in Strongsville, OH?
Top Zip Codes with the Highest Percentage of Population Employed in Architecture & Engineering in Strongsville, OH are:
What zip code has the Highest Percentage of Population Employed in Architecture & Engineering in Strongsville, OH?
44149 has the Highest Percentage of Population Employed in Architecture & Engineering in Strongsville, OH with 3.6%.
What is the Percentage of Population Employed in Architecture & Engineering in Strongsville, OH?
Percentage of Population Employed in Architecture & Engineering in Strongsville is 2.7%.
What is the Percentage of Population Employed in Architecture & Engineering in Ohio?
Percentage of Population Employed in Architecture & Engineering in Ohio is 2.1%.
What is the Percentage of Population Employed in Architecture & Engineering in the United States?
Percentage of Population Employed in Architecture & Engineering in the United States is 2.1%.