Zip Codes with the Highest Percentage of Population Employed in Architecture & Engineering in Chagrin Falls, OH
RELATED REPORTS & OPTIONS
Architecture & Engineering
Chagrin Falls
Compare Zip Codes
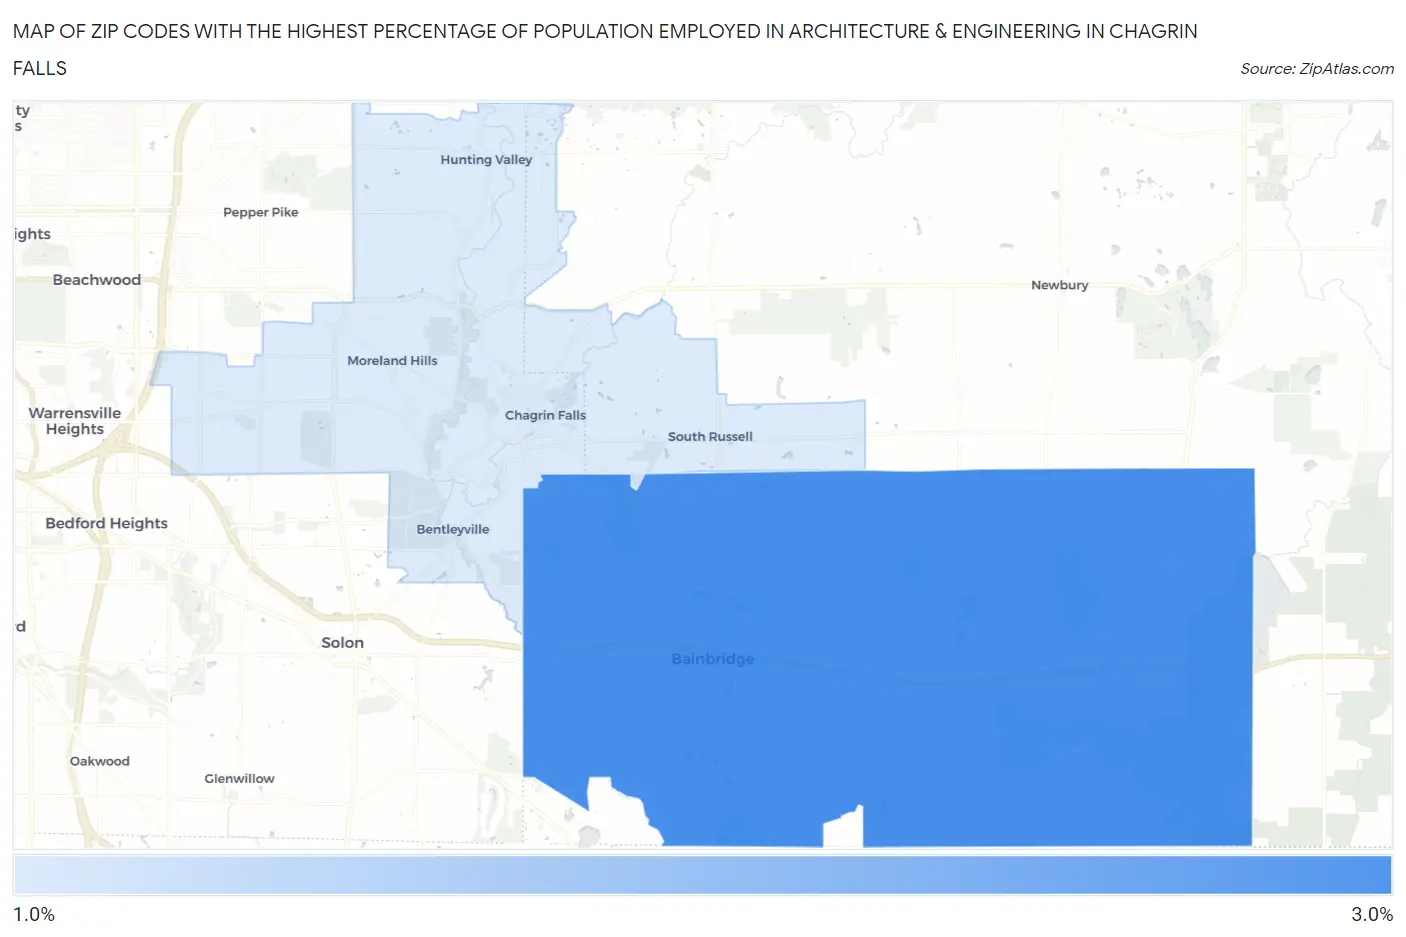
Map of Zip Codes with the Highest Percentage of Population Employed in Architecture & Engineering in Chagrin Falls
0.0%
3.0%
Zip Codes with the Highest Percentage of Population Employed in Architecture & Engineering in Chagrin Falls, OH
| Zip Code | % Employed | vs State | vs National | |
| 1. | 44023 | 2.9% | 2.1%(+0.815)#225 | 2.1%(+0.799)#5,243 |
| 2. | 44022 | 1.4% | 2.1%(-0.777)#598 | 2.1%(-0.793)#13,909 |
1
Common Questions
What are the Top Zip Codes with the Highest Percentage of Population Employed in Architecture & Engineering in Chagrin Falls, OH?
Top Zip Codes with the Highest Percentage of Population Employed in Architecture & Engineering in Chagrin Falls, OH are:
What zip code has the Highest Percentage of Population Employed in Architecture & Engineering in Chagrin Falls, OH?
44023 has the Highest Percentage of Population Employed in Architecture & Engineering in Chagrin Falls, OH with 2.9%.
What is the Percentage of Population Employed in Architecture & Engineering in Chagrin Falls, OH?
Percentage of Population Employed in Architecture & Engineering in Chagrin Falls is 0.98%.
What is the Percentage of Population Employed in Architecture & Engineering in Ohio?
Percentage of Population Employed in Architecture & Engineering in Ohio is 2.1%.
What is the Percentage of Population Employed in Architecture & Engineering in the United States?
Percentage of Population Employed in Architecture & Engineering in the United States is 2.1%.