Zip Codes with the Highest Percentage of Population Employed in Architecture & Engineering in Massillon, OH
RELATED REPORTS & OPTIONS
Architecture & Engineering
Massillon
Compare Zip Codes
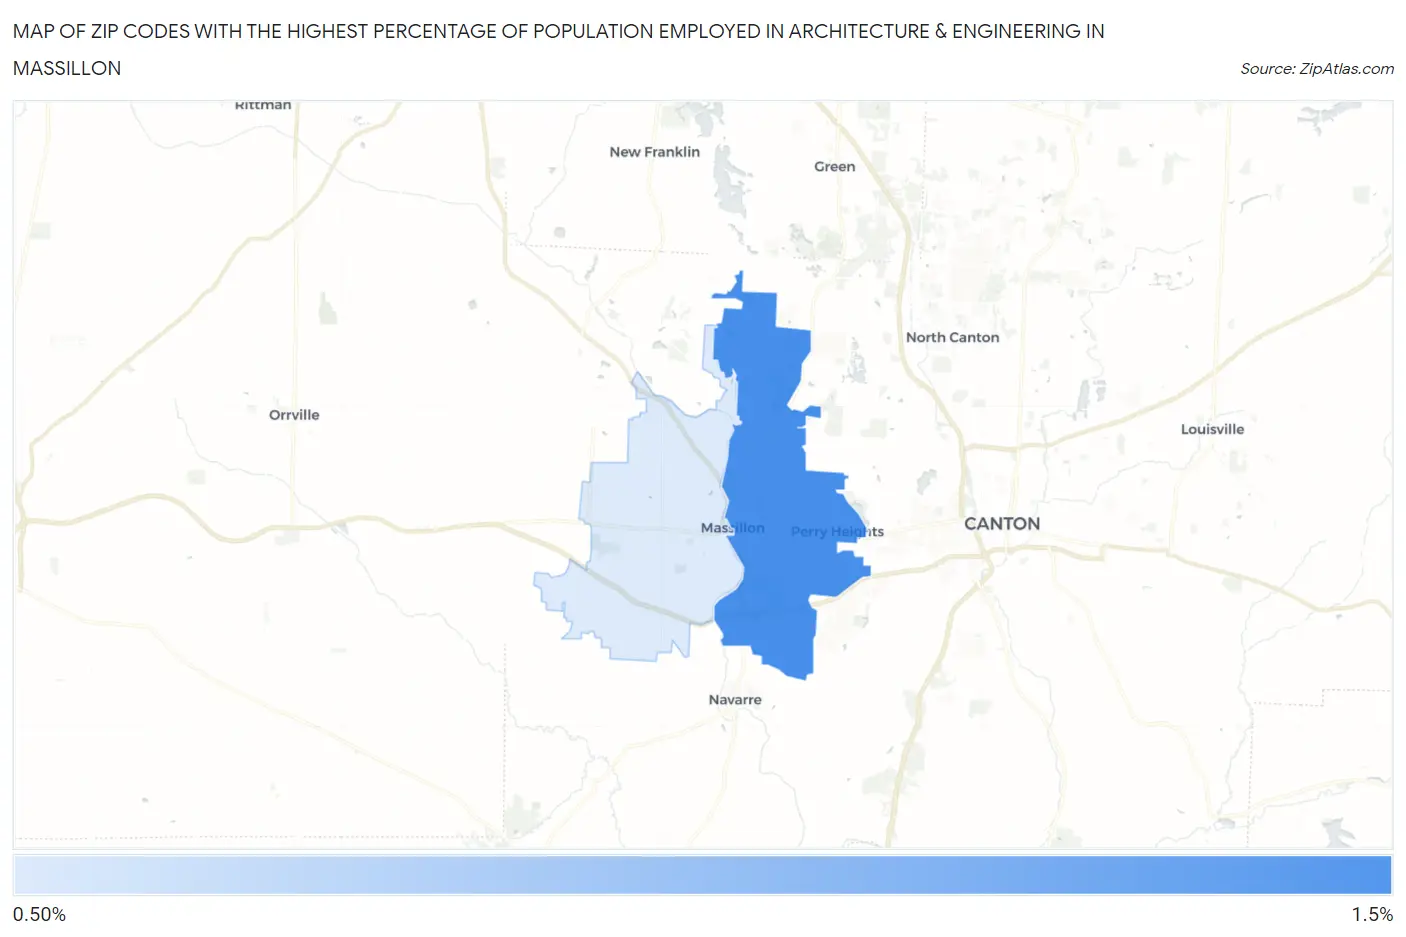
Map of Zip Codes with the Highest Percentage of Population Employed in Architecture & Engineering in Massillon
0.0%
1.5%
Zip Codes with the Highest Percentage of Population Employed in Architecture & Engineering in Massillon, OH
| Zip Code | % Employed | vs State | vs National | |
| 1. | 44646 | 1.2% | 2.1%(-0.916)#648 | 2.1%(-0.932)#14,948 |
| 2. | 44647 | 0.63% | 2.1%(-1.50)#808 | 2.1%(-1.51)#19,363 |
1
Common Questions
What are the Top Zip Codes with the Highest Percentage of Population Employed in Architecture & Engineering in Massillon, OH?
Top Zip Codes with the Highest Percentage of Population Employed in Architecture & Engineering in Massillon, OH are:
What zip code has the Highest Percentage of Population Employed in Architecture & Engineering in Massillon, OH?
44646 has the Highest Percentage of Population Employed in Architecture & Engineering in Massillon, OH with 1.2%.
What is the Percentage of Population Employed in Architecture & Engineering in Massillon, OH?
Percentage of Population Employed in Architecture & Engineering in Massillon is 0.74%.
What is the Percentage of Population Employed in Architecture & Engineering in Ohio?
Percentage of Population Employed in Architecture & Engineering in Ohio is 2.1%.
What is the Percentage of Population Employed in Architecture & Engineering in the United States?
Percentage of Population Employed in Architecture & Engineering in the United States is 2.1%.