Bawcomville, LA
Bawcomville Map
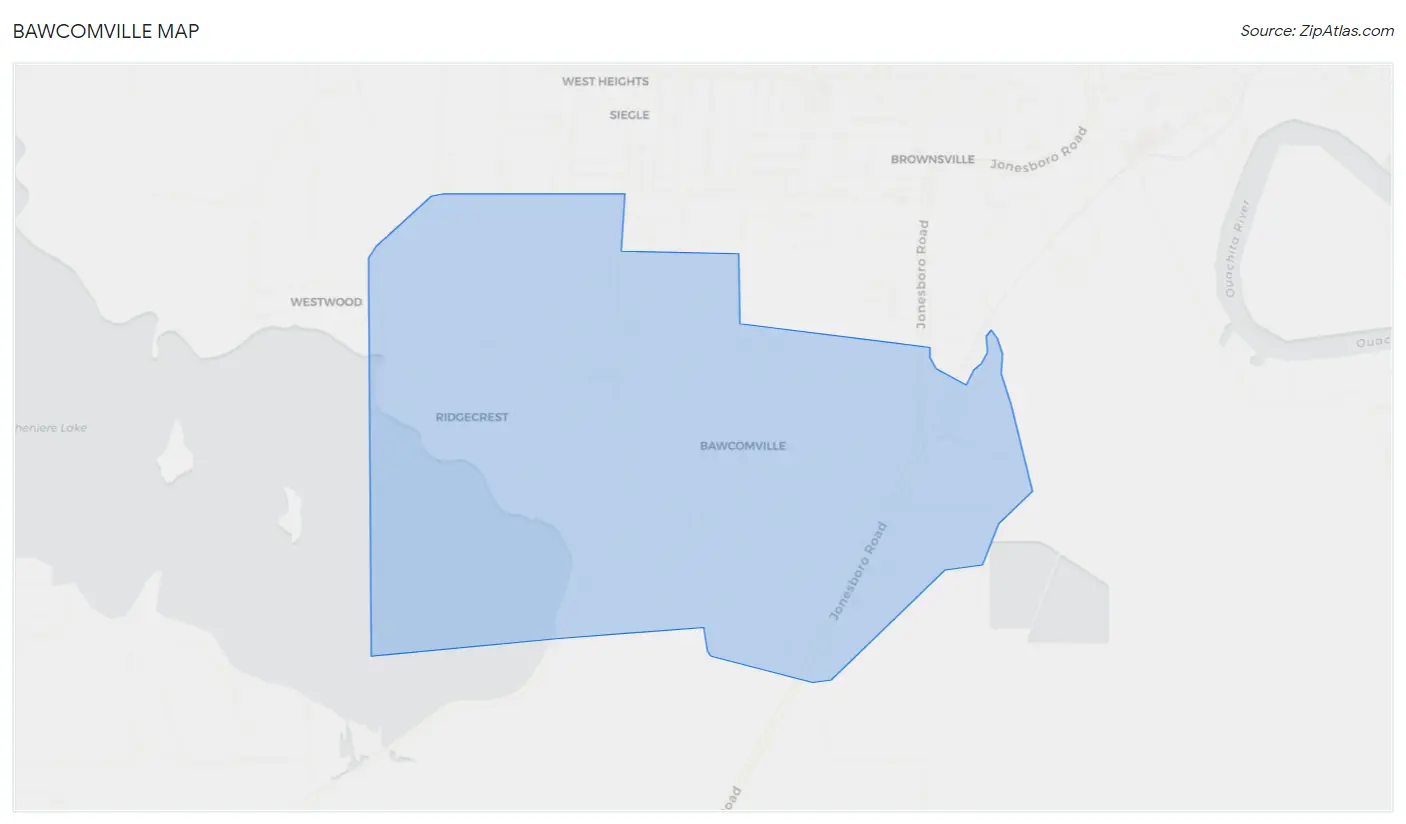
Bawcomville Overview
2,654
TOTAL POPULATION
1,361
MALE POPULATION
1,293
FEMALE POPULATION
105.26
MALES / 100 FEMALES
95.00
FEMALES / 100 MALES
49.5
MEDIAN AGE
2.9
AVG FAMILY SIZE
2.2
AVG HOUSEHOLD SIZE
$20,756
PER CAPITA INCOME
$40,417
AVG FAMILY INCOME
$30,636
AVG HOUSEHOLD INCOME
39.6%
WAGE / INCOME GAP [ % ]
60.4¢/ $1
WAGE / INCOME GAP [ $ ]
0.48
INEQUALITY / GINI INDEX
1,109
LABOR FORCE [ PEOPLE ]
46.5%
PERCENT IN LABOR FORCE
5.6%
UNEMPLOYMENT RATE
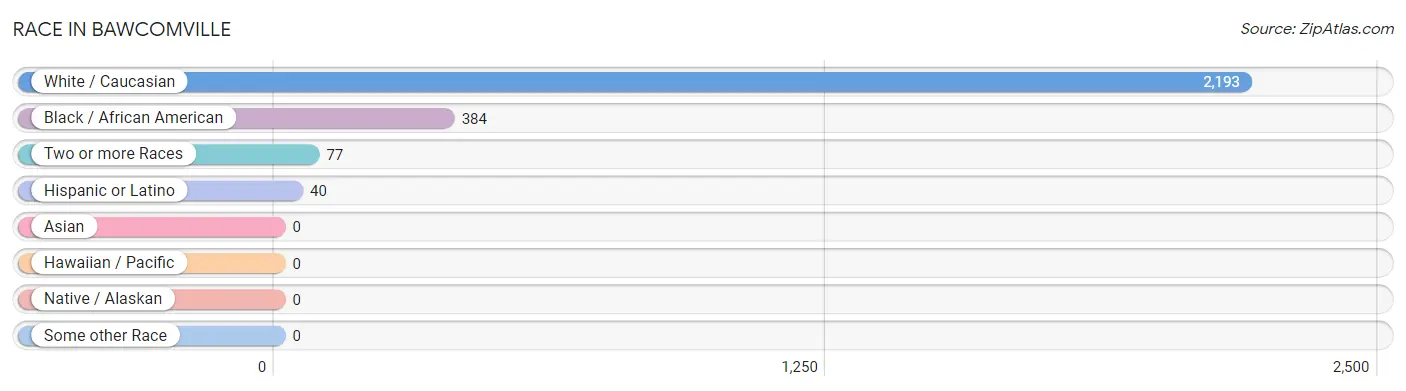
Race in Bawcomville
The most populous races in Bawcomville are White / Caucasian (2,193 | 82.6%), Black / African American (384 | 14.5%), and Two or more Races (77 | 2.9%).
| Race | # Population | % Population |
| Asian | 0 | 0.0% |
| Black / African American | 384 | 14.5% |
| Hawaiian / Pacific | 0 | 0.0% |
| Hispanic or Latino | 40 | 1.5% |
| Native / Alaskan | 0 | 0.0% |
| White / Caucasian | 2,193 | 82.6% |
| Two or more Races | 77 | 2.9% |
| Some other Race | 0 | 0.0% |
| Total | 2,654 | 100.0% |
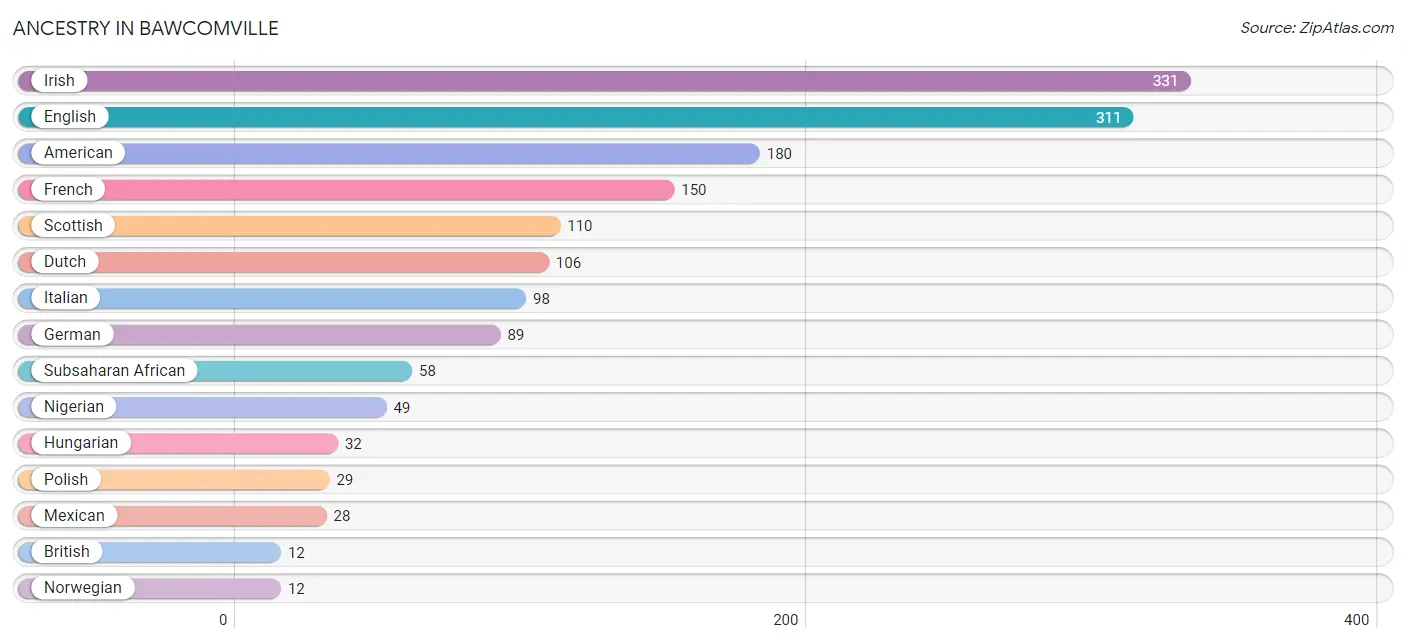
Ancestry in Bawcomville
The most populous ancestries reported in Bawcomville are Irish (331 | 12.5%), English (311 | 11.7%), American (180 | 6.8%), French (150 | 5.7%), and Scottish (110 | 4.1%), together accounting for 40.8% of all Bawcomville residents.
| Ancestry | # Population | % Population |
| African | 9 | 0.3% |
| American | 180 | 6.8% |
| Blackfeet | 9 | 0.3% |
| British | 12 | 0.4% |
| Cherokee | 7 | 0.3% |
| Dutch | 106 | 4.0% |
| English | 311 | 11.7% |
| French | 150 | 5.7% |
| German | 89 | 3.4% |
| Hungarian | 32 | 1.2% |
| Irish | 331 | 12.5% |
| Italian | 98 | 3.7% |
| Mexican | 28 | 1.1% |
| Nigerian | 49 | 1.8% |
| Norwegian | 12 | 0.4% |
| Polish | 29 | 1.1% |
| Russian | 12 | 0.4% |
| Scotch-Irish | 9 | 0.3% |
| Scottish | 110 | 4.1% |
| Spanish | 12 | 0.4% |
| Subsaharan African | 58 | 2.2% | View All 21 Rows |
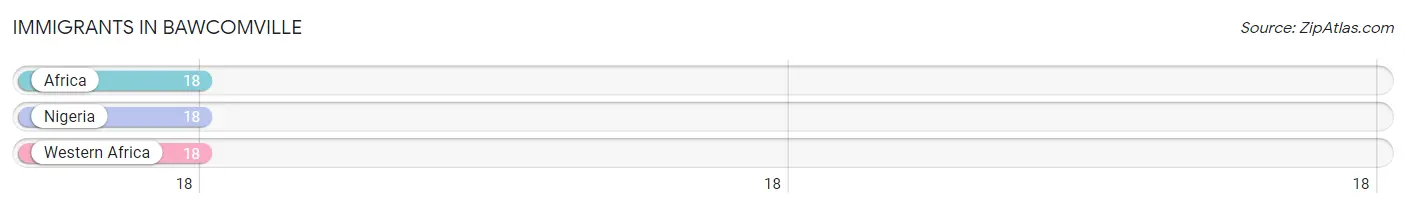
Immigrants in Bawcomville
The most numerous immigrant groups reported in Bawcomville came from Africa (18 | 0.7%), Nigeria (18 | 0.7%), and Western Africa (18 | 0.7%), together accounting for 2.0% of all Bawcomville residents.
| Immigration Origin | # Population | % Population |
| Africa | 18 | 0.7% |
| Nigeria | 18 | 0.7% |
| Western Africa | 18 | 0.7% | View All 3 Rows |
Sex and Age in Bawcomville
Sex and Age in Bawcomville
The most populous age groups in Bawcomville are 50 to 54 Years (166 | 12.2%) for men and 35 to 39 Years (269 | 20.8%) for women.
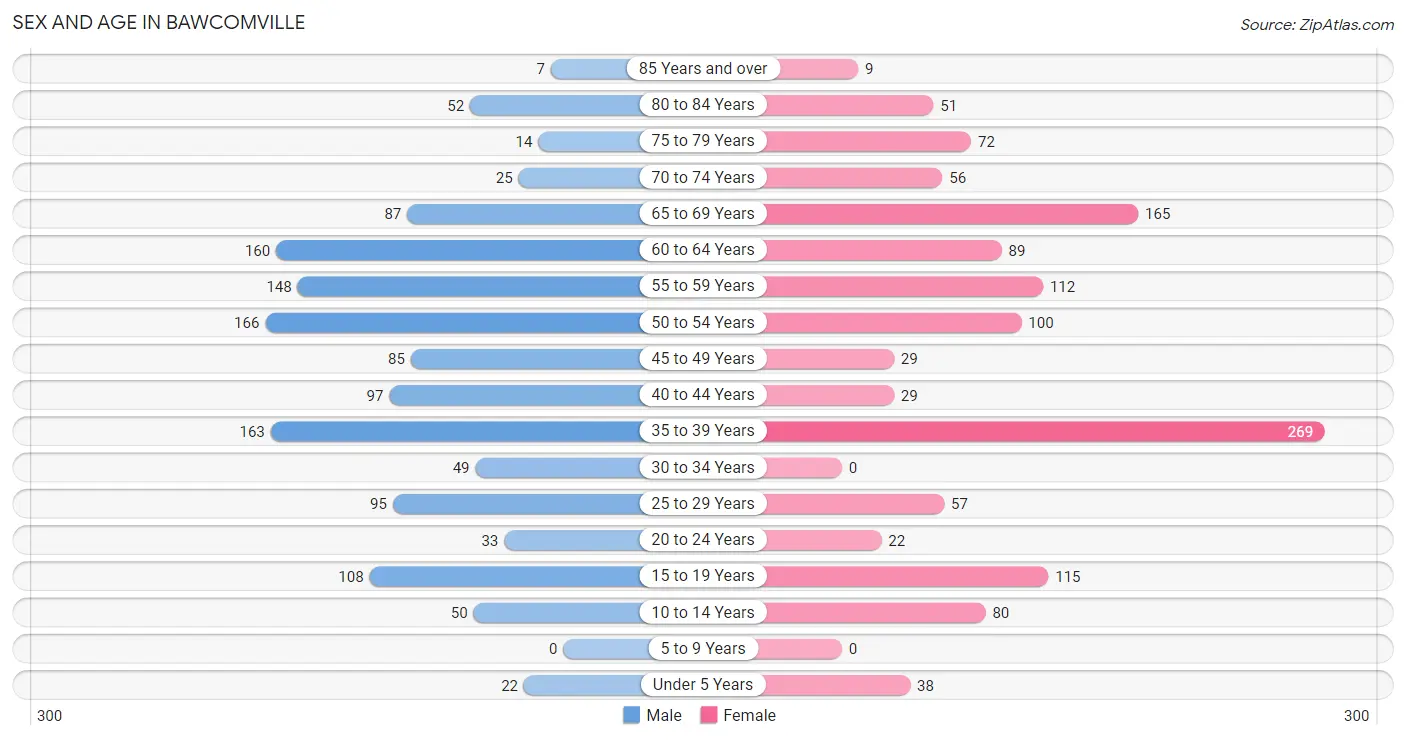
| Age Bracket | Male | Female |
| Under 5 Years | 22 (1.6%) | 38 (2.9%) |
| 5 to 9 Years | 0 (0.0%) | 0 (0.0%) |
| 10 to 14 Years | 50 (3.7%) | 80 (6.2%) |
| 15 to 19 Years | 108 (7.9%) | 115 (8.9%) |
| 20 to 24 Years | 33 (2.4%) | 22 (1.7%) |
| 25 to 29 Years | 95 (7.0%) | 57 (4.4%) |
| 30 to 34 Years | 49 (3.6%) | 0 (0.0%) |
| 35 to 39 Years | 163 (12.0%) | 269 (20.8%) |
| 40 to 44 Years | 97 (7.1%) | 29 (2.2%) |
| 45 to 49 Years | 85 (6.2%) | 29 (2.2%) |
| 50 to 54 Years | 166 (12.2%) | 100 (7.7%) |
| 55 to 59 Years | 148 (10.9%) | 112 (8.7%) |
| 60 to 64 Years | 160 (11.8%) | 89 (6.9%) |
| 65 to 69 Years | 87 (6.4%) | 165 (12.8%) |
| 70 to 74 Years | 25 (1.8%) | 56 (4.3%) |
| 75 to 79 Years | 14 (1.0%) | 72 (5.6%) |
| 80 to 84 Years | 52 (3.8%) | 51 (3.9%) |
| 85 Years and over | 7 (0.5%) | 9 (0.7%) |
| Total | 1,361 (100.0%) | 1,293 (100.0%) |
Families and Households in Bawcomville
Median Family Size in Bawcomville
The median family size in Bawcomville is 2.94 persons per family, with single male/father families (118 | 17.4%) accounting for the largest median family size of 3.4 persons per family. On the other hand, single female/mother families (176 | 25.9%) represent the smallest median family size with 2.77 persons per family.
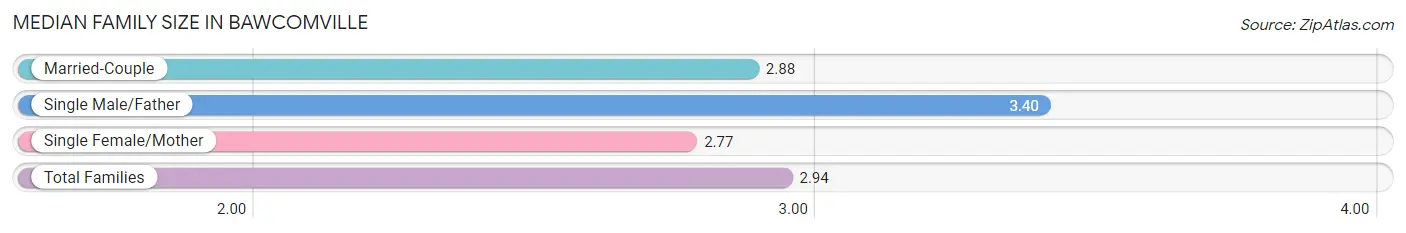
| Family Type | # Families | Family Size |
| Married-Couple | 385 (56.7%) | 2.88 |
| Single Male/Father | 118 (17.4%) | 3.40 |
| Single Female/Mother | 176 (25.9%) | 2.77 |
| Total Families | 679 (100.0%) | 2.94 |
Median Household Size in Bawcomville
The median household size in Bawcomville is 2.23 persons per household, with single male/father households (118 | 9.9%) accounting for the largest median household size of 3.4 persons per household. non-family households (509 | 42.8%) represent the smallest median household size with 1.22 persons per household.
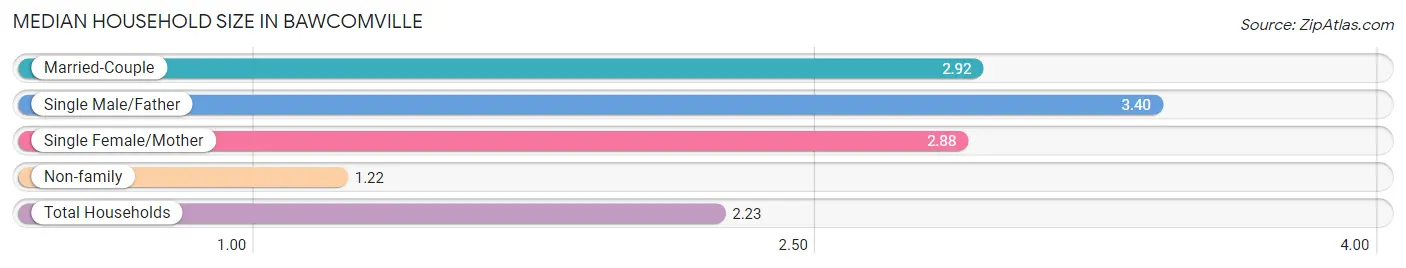
| Household Type | # Households | Household Size |
| Married-Couple | 385 (32.4%) | 2.92 |
| Single Male/Father | 118 (9.9%) | 3.40 |
| Single Female/Mother | 176 (14.8%) | 2.88 |
| Non-family | 509 (42.8%) | 1.22 |
| Total Households | 1,188 (100.0%) | 2.23 |
Household Size by Marriage Status in Bawcomville
Out of a total of 1,188 households in Bawcomville, 679 (57.2%) are family households, while 509 (42.8%) are nonfamily households. The most numerous type of family households are 2-person households, comprising 357, and the most common type of nonfamily households are 1-person households, comprising 430.
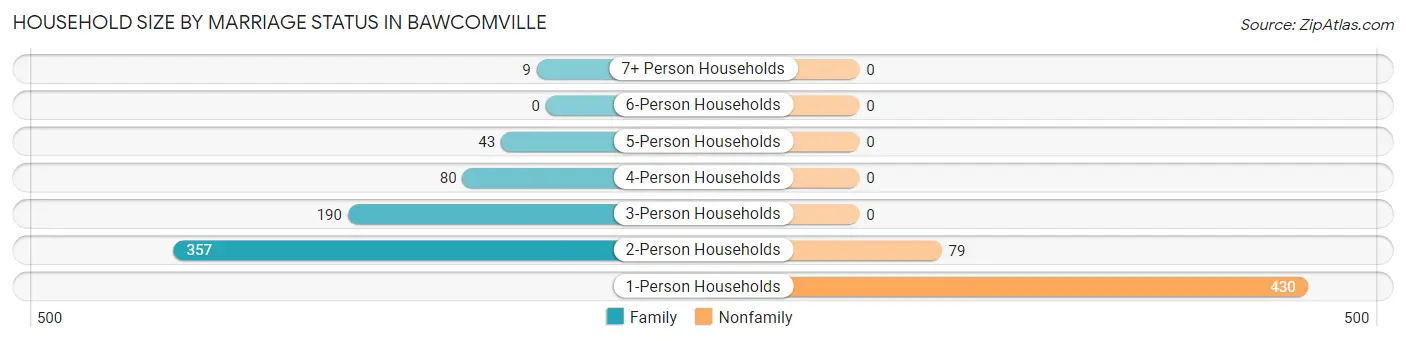
| Household Size | Family Households | Nonfamily Households |
| 1-Person Households | - | 430 (36.2%) |
| 2-Person Households | 357 (30.0%) | 79 (6.7%) |
| 3-Person Households | 190 (16.0%) | 0 (0.0%) |
| 4-Person Households | 80 (6.7%) | 0 (0.0%) |
| 5-Person Households | 43 (3.6%) | 0 (0.0%) |
| 6-Person Households | 0 (0.0%) | 0 (0.0%) |
| 7+ Person Households | 9 (0.8%) | 0 (0.0%) |
| Total | 679 (57.2%) | 509 (42.8%) |
Female Fertility in Bawcomville
Fertility by Age in Bawcomville
Average fertility rate in Bawcomville is 15.0 births per 1,000 women. Women in the age bracket of 20 to 34 years have the highest fertility rate with 101.0 births per 1,000 women. Women in the age bracket of 20 to 34 years acount for 100.0% of all women with births.
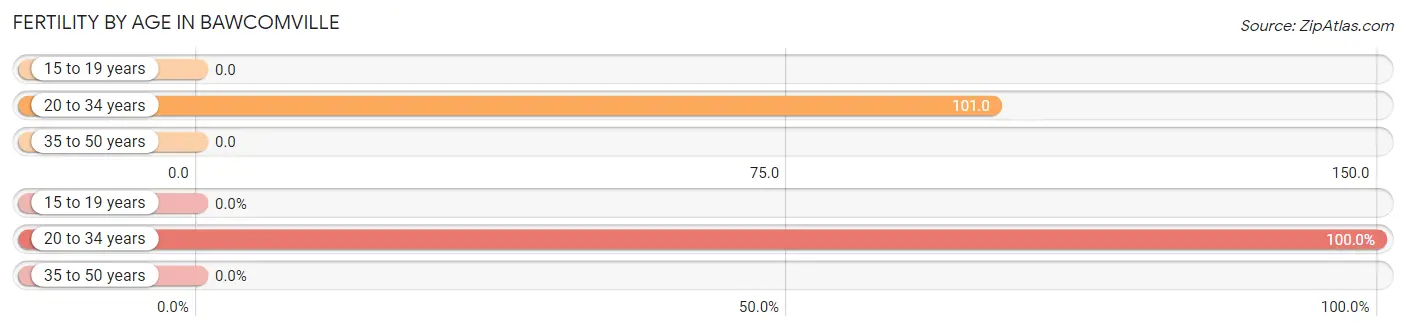
| Age Bracket | Women with Births | Births / 1,000 Women |
| 15 to 19 years | 0 (0.0%) | 0.0 |
| 20 to 34 years | 8 (100.0%) | 101.0 |
| 35 to 50 years | 0 (0.0%) | 0.0 |
| Total | 8 (100.0%) | 15.0 |
Fertility by Age by Marriage Status in Bawcomville
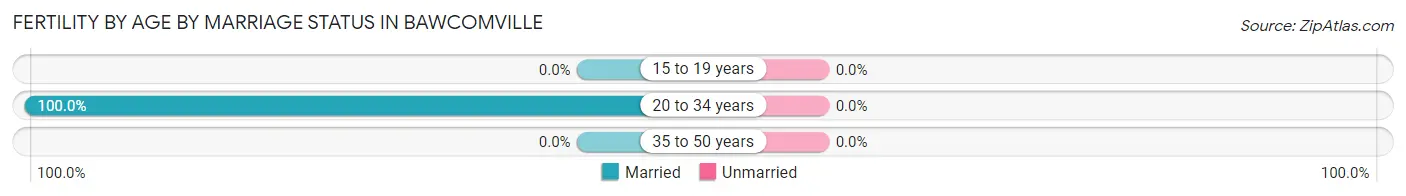
| Age Bracket | Married | Unmarried |
| 15 to 19 years | 0 (0.0%) | 0 (0.0%) |
| 20 to 34 years | 8 (100.0%) | 0 (0.0%) |
| 35 to 50 years | 0 (0.0%) | 0 (0.0%) |
| Total | 8 (100.0%) | 0 (0.0%) |
Fertility by Education in Bawcomville
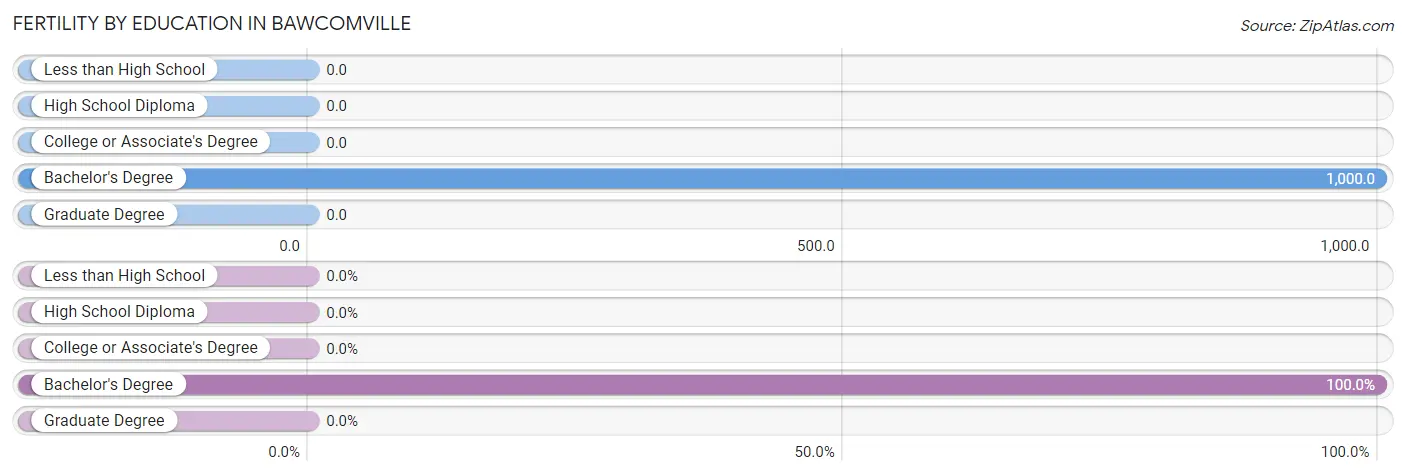
| Educational Attainment | Women with Births | Births / 1,000 Women |
| Less than High School | 0 (0.0%) | 0.0 |
| High School Diploma | 0 (0.0%) | 0.0 |
| College or Associate's Degree | 0 (0.0%) | 0.0 |
| Bachelor's Degree | 8 (100.0%) | 1,000.0 |
| Graduate Degree | 0 (0.0%) | 0.0 |
| Total | 8 (100.0%) | 15.0 |
Fertility by Education by Marriage Status in Bawcomville
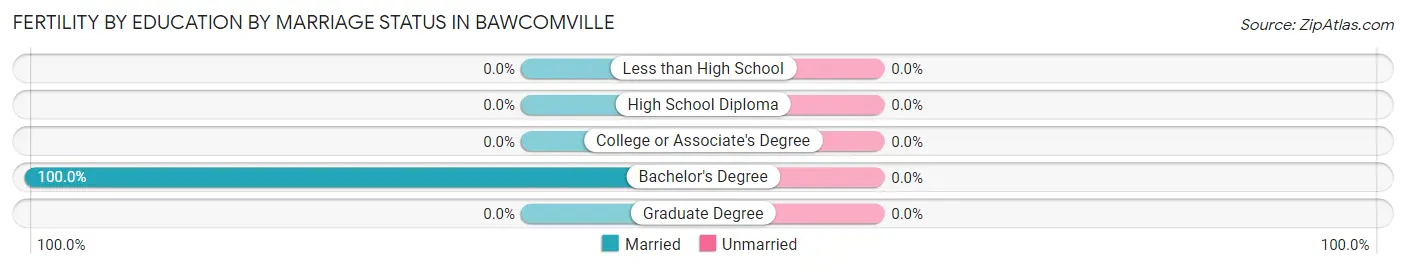
| Educational Attainment | Married | Unmarried |
| Less than High School | 0 (0.0%) | 0 (0.0%) |
| High School Diploma | 0 (0.0%) | 0 (0.0%) |
| College or Associate's Degree | 0 (0.0%) | 0 (0.0%) |
| Bachelor's Degree | 8 (100.0%) | 0 (0.0%) |
| Graduate Degree | 0 (0.0%) | 0 (0.0%) |
| Total | 8 (100.0%) | 0 (0.0%) |
Income in Bawcomville
Income Overview in Bawcomville
Per Capita Income in Bawcomville is $20,756, while median incomes of families and households are $40,417 and $30,636 respectively.
| Characteristic | Number | Measure |
| Per Capita Income | 2,654 | $20,756 |
| Median Family Income | 679 | $40,417 |
| Mean Family Income | 679 | $52,306 |
| Median Household Income | 1,188 | $30,636 |
| Mean Household Income | 1,188 | $42,582 |
| Income Deficit | 679 | $0 |
| Wage / Income Gap (%) | 2,654 | 39.56% |
| Wage / Income Gap ($) | 2,654 | 60.44¢ per $1 |
| Gini / Inequality Index | 2,654 | 0.48 |
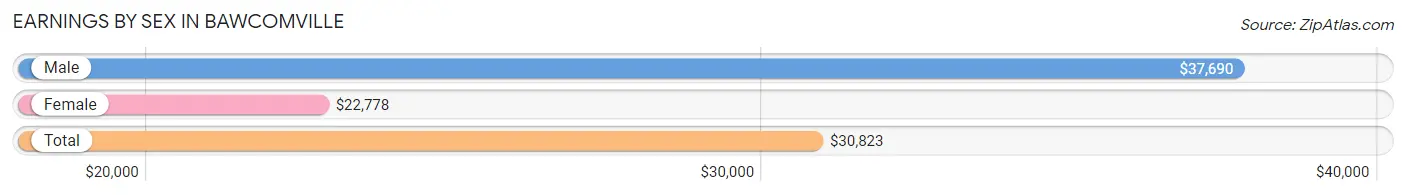
Earnings by Sex in Bawcomville
Average Earnings in Bawcomville are $30,823, $37,690 for men and $22,778 for women, a difference of 39.6%.
| Sex | Number | Average Earnings |
| Male | 813 (67.0%) | $37,690 |
| Female | 400 (33.0%) | $22,778 |
| Total | 1,213 (100.0%) | $30,823 |
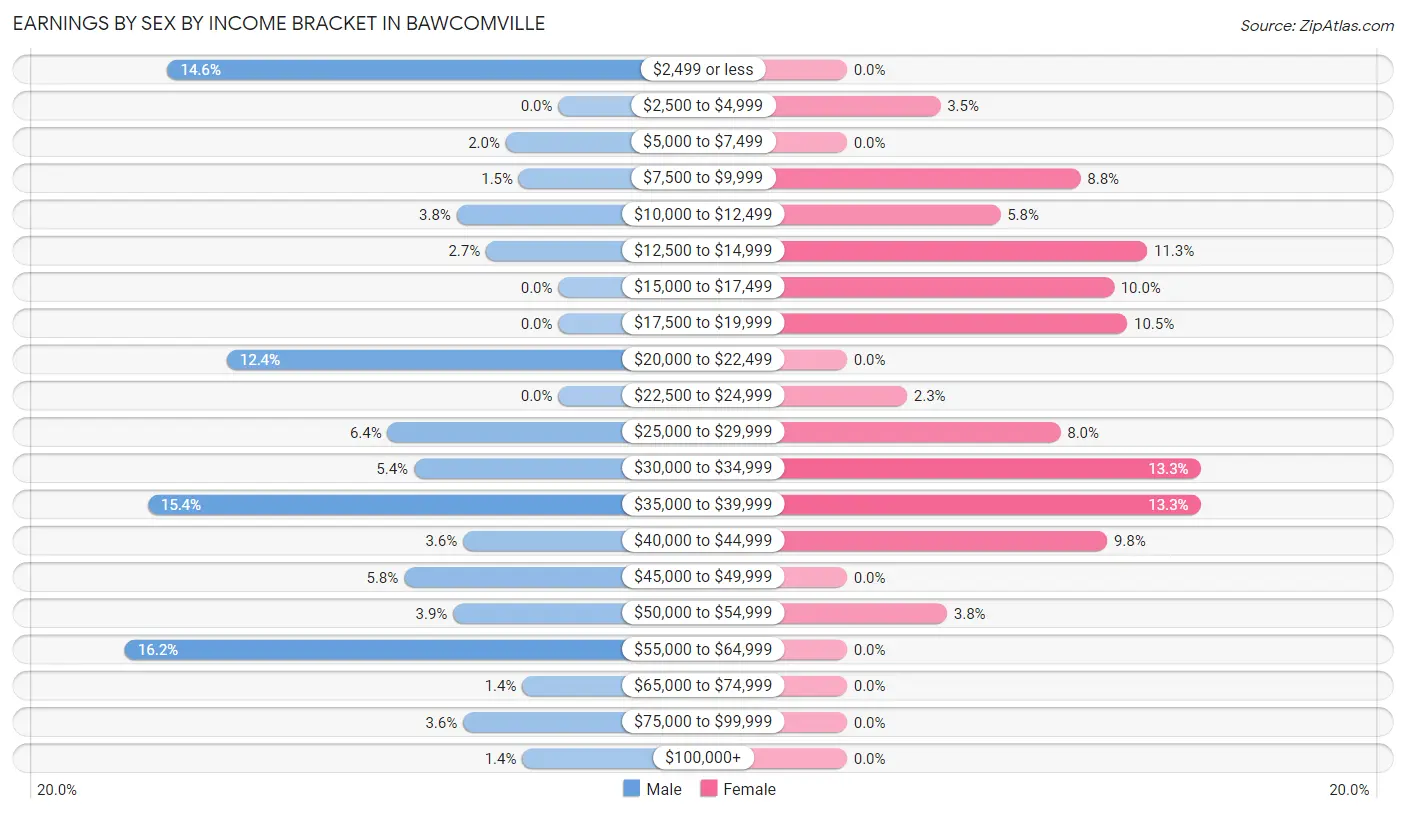
Earnings by Sex by Income Bracket in Bawcomville
The most common earnings brackets in Bawcomville are $55,000 to $64,999 for men (132 | 16.2%) and $30,000 to $34,999 for women (53 | 13.3%).
| Income | Male | Female |
| $2,499 or less | 119 (14.6%) | 0 (0.0%) |
| $2,500 to $4,999 | 0 (0.0%) | 14 (3.5%) |
| $5,000 to $7,499 | 16 (2.0%) | 0 (0.0%) |
| $7,500 to $9,999 | 12 (1.5%) | 35 (8.7%) |
| $10,000 to $12,499 | 31 (3.8%) | 23 (5.8%) |
| $12,500 to $14,999 | 22 (2.7%) | 45 (11.3%) |
| $15,000 to $17,499 | 0 (0.0%) | 40 (10.0%) |
| $17,500 to $19,999 | 0 (0.0%) | 42 (10.5%) |
| $20,000 to $22,499 | 101 (12.4%) | 0 (0.0%) |
| $22,500 to $24,999 | 0 (0.0%) | 9 (2.2%) |
| $25,000 to $29,999 | 52 (6.4%) | 32 (8.0%) |
| $30,000 to $34,999 | 44 (5.4%) | 53 (13.3%) |
| $35,000 to $39,999 | 125 (15.4%) | 53 (13.3%) |
| $40,000 to $44,999 | 29 (3.6%) | 39 (9.8%) |
| $45,000 to $49,999 | 47 (5.8%) | 0 (0.0%) |
| $50,000 to $54,999 | 32 (3.9%) | 15 (3.7%) |
| $55,000 to $64,999 | 132 (16.2%) | 0 (0.0%) |
| $65,000 to $74,999 | 11 (1.3%) | 0 (0.0%) |
| $75,000 to $99,999 | 29 (3.6%) | 0 (0.0%) |
| $100,000+ | 11 (1.3%) | 0 (0.0%) |
| Total | 813 (100.0%) | 400 (100.0%) |
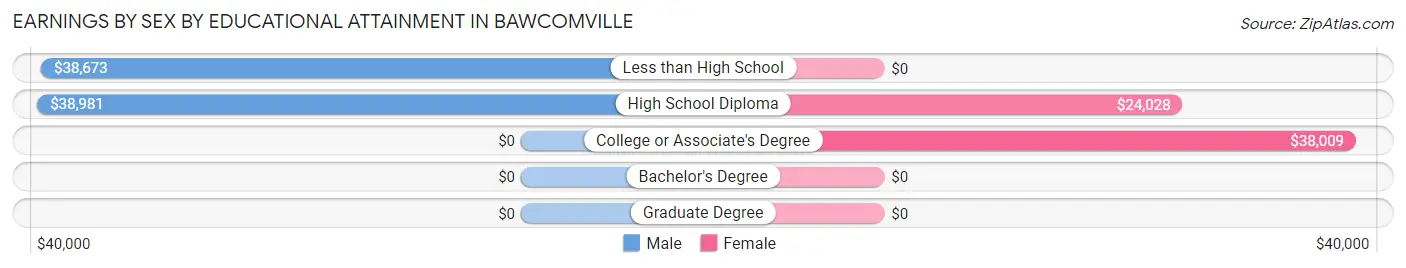
Earnings by Sex by Educational Attainment in Bawcomville
Average earnings in Bawcomville are $38,470 for men and $29,492 for women, a difference of 23.3%. Men with an educational attainment of high school diploma enjoy the highest average annual earnings of $38,981, while those with less than high school education earn the least with $38,673. Women with an educational attainment of college or associate's degree earn the most with the average annual earnings of $38,009, while those with high school diploma education have the smallest earnings of $24,028.
| Educational Attainment | Male Income | Female Income |
| Less than High School | $38,673 | $0 |
| High School Diploma | $38,981 | $24,028 |
| College or Associate's Degree | - | - |
| Bachelor's Degree | - | - |
| Graduate Degree | - | - |
| Total | $38,470 | $29,492 |
Family Income in Bawcomville
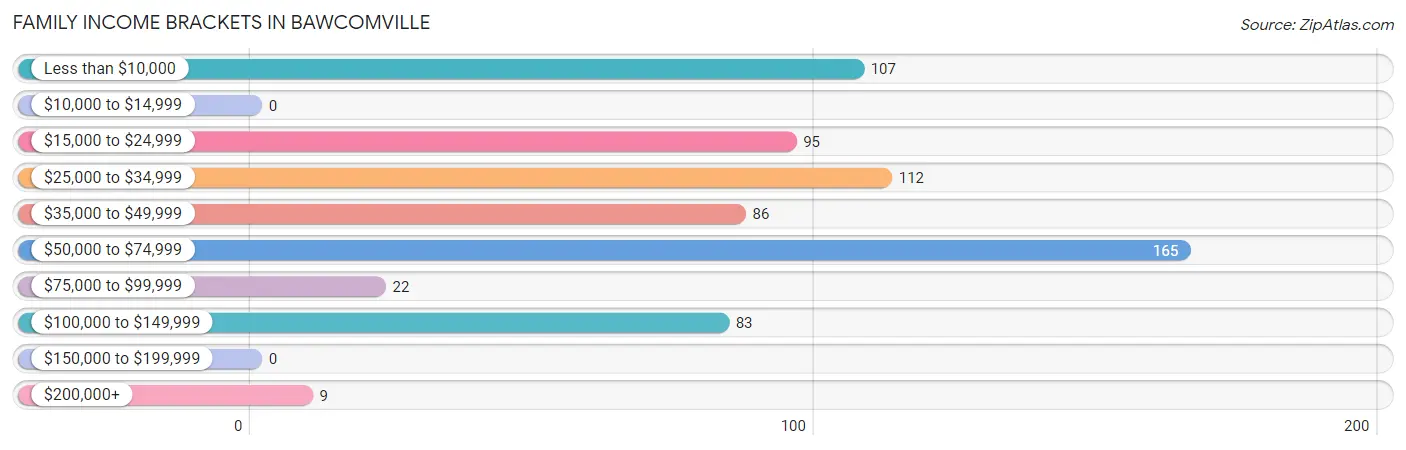
Family Income Brackets in Bawcomville
According to the Bawcomville family income data, there are 165 families falling into the $50,000 to $74,999 income range, which is the most common income bracket and makes up 24.3% of all families.
| Income Bracket | # Families | % Families |
| Less than $10,000 | 107 | 15.8% |
| $10,000 to $14,999 | 0 | 0.0% |
| $15,000 to $24,999 | 95 | 14.0% |
| $25,000 to $34,999 | 112 | 16.5% |
| $35,000 to $49,999 | 86 | 12.7% |
| $50,000 to $74,999 | 165 | 24.3% |
| $75,000 to $99,999 | 22 | 3.2% |
| $100,000 to $149,999 | 83 | 12.2% |
| $150,000 to $199,999 | 0 | 0.0% |
| $200,000+ | 9 | 1.3% |
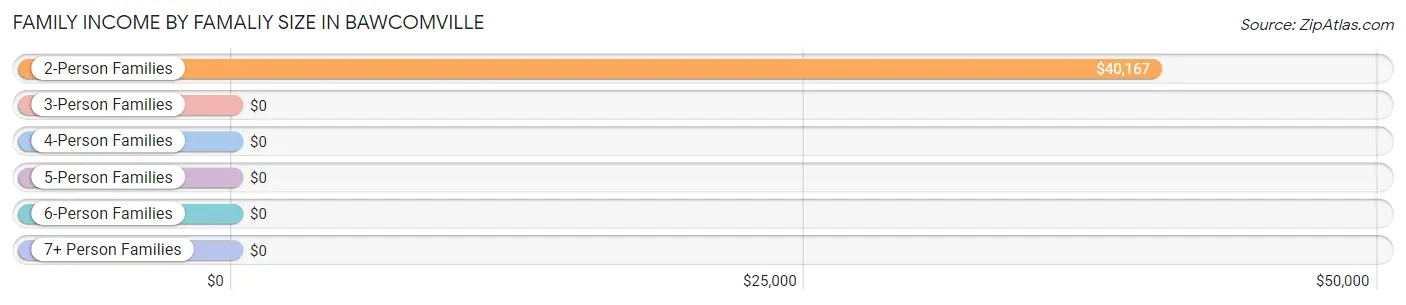
Family Income by Famaliy Size in Bawcomville
2-person families (368 | 54.2%) account for the highest median family income in Bawcomville with $40,167 per family, while 2-person families (368 | 54.2%) have the highest median income of $20,084 per family member.
| Income Bracket | # Families | Median Income |
| 2-Person Families | 368 (54.2%) | $40,167 |
| 3-Person Families | 179 (26.4%) | $0 |
| 4-Person Families | 80 (11.8%) | $0 |
| 5-Person Families | 43 (6.3%) | $0 |
| 6-Person Families | 0 (0.0%) | $0 |
| 7+ Person Families | 9 (1.3%) | $0 |
| Total | 679 (100.0%) | $40,417 |
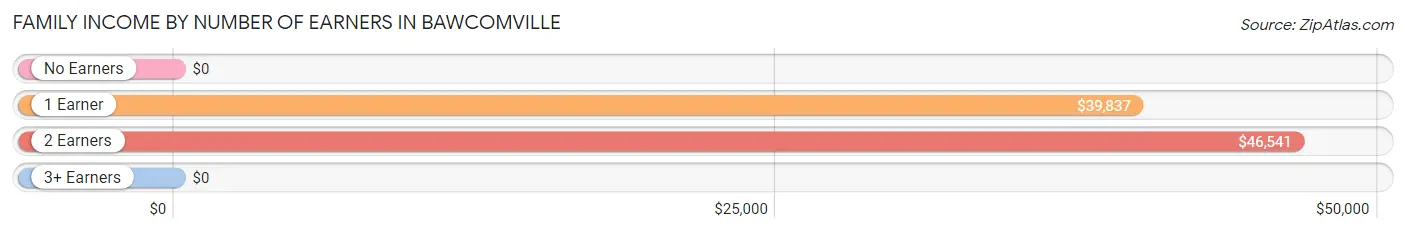
Family Income by Number of Earners in Bawcomville
| Number of Earners | # Families | Median Income |
| No Earners | 200 (29.5%) | $0 |
| 1 Earner | 169 (24.9%) | $39,837 |
| 2 Earners | 301 (44.3%) | $46,541 |
| 3+ Earners | 9 (1.3%) | $0 |
| Total | 679 (100.0%) | $40,417 |
Household Income in Bawcomville
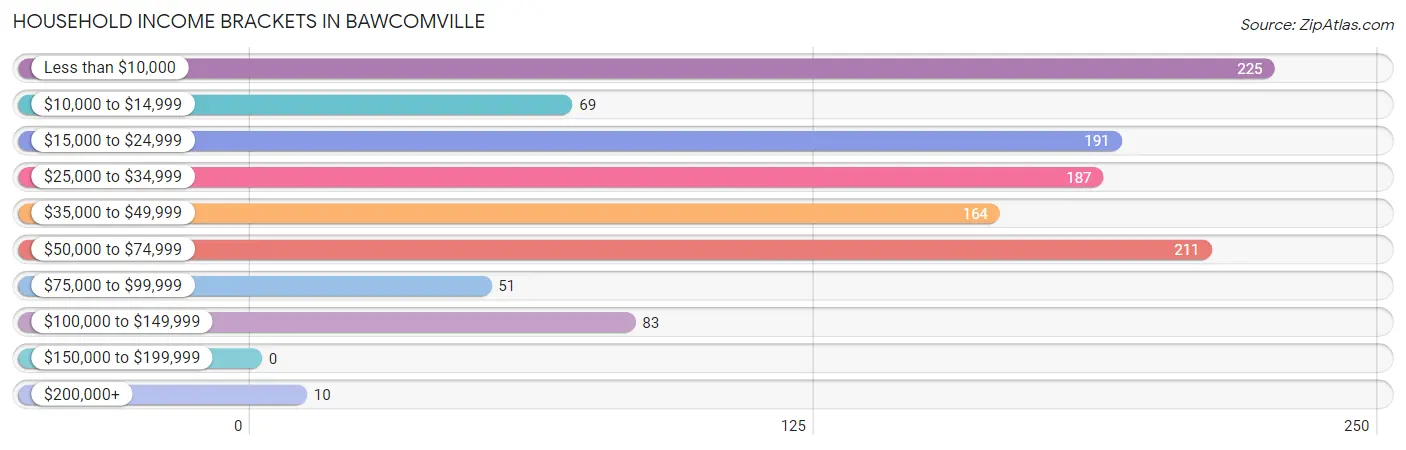
Household Income Brackets in Bawcomville
With 225 households falling in the category, the less than $10,000 income range is the most frequent in Bawcomville, accounting for 18.9% of all households.
| Income Bracket | # Households | % Households |
| Less than $10,000 | 225 | 18.9% |
| $10,000 to $14,999 | 69 | 5.8% |
| $15,000 to $24,999 | 191 | 16.1% |
| $25,000 to $34,999 | 187 | 15.7% |
| $35,000 to $49,999 | 164 | 13.8% |
| $50,000 to $74,999 | 211 | 17.8% |
| $75,000 to $99,999 | 51 | 4.3% |
| $100,000 to $149,999 | 83 | 7.0% |
| $150,000 to $199,999 | 0 | 0.0% |
| $200,000+ | 10 | 0.8% |
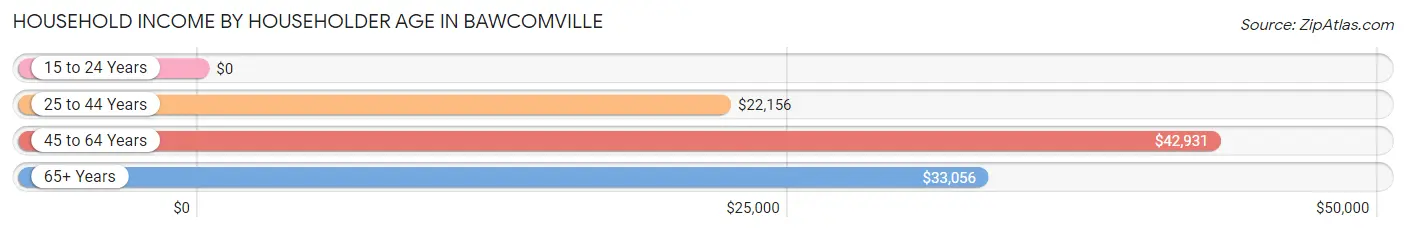
Household Income by Householder Age in Bawcomville
The median household income in Bawcomville is $30,636, with the highest median household income of $42,931 found in the 45 to 64 years age bracket for the primary householder. A total of 504 households (42.4%) fall into this category. Meanwhile, the 15 to 24 years age bracket for the primary householder has the lowest median household income of $0, with 5 households (0.4%) in this group.
| Income Bracket | # Households | Median Income |
| 15 to 24 Years | 5 (0.4%) | $0 |
| 25 to 44 Years | 283 (23.8%) | $22,156 |
| 45 to 64 Years | 504 (42.4%) | $42,931 |
| 65+ Years | 396 (33.3%) | $33,056 |
| Total | 1,188 (100.0%) | $30,636 |
Poverty in Bawcomville
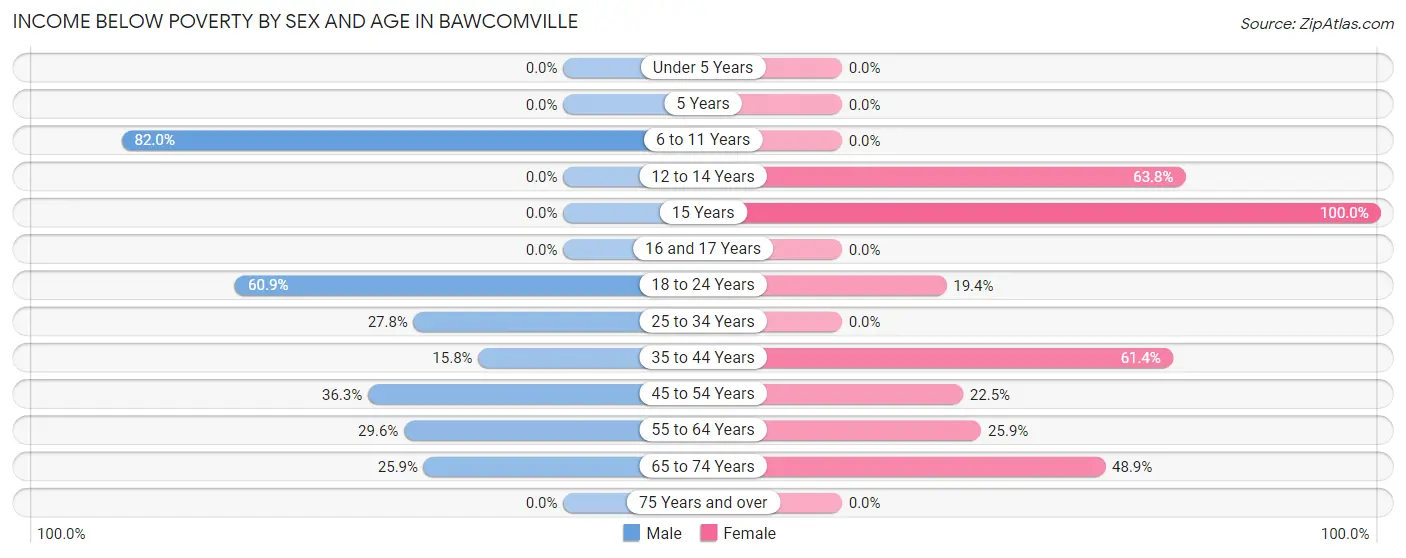
Income Below Poverty by Sex and Age in Bawcomville
With 29.4% poverty level for males and 39.1% for females among the residents of Bawcomville, 6 to 11 year old males and 15 year old females are the most vulnerable to poverty, with 41 males (82.0%) and 70 females (100.0%) in their respective age groups living below the poverty level.
| Age Bracket | Male | Female |
| Under 5 Years | 0 (0.0%) | 0 (0.0%) |
| 5 Years | 0 (0.0%) | 0 (0.0%) |
| 6 to 11 Years | 41 (82.0%) | 0 (0.0%) |
| 12 to 14 Years | 0 (0.0%) | 51 (63.7%) |
| 15 Years | 0 (0.0%) | 70 (100.0%) |
| 16 and 17 Years | 0 (0.0%) | 0 (0.0%) |
| 18 to 24 Years | 67 (60.9%) | 13 (19.4%) |
| 25 to 34 Years | 40 (27.8%) | 0 (0.0%) |
| 35 to 44 Years | 41 (15.8%) | 183 (61.4%) |
| 45 to 54 Years | 91 (36.2%) | 29 (22.5%) |
| 55 to 64 Years | 91 (29.5%) | 52 (25.9%) |
| 65 to 74 Years | 29 (25.9%) | 108 (48.9%) |
| 75 Years and over | 0 (0.0%) | 0 (0.0%) |
| Total | 400 (29.4%) | 506 (39.1%) |
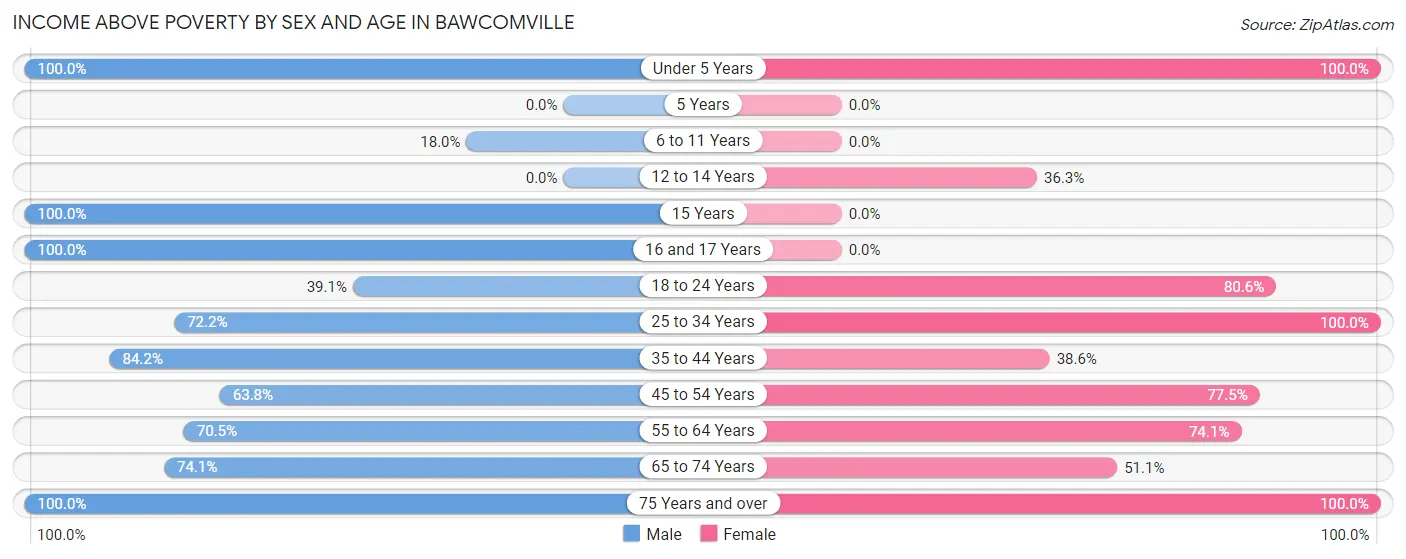
Income Above Poverty by Sex and Age in Bawcomville
According to the poverty statistics in Bawcomville, males aged under 5 years and females aged under 5 years are the age groups that are most secure financially, with 100.0% of males and 100.0% of females in these age groups living above the poverty line.
| Age Bracket | Male | Female |
| Under 5 Years | 22 (100.0%) | 38 (100.0%) |
| 5 Years | 0 (0.0%) | 0 (0.0%) |
| 6 to 11 Years | 9 (18.0%) | 0 (0.0%) |
| 12 to 14 Years | 0 (0.0%) | 29 (36.2%) |
| 15 Years | 9 (100.0%) | 0 (0.0%) |
| 16 and 17 Years | 22 (100.0%) | 0 (0.0%) |
| 18 to 24 Years | 43 (39.1%) | 54 (80.6%) |
| 25 to 34 Years | 104 (72.2%) | 57 (100.0%) |
| 35 to 44 Years | 219 (84.2%) | 115 (38.6%) |
| 45 to 54 Years | 160 (63.7%) | 100 (77.5%) |
| 55 to 64 Years | 217 (70.5%) | 149 (74.1%) |
| 65 to 74 Years | 83 (74.1%) | 113 (51.1%) |
| 75 Years and over | 73 (100.0%) | 132 (100.0%) |
| Total | 961 (70.6%) | 787 (60.9%) |
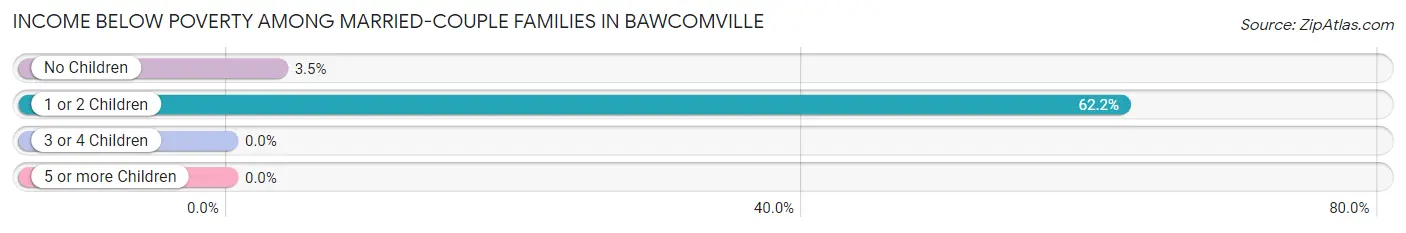
Income Below Poverty Among Married-Couple Families in Bawcomville
The poverty statistics for married-couple families in Bawcomville show that 20.0% or 77 of the total 385 families live below the poverty line. Families with 1 or 2 children have the highest poverty rate of 62.2%, comprising of 69 families. On the other hand, families with 3 or 4 children have the lowest poverty rate of 0.0%, which includes 0 families.
| Children | Above Poverty | Below Poverty |
| No Children | 223 (96.5%) | 8 (3.5%) |
| 1 or 2 Children | 42 (37.8%) | 69 (62.2%) |
| 3 or 4 Children | 43 (100.0%) | 0 (0.0%) |
| 5 or more Children | 0 (0.0%) | 0 (0.0%) |
| Total | 308 (80.0%) | 77 (20.0%) |
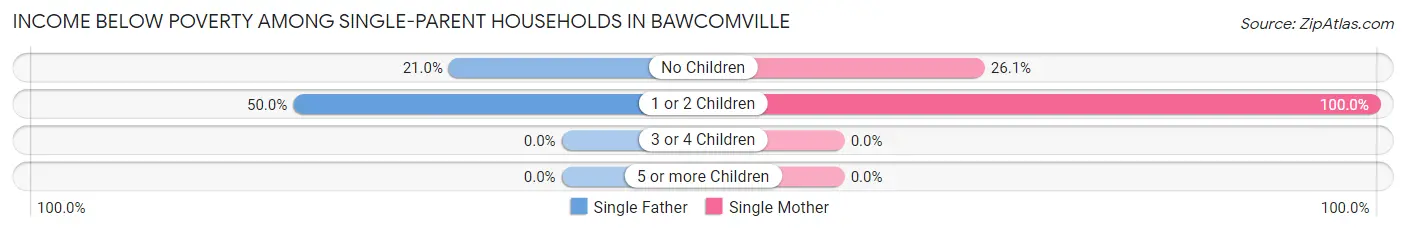
Income Below Poverty Among Single-Parent Households in Bawcomville
According to the poverty data in Bawcomville, 25.4% or 30 single-father households and 43.8% or 77 single-mother households are living below the poverty line. Among single-father households, those with 1 or 2 children have the highest poverty rate, with 9 households (50.0%) experiencing poverty. Likewise, among single-mother households, those with 1 or 2 children have the highest poverty rate, with 42 households (100.0%) falling below the poverty line.
| Children | Single Father | Single Mother |
| No Children | 21 (21.0%) | 35 (26.1%) |
| 1 or 2 Children | 9 (50.0%) | 42 (100.0%) |
| 3 or 4 Children | 0 (0.0%) | 0 (0.0%) |
| 5 or more Children | 0 (0.0%) | 0 (0.0%) |
| Total | 30 (25.4%) | 77 (43.8%) |
Income Below Poverty Among Married-Couple vs Single-Parent Households in Bawcomville
The poverty data for Bawcomville shows that 77 of the married-couple family households (20.0%) and 107 of the single-parent households (36.4%) are living below the poverty level. Within the married-couple family households, those with 1 or 2 children have the highest poverty rate, with 69 households (62.2%) falling below the poverty line. Among the single-parent households, those with 1 or 2 children have the highest poverty rate, with 51 household (85.0%) living below poverty.
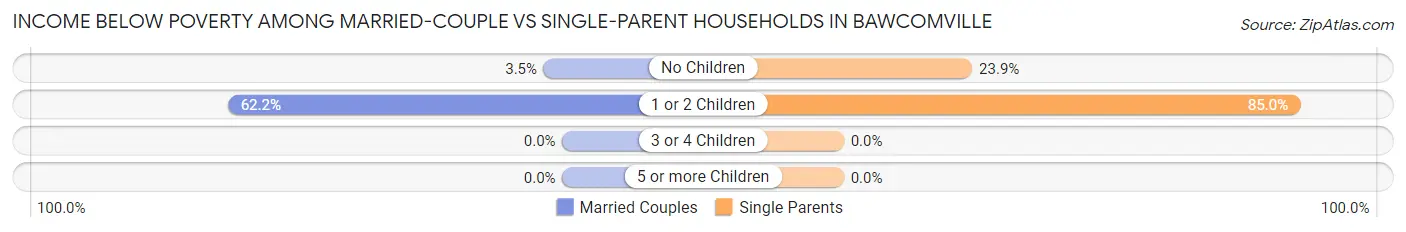
| Children | Married-Couple Families | Single-Parent Households |
| No Children | 8 (3.5%) | 56 (23.9%) |
| 1 or 2 Children | 69 (62.2%) | 51 (85.0%) |
| 3 or 4 Children | 0 (0.0%) | 0 (0.0%) |
| 5 or more Children | 0 (0.0%) | 0 (0.0%) |
| Total | 77 (20.0%) | 107 (36.4%) |
Employment Characteristics in Bawcomville
Employment by Class of Employer in Bawcomville
Among the 1,037 employed individuals in Bawcomville, private company employees (882 | 85.1%), state government employees (88 | 8.5%), and self-employed (not incorporated) (31 | 3.0%) make up the most common classes of employment.
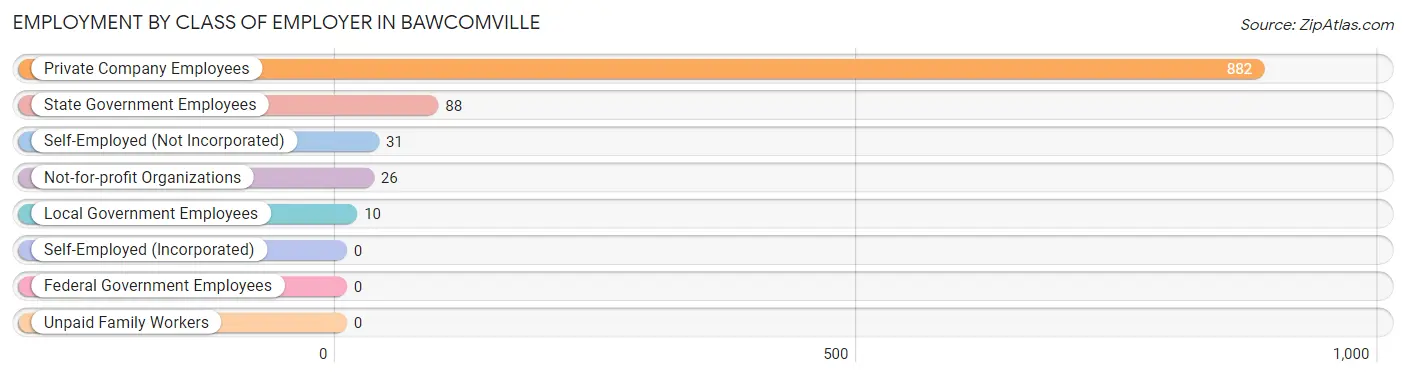
| Employer Class | # Employees | % Employees |
| Private Company Employees | 882 | 85.1% |
| Self-Employed (Incorporated) | 0 | 0.0% |
| Self-Employed (Not Incorporated) | 31 | 3.0% |
| Not-for-profit Organizations | 26 | 2.5% |
| Local Government Employees | 10 | 1.0% |
| State Government Employees | 88 | 8.5% |
| Federal Government Employees | 0 | 0.0% |
| Unpaid Family Workers | 0 | 0.0% |
| Total | 1,037 | 100.0% |
Employment Status by Age in Bawcomville
According to the labor force statistics for Bawcomville, out of the total population over 16 years of age (2,385), 46.5% or 1,109 individuals are in the labor force, with 5.6% or 62 of them unemployed. The age group with the highest labor force participation rate is 20 to 24 years, with 100.0% or 55 individuals in the labor force. Within the labor force, the 25 to 29 years age range has the highest percentage of unemployed individuals, with 28.4% or 29 of them being unemployed.
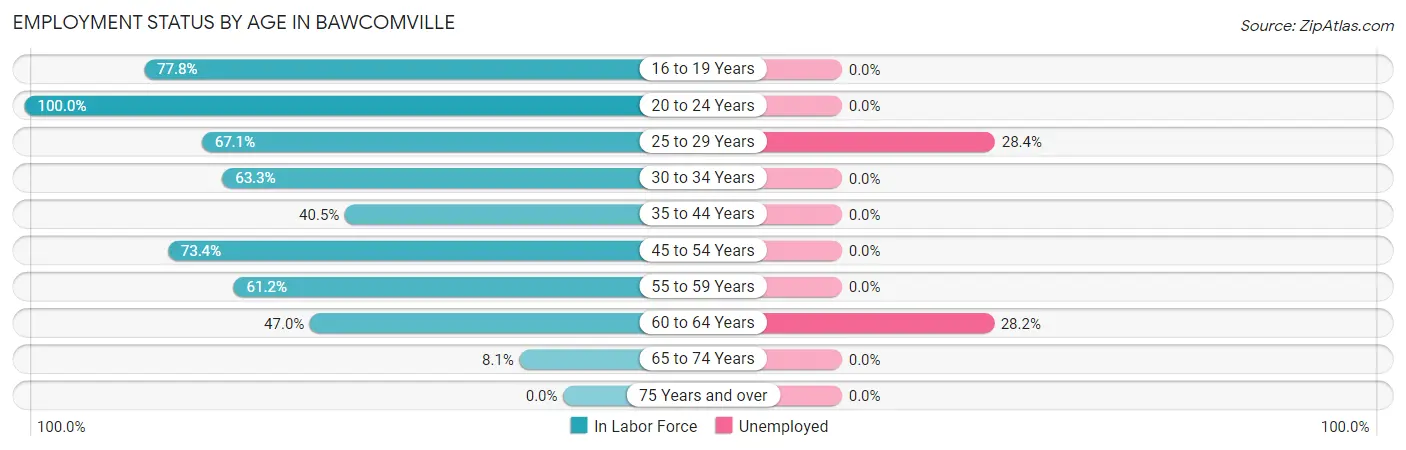
| Age Bracket | In Labor Force | Unemployed |
| 16 to 19 Years | 112 (77.8%) | 0 (0.0%) |
| 20 to 24 Years | 55 (100.0%) | 0 (0.0%) |
| 25 to 29 Years | 102 (67.1%) | 29 (28.4%) |
| 30 to 34 Years | 31 (63.3%) | 0 (0.0%) |
| 35 to 44 Years | 226 (40.5%) | 0 (0.0%) |
| 45 to 54 Years | 279 (73.4%) | 0 (0.0%) |
| 55 to 59 Years | 159 (61.2%) | 0 (0.0%) |
| 60 to 64 Years | 117 (47.0%) | 33 (28.2%) |
| 65 to 74 Years | 27 (8.1%) | 0 (0.0%) |
| 75 Years and over | 0 (0.0%) | 0 (0.0%) |
| Total | 1,109 (46.5%) | 62 (5.6%) |
Employment Status by Educational Attainment in Bawcomville
According to labor force statistics for Bawcomville, 55.5% of individuals (915) out of the total population between 25 and 64 years of age (1,648) are in the labor force, with 6.8% or 62 of them being unemployed. The group with the highest labor force participation rate are those with the educational attainment of bachelor's degree or higher, with 88.5% or 54 individuals in the labor force. Within the labor force, individuals with less than high school education have the highest percentage of unemployment, with 17.0% or 33 of them being unemployed.
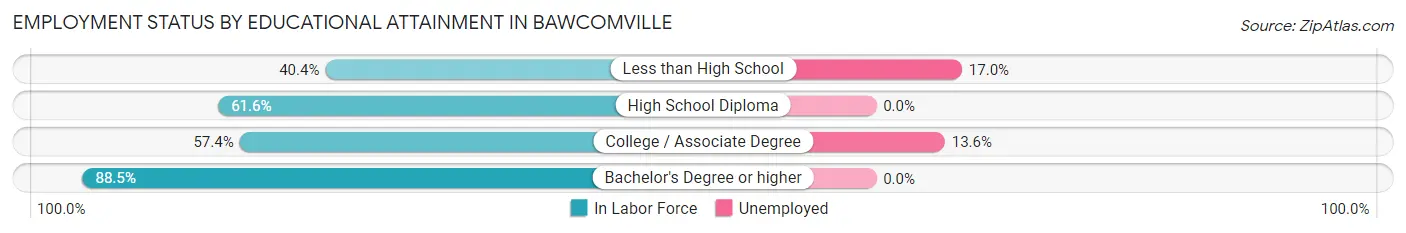
| Educational Attainment | In Labor Force | Unemployed |
| Less than High School | 194 (40.4%) | 82 (17.0%) |
| High School Diploma | 452 (61.6%) | 0 (0.0%) |
| College / Associate Degree | 214 (57.4%) | 51 (13.6%) |
| Bachelor's Degree or higher | 54 (88.5%) | 0 (0.0%) |
| Total | 915 (55.5%) | 112 (6.8%) |
Employment Occupations by Sex in Bawcomville
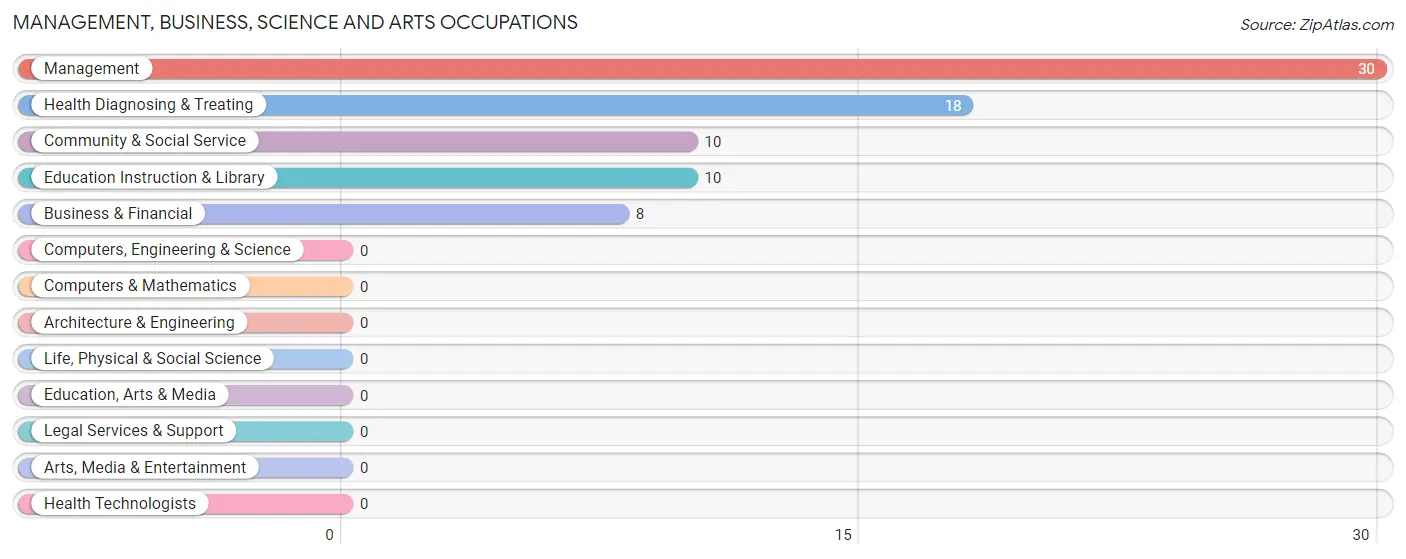
Management, Business, Science and Arts Occupations
The most common Management, Business, Science and Arts occupations in Bawcomville are Management (30 | 2.9%), Health Diagnosing & Treating (18 | 1.7%), Community & Social Service (10 | 1.0%), Education Instruction & Library (10 | 1.0%), and Business & Financial (8 | 0.8%).
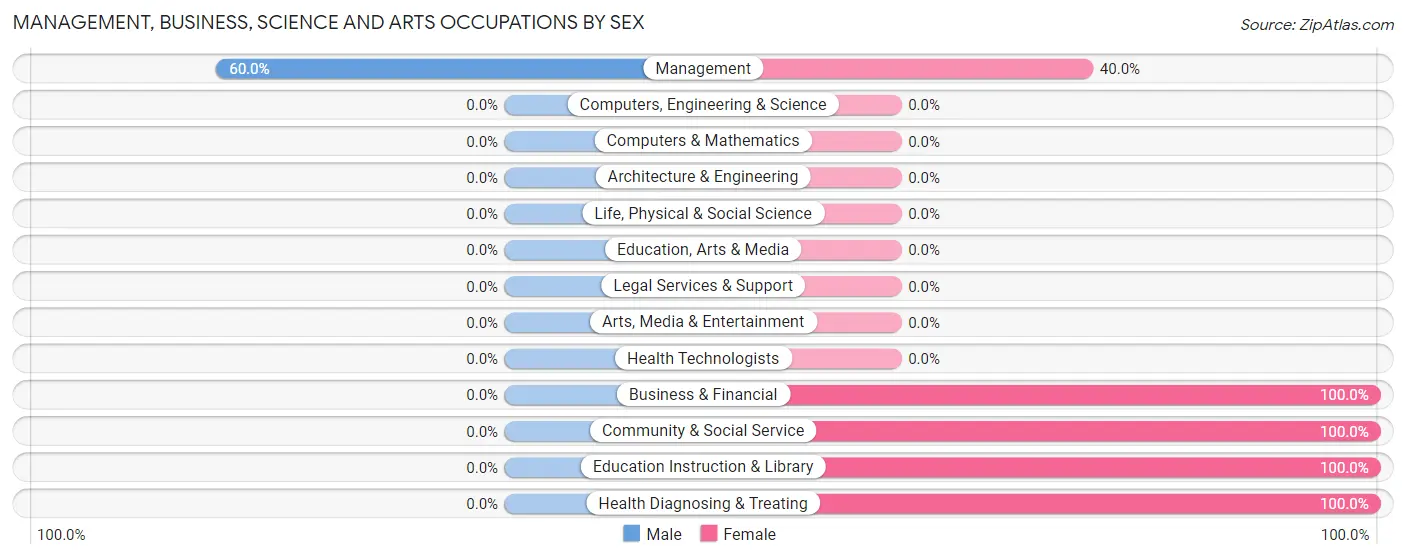
Management, Business, Science and Arts Occupations by Sex
| Occupation | Male | Female |
| Management | 18 (60.0%) | 12 (40.0%) |
| Business & Financial | 0 (0.0%) | 8 (100.0%) |
| Computers, Engineering & Science | 0 (0.0%) | 0 (0.0%) |
| Computers & Mathematics | 0 (0.0%) | 0 (0.0%) |
| Architecture & Engineering | 0 (0.0%) | 0 (0.0%) |
| Life, Physical & Social Science | 0 (0.0%) | 0 (0.0%) |
| Community & Social Service | 0 (0.0%) | 10 (100.0%) |
| Education, Arts & Media | 0 (0.0%) | 0 (0.0%) |
| Legal Services & Support | 0 (0.0%) | 0 (0.0%) |
| Education Instruction & Library | 0 (0.0%) | 10 (100.0%) |
| Arts, Media & Entertainment | 0 (0.0%) | 0 (0.0%) |
| Health Diagnosing & Treating | 0 (0.0%) | 18 (100.0%) |
| Health Technologists | 0 (0.0%) | 0 (0.0%) |
| Total (Category) | 18 (27.3%) | 48 (72.7%) |
| Total (Overall) | 646 (61.8%) | 400 (38.2%) |
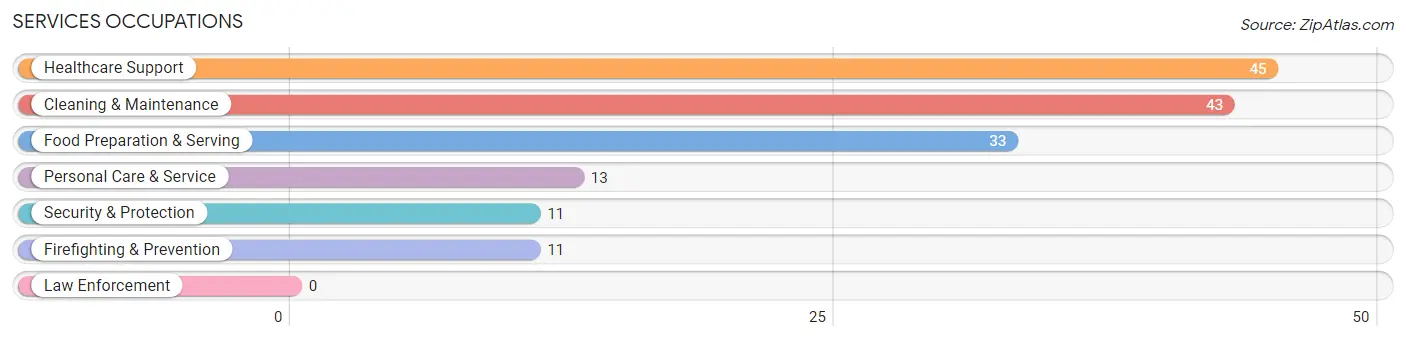
Services Occupations
The most common Services occupations in Bawcomville are Healthcare Support (45 | 4.3%), Cleaning & Maintenance (43 | 4.1%), Food Preparation & Serving (33 | 3.2%), Personal Care & Service (13 | 1.2%), and Security & Protection (11 | 1.1%).
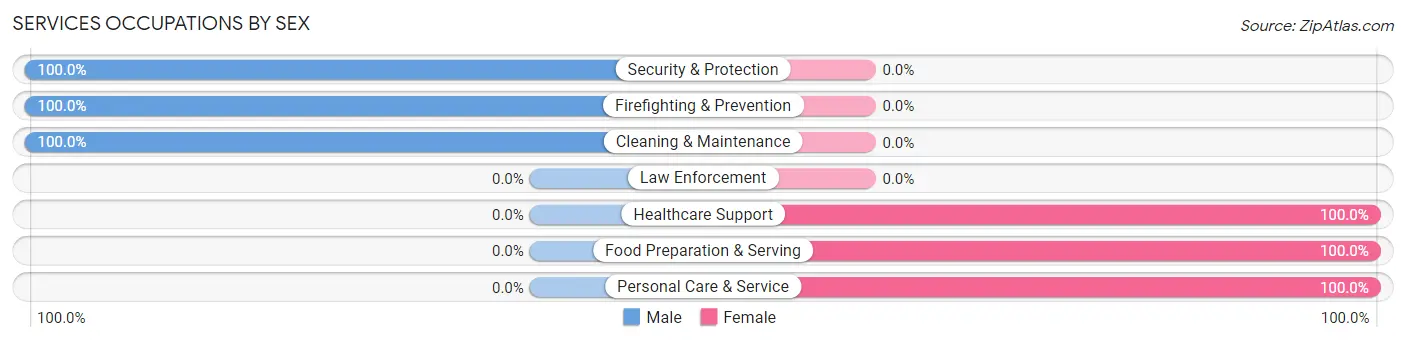
Services Occupations by Sex
Within the Services occupations in Bawcomville, the most male-oriented occupations are Security & Protection (100.0%), Firefighting & Prevention (100.0%), and Cleaning & Maintenance (100.0%), while the most female-oriented occupations are Healthcare Support (100.0%), Food Preparation & Serving (100.0%), and Personal Care & Service (100.0%).
| Occupation | Male | Female |
| Healthcare Support | 0 (0.0%) | 45 (100.0%) |
| Security & Protection | 11 (100.0%) | 0 (0.0%) |
| Firefighting & Prevention | 11 (100.0%) | 0 (0.0%) |
| Law Enforcement | 0 (0.0%) | 0 (0.0%) |
| Food Preparation & Serving | 0 (0.0%) | 33 (100.0%) |
| Cleaning & Maintenance | 43 (100.0%) | 0 (0.0%) |
| Personal Care & Service | 0 (0.0%) | 13 (100.0%) |
| Total (Category) | 54 (37.2%) | 91 (62.8%) |
| Total (Overall) | 646 (61.8%) | 400 (38.2%) |
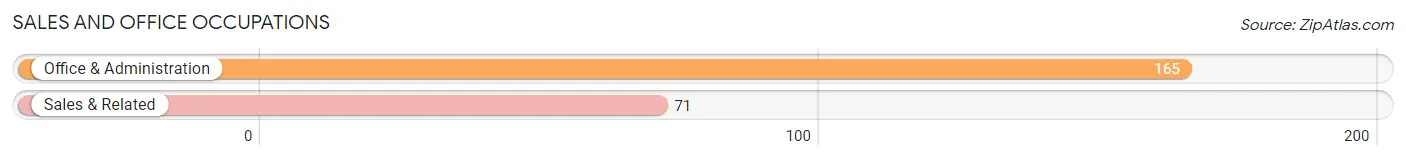
Sales and Office Occupations
The most common Sales and Office occupations in Bawcomville are Office & Administration (165 | 15.8%), and Sales & Related (71 | 6.8%).
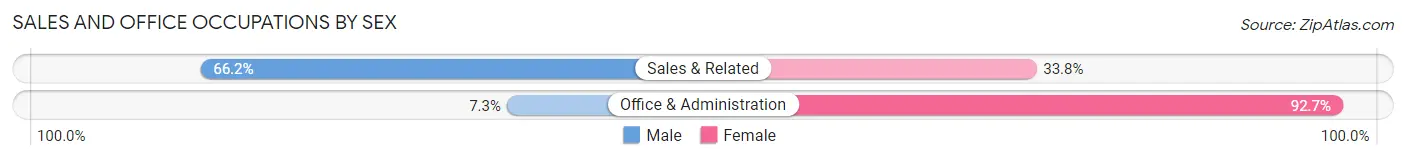
Sales and Office Occupations by Sex
| Occupation | Male | Female |
| Sales & Related | 47 (66.2%) | 24 (33.8%) |
| Office & Administration | 12 (7.3%) | 153 (92.7%) |
| Total (Category) | 59 (25.0%) | 177 (75.0%) |
| Total (Overall) | 646 (61.8%) | 400 (38.2%) |
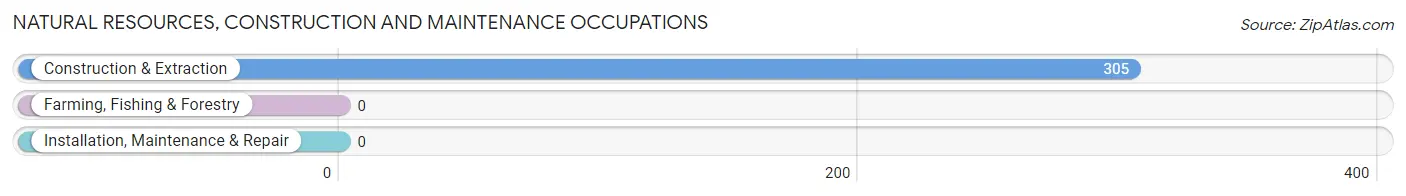
Natural Resources, Construction and Maintenance Occupations
The most common Natural Resources, Construction and Maintenance occupations in Bawcomville are , and Construction & Extraction (305 | 29.2%).
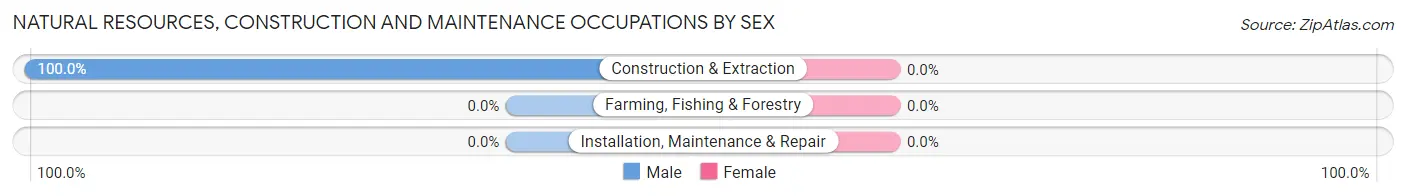
Natural Resources, Construction and Maintenance Occupations by Sex
| Occupation | Male | Female |
| Farming, Fishing & Forestry | 0 (0.0%) | 0 (0.0%) |
| Construction & Extraction | 305 (100.0%) | 0 (0.0%) |
| Installation, Maintenance & Repair | 0 (0.0%) | 0 (0.0%) |
| Total (Category) | 305 (100.0%) | 0 (0.0%) |
| Total (Overall) | 646 (61.8%) | 400 (38.2%) |
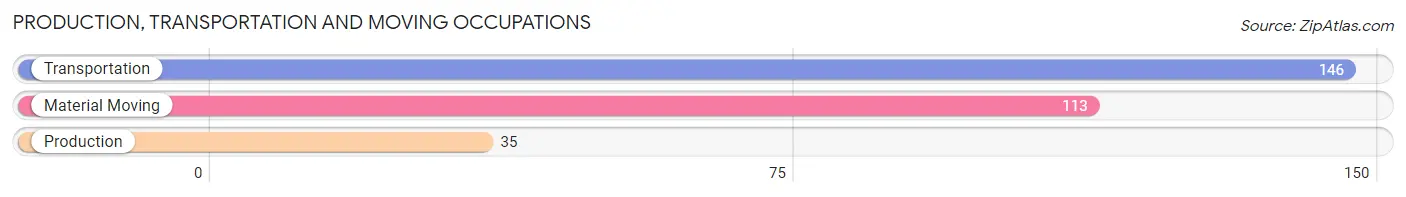
Production, Transportation and Moving Occupations
The most common Production, Transportation and Moving occupations in Bawcomville are Transportation (146 | 14.0%), Material Moving (113 | 10.8%), and Production (35 | 3.4%).
Production, Transportation and Moving Occupations by Sex
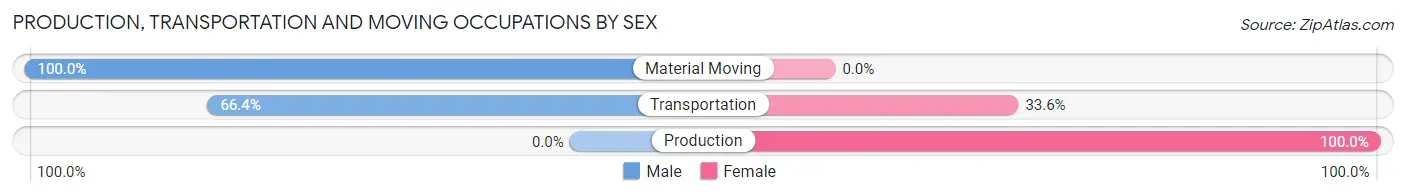
| Occupation | Male | Female |
| Production | 0 (0.0%) | 35 (100.0%) |
| Transportation | 97 (66.4%) | 49 (33.6%) |
| Material Moving | 113 (100.0%) | 0 (0.0%) |
| Total (Category) | 210 (71.4%) | 84 (28.6%) |
| Total (Overall) | 646 (61.8%) | 400 (38.2%) |
Employment Industries by Sex in Bawcomville
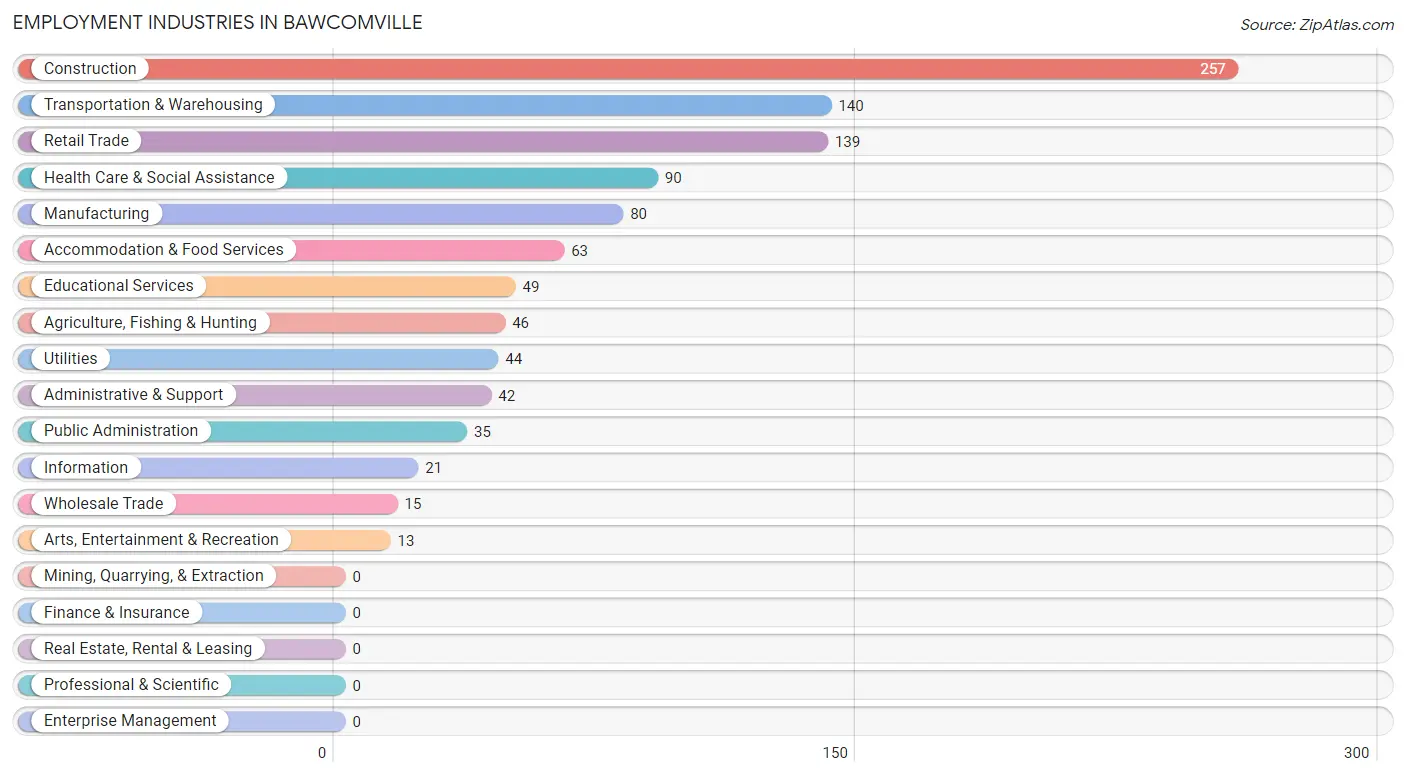
Employment Industries in Bawcomville
The major employment industries in Bawcomville include Construction (257 | 24.6%), Transportation & Warehousing (140 | 13.4%), Retail Trade (139 | 13.3%), Health Care & Social Assistance (90 | 8.6%), and Manufacturing (80 | 7.6%).
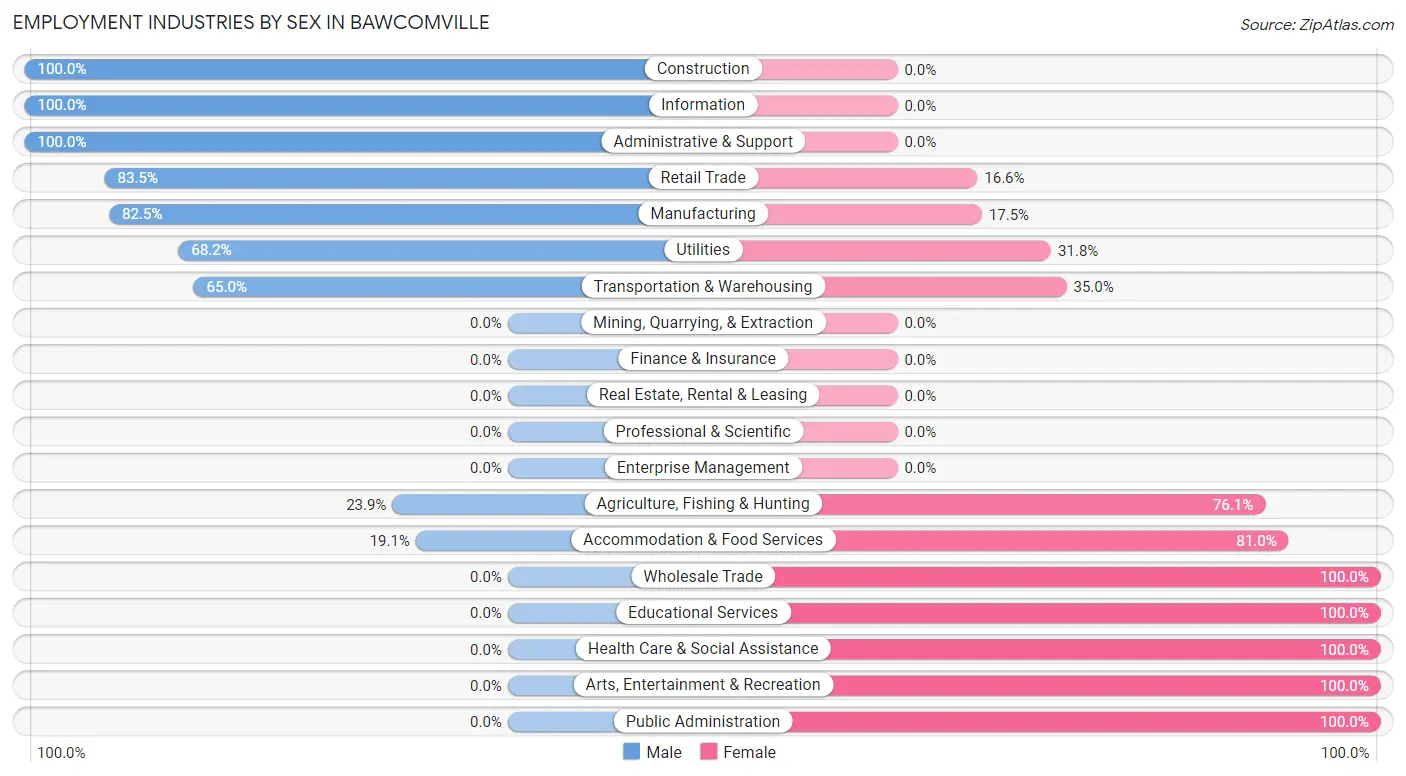
Employment Industries by Sex in Bawcomville
The Bawcomville industries that see more men than women are Construction (100.0%), Information (100.0%), and Administrative & Support (100.0%), whereas the industries that tend to have a higher number of women are Wholesale Trade (100.0%), Educational Services (100.0%), and Health Care & Social Assistance (100.0%).
| Industry | Male | Female |
| Agriculture, Fishing & Hunting | 11 (23.9%) | 35 (76.1%) |
| Mining, Quarrying, & Extraction | 0 (0.0%) | 0 (0.0%) |
| Construction | 257 (100.0%) | 0 (0.0%) |
| Manufacturing | 66 (82.5%) | 14 (17.5%) |
| Wholesale Trade | 0 (0.0%) | 15 (100.0%) |
| Retail Trade | 116 (83.5%) | 23 (16.6%) |
| Transportation & Warehousing | 91 (65.0%) | 49 (35.0%) |
| Utilities | 30 (68.2%) | 14 (31.8%) |
| Information | 21 (100.0%) | 0 (0.0%) |
| Finance & Insurance | 0 (0.0%) | 0 (0.0%) |
| Real Estate, Rental & Leasing | 0 (0.0%) | 0 (0.0%) |
| Professional & Scientific | 0 (0.0%) | 0 (0.0%) |
| Enterprise Management | 0 (0.0%) | 0 (0.0%) |
| Administrative & Support | 42 (100.0%) | 0 (0.0%) |
| Educational Services | 0 (0.0%) | 49 (100.0%) |
| Health Care & Social Assistance | 0 (0.0%) | 90 (100.0%) |
| Arts, Entertainment & Recreation | 0 (0.0%) | 13 (100.0%) |
| Accommodation & Food Services | 12 (19.1%) | 51 (80.9%) |
| Public Administration | 0 (0.0%) | 35 (100.0%) |
| Total | 646 (61.8%) | 400 (38.2%) |
Education in Bawcomville
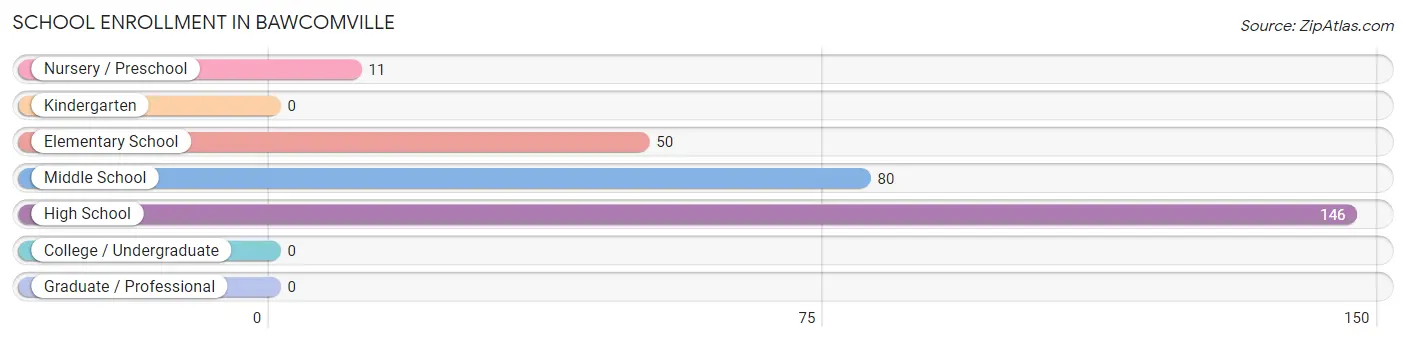
School Enrollment in Bawcomville
The most common levels of schooling among the 287 students in Bawcomville are high school (146 | 50.9%), middle school (80 | 27.9%), and elementary school (50 | 17.4%).
| School Level | # Students | % Students |
| Nursery / Preschool | 11 | 3.8% |
| Kindergarten | 0 | 0.0% |
| Elementary School | 50 | 17.4% |
| Middle School | 80 | 27.9% |
| High School | 146 | 50.9% |
| College / Undergraduate | 0 | 0.0% |
| Graduate / Professional | 0 | 0.0% |
| Total | 287 | 100.0% |
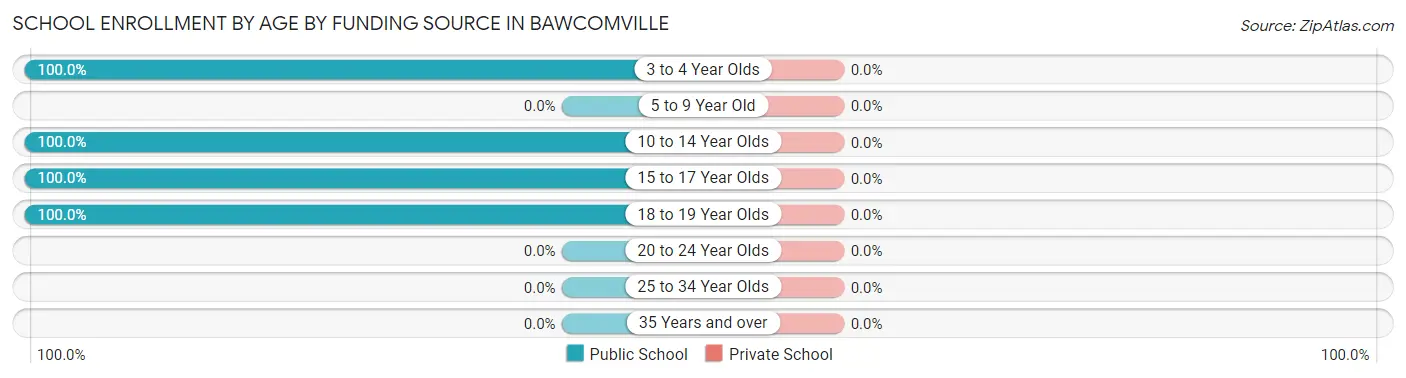
School Enrollment by Age by Funding Source in Bawcomville
| Age Bracket | Public School | Private School |
| 3 to 4 Year Olds | 11 (100.0%) | 0 (0.0%) |
| 5 to 9 Year Old | 0 (0.0%) | 0 (0.0%) |
| 10 to 14 Year Olds | 130 (100.0%) | 0 (0.0%) |
| 15 to 17 Year Olds | 101 (100.0%) | 0 (0.0%) |
| 18 to 19 Year Olds | 45 (100.0%) | 0 (0.0%) |
| 20 to 24 Year Olds | 0 (0.0%) | 0 (0.0%) |
| 25 to 34 Year Olds | 0 (0.0%) | 0 (0.0%) |
| 35 Years and over | 0 (0.0%) | 0 (0.0%) |
| Total | 287 (100.0%) | 0 (0.0%) |
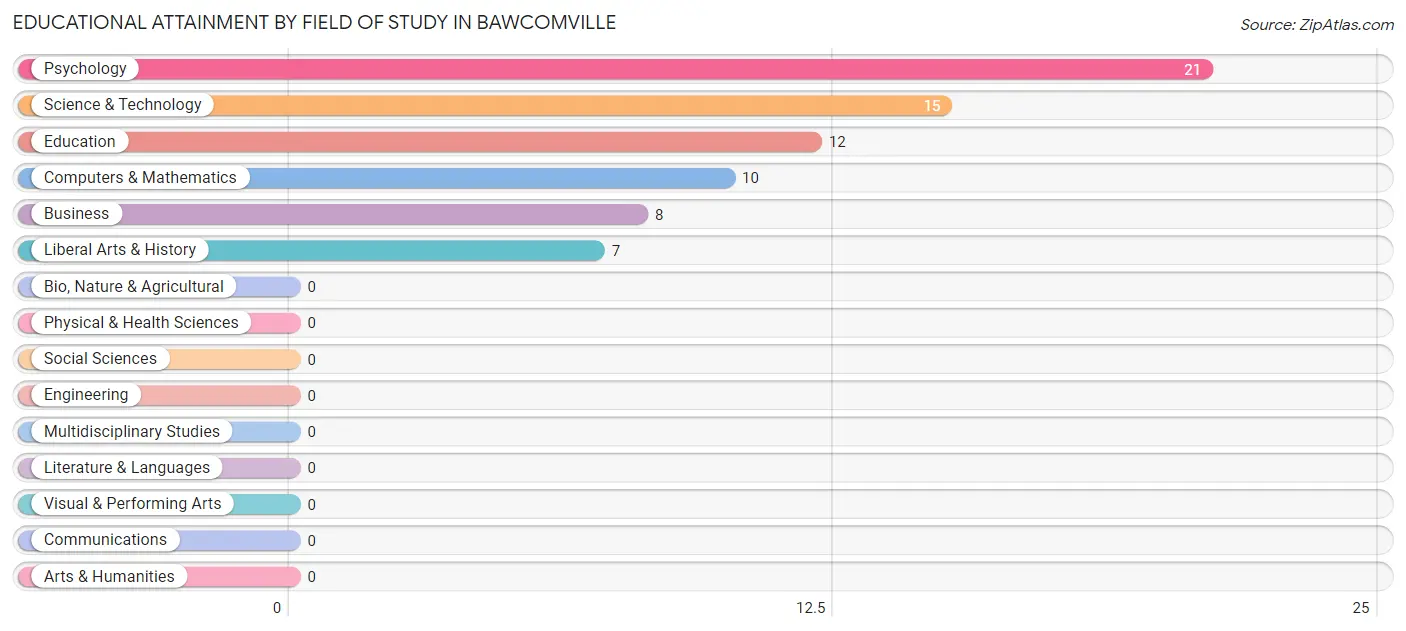
Educational Attainment by Field of Study in Bawcomville
Psychology (21 | 28.8%), science & technology (15 | 20.5%), education (12 | 16.4%), computers & mathematics (10 | 13.7%), and business (8 | 11.0%) are the most common fields of study among 73 individuals in Bawcomville who have obtained a bachelor's degree or higher.
| Field of Study | # Graduates | % Graduates |
| Computers & Mathematics | 10 | 13.7% |
| Bio, Nature & Agricultural | 0 | 0.0% |
| Physical & Health Sciences | 0 | 0.0% |
| Psychology | 21 | 28.8% |
| Social Sciences | 0 | 0.0% |
| Engineering | 0 | 0.0% |
| Multidisciplinary Studies | 0 | 0.0% |
| Science & Technology | 15 | 20.5% |
| Business | 8 | 11.0% |
| Education | 12 | 16.4% |
| Literature & Languages | 0 | 0.0% |
| Liberal Arts & History | 7 | 9.6% |
| Visual & Performing Arts | 0 | 0.0% |
| Communications | 0 | 0.0% |
| Arts & Humanities | 0 | 0.0% |
| Total | 73 | 100.0% |
Transportation & Commute in Bawcomville
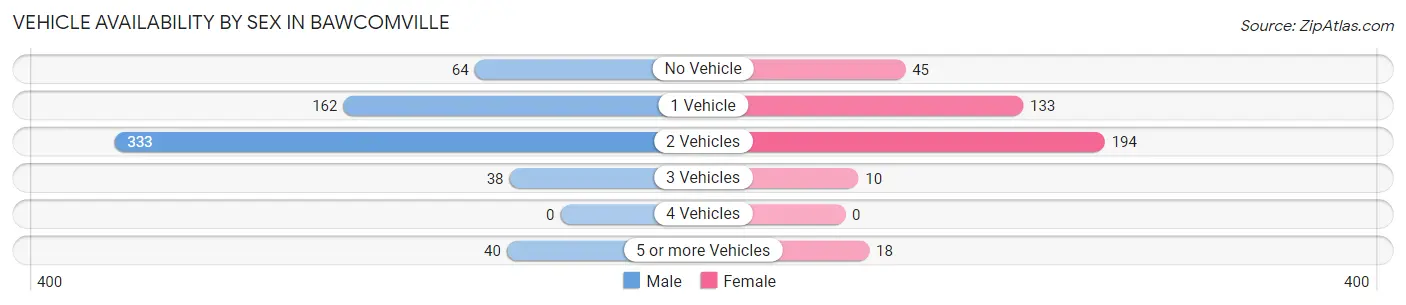
Vehicle Availability by Sex in Bawcomville
The most prevalent vehicle ownership categories in Bawcomville are males with 2 vehicles (333, accounting for 52.3%) and females with 2 vehicles (194, making up 83.3%).
| Vehicles Available | Male | Female |
| No Vehicle | 64 (10.1%) | 45 (11.3%) |
| 1 Vehicle | 162 (25.4%) | 133 (33.3%) |
| 2 Vehicles | 333 (52.3%) | 194 (48.5%) |
| 3 Vehicles | 38 (6.0%) | 10 (2.5%) |
| 4 Vehicles | 0 (0.0%) | 0 (0.0%) |
| 5 or more Vehicles | 40 (6.3%) | 18 (4.5%) |
| Total | 637 (100.0%) | 400 (100.0%) |
Commute Time in Bawcomville
The most frequently occuring commute durations in Bawcomville are 10 to 14 minutes (222 commuters, 21.8%), 20 to 24 minutes (217 commuters, 21.3%), and 15 to 19 minutes (194 commuters, 19.0%).
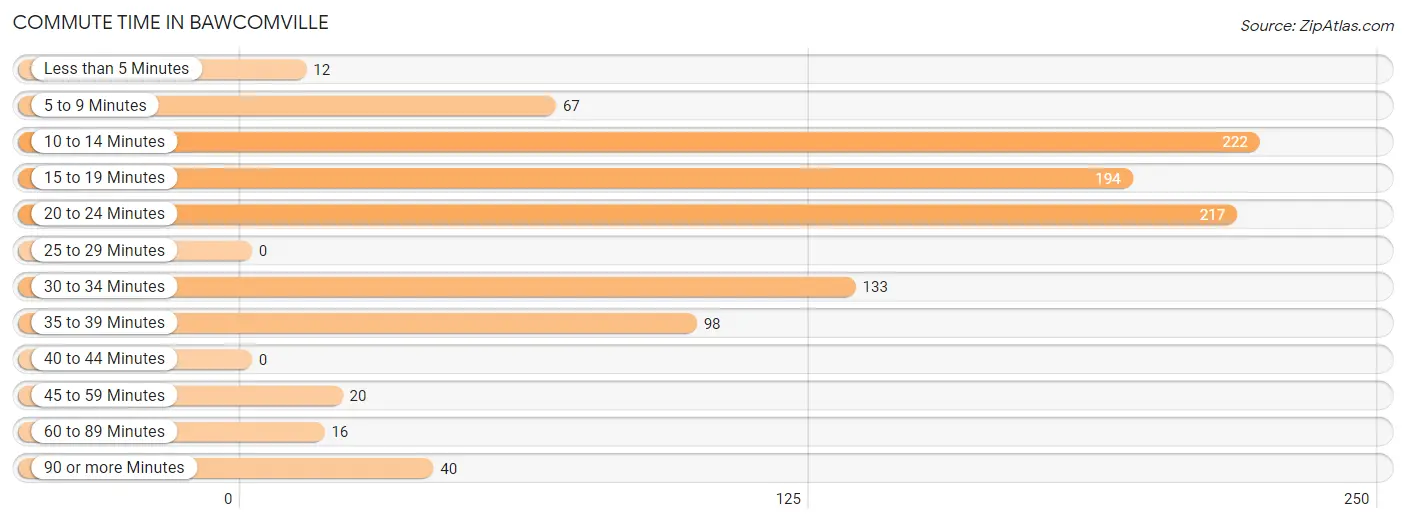
| Commute Time | # Commuters | % Commuters |
| Less than 5 Minutes | 12 | 1.2% |
| 5 to 9 Minutes | 67 | 6.6% |
| 10 to 14 Minutes | 222 | 21.8% |
| 15 to 19 Minutes | 194 | 19.0% |
| 20 to 24 Minutes | 217 | 21.3% |
| 25 to 29 Minutes | 0 | 0.0% |
| 30 to 34 Minutes | 133 | 13.1% |
| 35 to 39 Minutes | 98 | 9.6% |
| 40 to 44 Minutes | 0 | 0.0% |
| 45 to 59 Minutes | 20 | 2.0% |
| 60 to 89 Minutes | 16 | 1.6% |
| 90 or more Minutes | 40 | 3.9% |
Commute Time by Sex in Bawcomville
The most common commute times in Bawcomville are 20 to 24 minutes (137 commuters, 21.5%) for males and 15 to 19 minutes (126 commuters, 33.0%) for females.
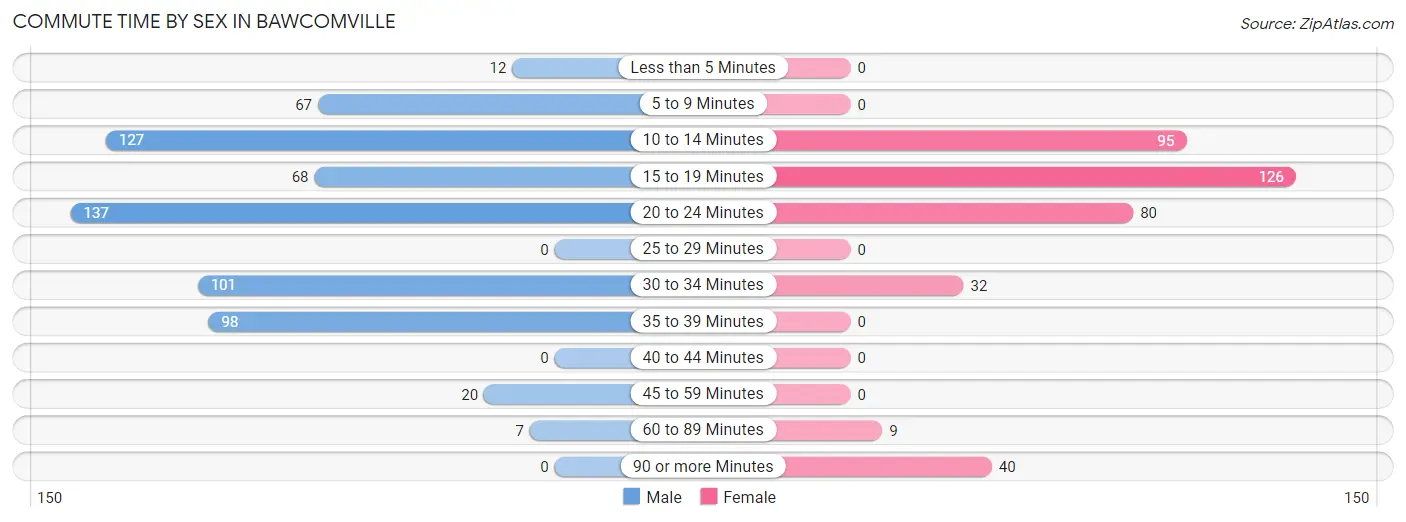
| Commute Time | Male | Female |
| Less than 5 Minutes | 12 (1.9%) | 0 (0.0%) |
| 5 to 9 Minutes | 67 (10.5%) | 0 (0.0%) |
| 10 to 14 Minutes | 127 (19.9%) | 95 (24.9%) |
| 15 to 19 Minutes | 68 (10.7%) | 126 (33.0%) |
| 20 to 24 Minutes | 137 (21.5%) | 80 (20.9%) |
| 25 to 29 Minutes | 0 (0.0%) | 0 (0.0%) |
| 30 to 34 Minutes | 101 (15.9%) | 32 (8.4%) |
| 35 to 39 Minutes | 98 (15.4%) | 0 (0.0%) |
| 40 to 44 Minutes | 0 (0.0%) | 0 (0.0%) |
| 45 to 59 Minutes | 20 (3.1%) | 0 (0.0%) |
| 60 to 89 Minutes | 7 (1.1%) | 9 (2.4%) |
| 90 or more Minutes | 0 (0.0%) | 40 (10.5%) |
Time of Departure to Work by Sex in Bawcomville
The most frequent times of departure to work in Bawcomville are 6:00 AM to 6:29 AM (213, 33.4%) for males and 7:30 AM to 7:59 AM (112, 29.3%) for females.
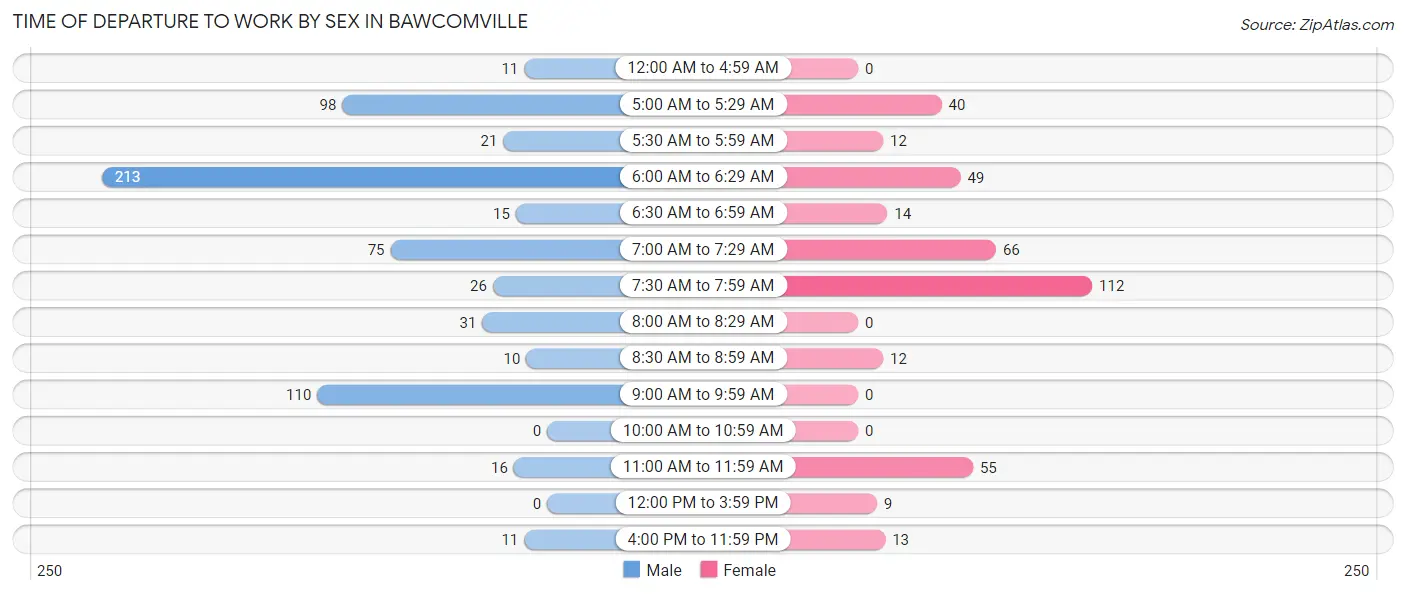
| Time of Departure | Male | Female |
| 12:00 AM to 4:59 AM | 11 (1.7%) | 0 (0.0%) |
| 5:00 AM to 5:29 AM | 98 (15.4%) | 40 (10.5%) |
| 5:30 AM to 5:59 AM | 21 (3.3%) | 12 (3.1%) |
| 6:00 AM to 6:29 AM | 213 (33.4%) | 49 (12.8%) |
| 6:30 AM to 6:59 AM | 15 (2.4%) | 14 (3.7%) |
| 7:00 AM to 7:29 AM | 75 (11.8%) | 66 (17.3%) |
| 7:30 AM to 7:59 AM | 26 (4.1%) | 112 (29.3%) |
| 8:00 AM to 8:29 AM | 31 (4.9%) | 0 (0.0%) |
| 8:30 AM to 8:59 AM | 10 (1.6%) | 12 (3.1%) |
| 9:00 AM to 9:59 AM | 110 (17.3%) | 0 (0.0%) |
| 10:00 AM to 10:59 AM | 0 (0.0%) | 0 (0.0%) |
| 11:00 AM to 11:59 AM | 16 (2.5%) | 55 (14.4%) |
| 12:00 PM to 3:59 PM | 0 (0.0%) | 9 (2.4%) |
| 4:00 PM to 11:59 PM | 11 (1.7%) | 13 (3.4%) |
| Total | 637 (100.0%) | 382 (100.0%) |
Housing Occupancy in Bawcomville
Occupancy by Ownership in Bawcomville
Of the total 1,188 dwellings in Bawcomville, owner-occupied units account for 696 (58.6%), while renter-occupied units make up 492 (41.4%).
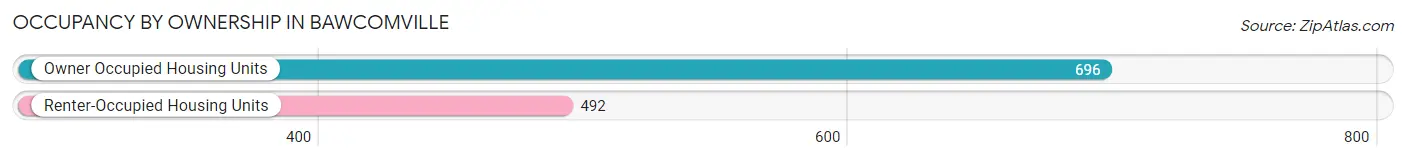
| Occupancy | # Housing Units | % Housing Units |
| Owner Occupied Housing Units | 696 | 58.6% |
| Renter-Occupied Housing Units | 492 | 41.4% |
| Total Occupied Housing Units | 1,188 | 100.0% |
Occupancy by Household Size in Bawcomville
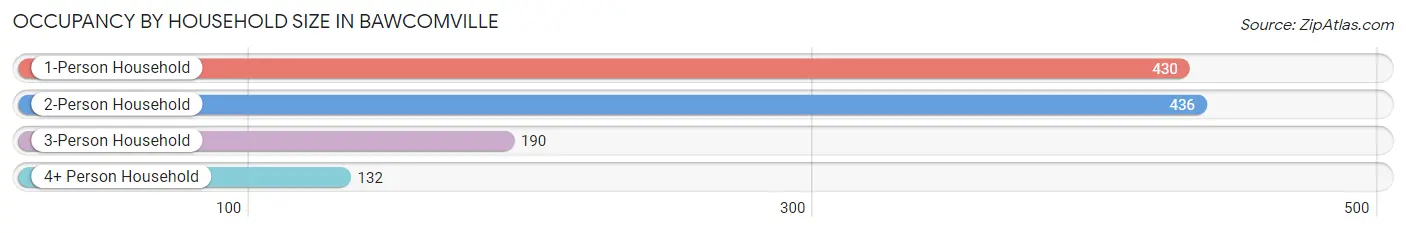
| Household Size | # Housing Units | % Housing Units |
| 1-Person Household | 430 | 36.2% |
| 2-Person Household | 436 | 36.7% |
| 3-Person Household | 190 | 16.0% |
| 4+ Person Household | 132 | 11.1% |
| Total Housing Units | 1,188 | 100.0% |
Occupancy by Ownership by Household Size in Bawcomville
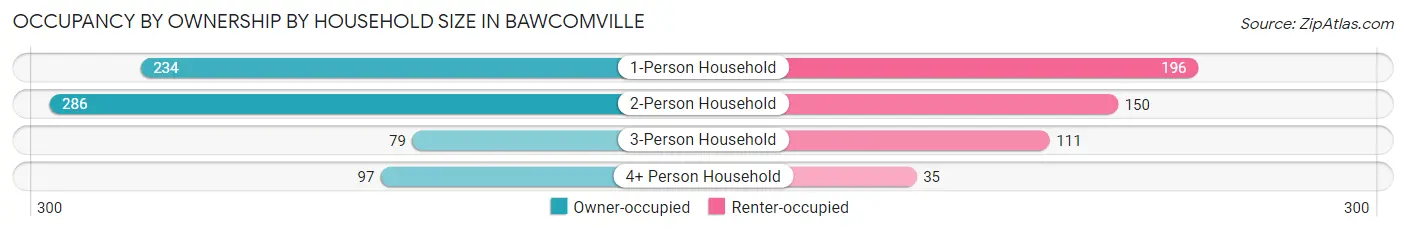
| Household Size | Owner-occupied | Renter-occupied |
| 1-Person Household | 234 (54.4%) | 196 (45.6%) |
| 2-Person Household | 286 (65.6%) | 150 (34.4%) |
| 3-Person Household | 79 (41.6%) | 111 (58.4%) |
| 4+ Person Household | 97 (73.5%) | 35 (26.5%) |
| Total Housing Units | 696 (58.6%) | 492 (41.4%) |
Occupancy by Educational Attainment in Bawcomville
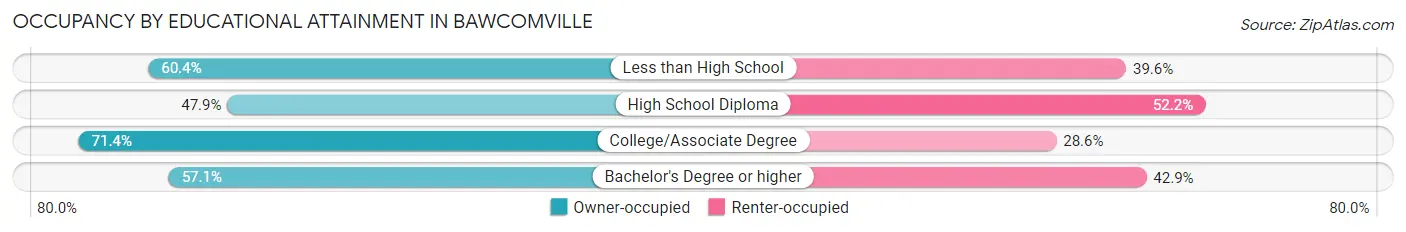
| Household Size | Owner-occupied | Renter-occupied |
| Less than High School | 297 (60.4%) | 195 (39.6%) |
| High School Diploma | 189 (47.8%) | 206 (52.1%) |
| College/Associate Degree | 190 (71.4%) | 76 (28.6%) |
| Bachelor's Degree or higher | 20 (57.1%) | 15 (42.9%) |
Occupancy by Age of Householder in Bawcomville
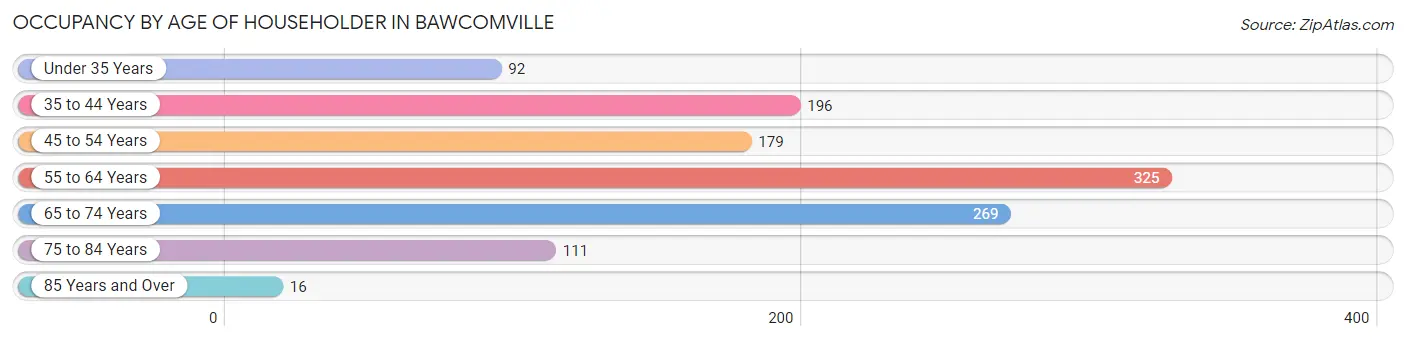
| Age Bracket | # Households | % Households |
| Under 35 Years | 92 | 7.7% |
| 35 to 44 Years | 196 | 16.5% |
| 45 to 54 Years | 179 | 15.1% |
| 55 to 64 Years | 325 | 27.4% |
| 65 to 74 Years | 269 | 22.6% |
| 75 to 84 Years | 111 | 9.3% |
| 85 Years and Over | 16 | 1.3% |
| Total | 1,188 | 100.0% |
Housing Finances in Bawcomville
Median Income by Occupancy in Bawcomville
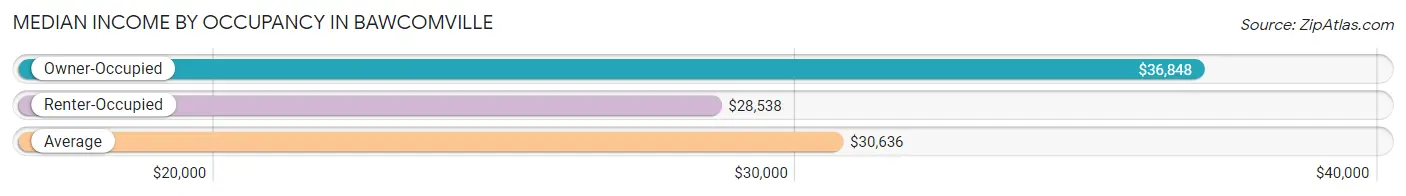
| Occupancy Type | # Households | Median Income |
| Owner-Occupied | 696 (58.6%) | $36,848 |
| Renter-Occupied | 492 (41.4%) | $28,538 |
| Average | 1,188 (100.0%) | $30,636 |
Occupancy by Householder Income Bracket in Bawcomville
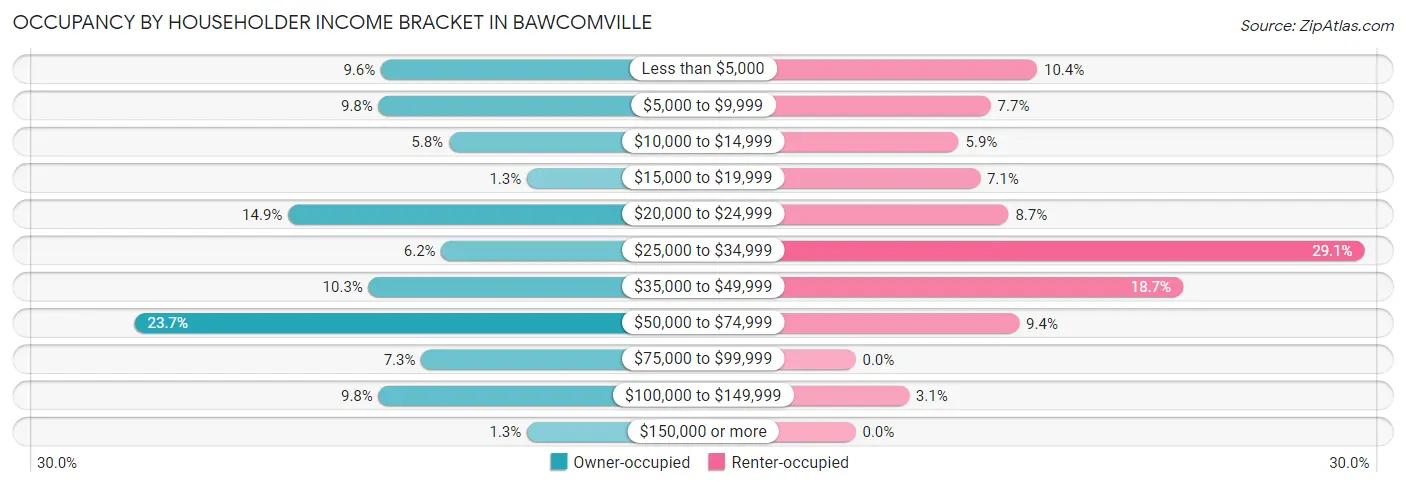
| Income Bracket | Owner-occupied | Renter-occupied |
| Less than $5,000 | 67 (9.6%) | 51 (10.4%) |
| $5,000 to $9,999 | 68 (9.8%) | 38 (7.7%) |
| $10,000 to $14,999 | 40 (5.8%) | 29 (5.9%) |
| $15,000 to $19,999 | 9 (1.3%) | 35 (7.1%) |
| $20,000 to $24,999 | 104 (14.9%) | 43 (8.7%) |
| $25,000 to $34,999 | 43 (6.2%) | 143 (29.1%) |
| $35,000 to $49,999 | 72 (10.3%) | 92 (18.7%) |
| $50,000 to $74,999 | 165 (23.7%) | 46 (9.3%) |
| $75,000 to $99,999 | 51 (7.3%) | 0 (0.0%) |
| $100,000 to $149,999 | 68 (9.8%) | 15 (3.0%) |
| $150,000 or more | 9 (1.3%) | 0 (0.0%) |
| Total | 696 (100.0%) | 492 (100.0%) |
Monthly Housing Cost Tiers in Bawcomville
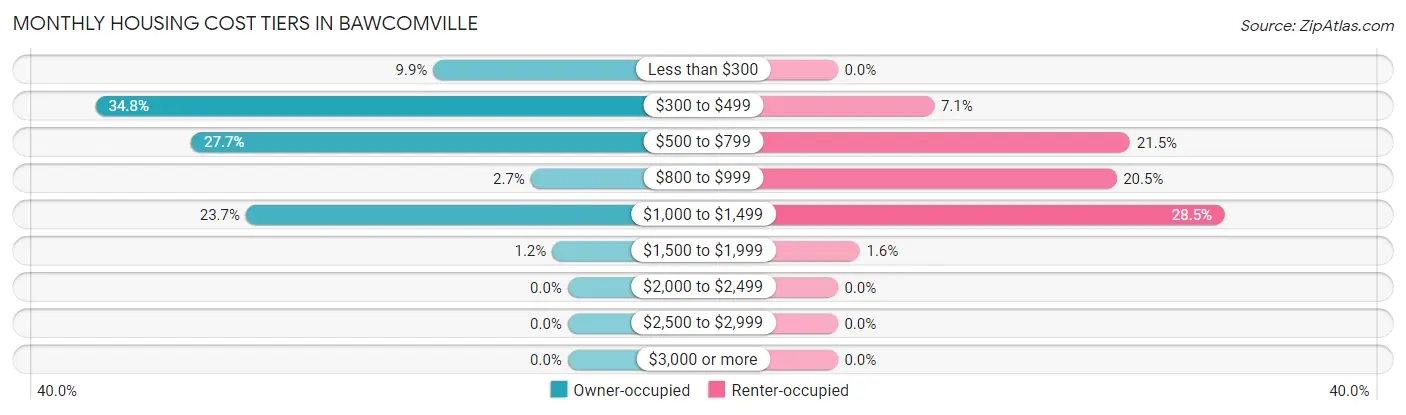
| Monthly Cost | Owner-occupied | Renter-occupied |
| Less than $300 | 69 (9.9%) | 0 (0.0%) |
| $300 to $499 | 242 (34.8%) | 35 (7.1%) |
| $500 to $799 | 193 (27.7%) | 106 (21.5%) |
| $800 to $999 | 19 (2.7%) | 101 (20.5%) |
| $1,000 to $1,499 | 165 (23.7%) | 140 (28.5%) |
| $1,500 to $1,999 | 8 (1.1%) | 8 (1.6%) |
| $2,000 to $2,499 | 0 (0.0%) | 0 (0.0%) |
| $2,500 to $2,999 | 0 (0.0%) | 0 (0.0%) |
| $3,000 or more | 0 (0.0%) | 0 (0.0%) |
| Total | 696 (100.0%) | 492 (100.0%) |
Physical Housing Characteristics in Bawcomville
Housing Structures in Bawcomville
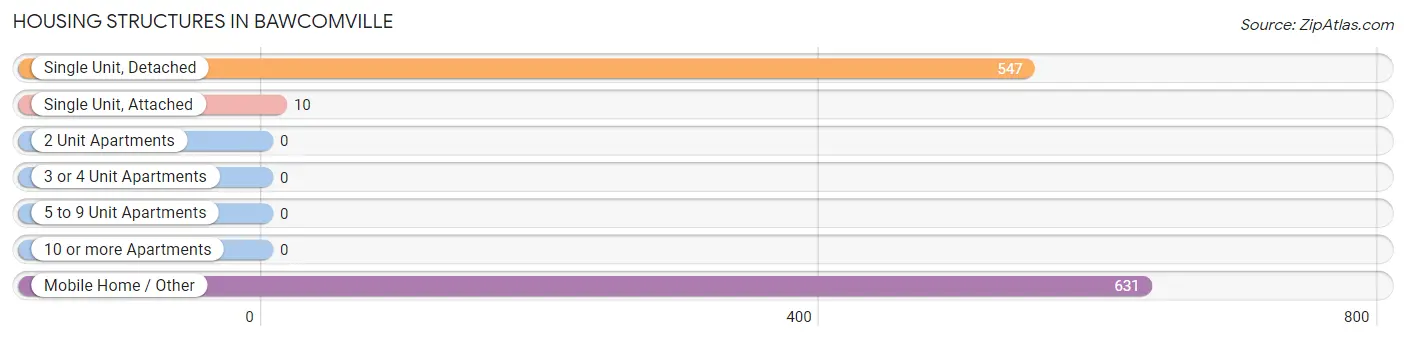
| Structure Type | # Housing Units | % Housing Units |
| Single Unit, Detached | 547 | 46.0% |
| Single Unit, Attached | 10 | 0.8% |
| 2 Unit Apartments | 0 | 0.0% |
| 3 or 4 Unit Apartments | 0 | 0.0% |
| 5 to 9 Unit Apartments | 0 | 0.0% |
| 10 or more Apartments | 0 | 0.0% |
| Mobile Home / Other | 631 | 53.1% |
| Total | 1,188 | 100.0% |
Housing Structures by Occupancy in Bawcomville
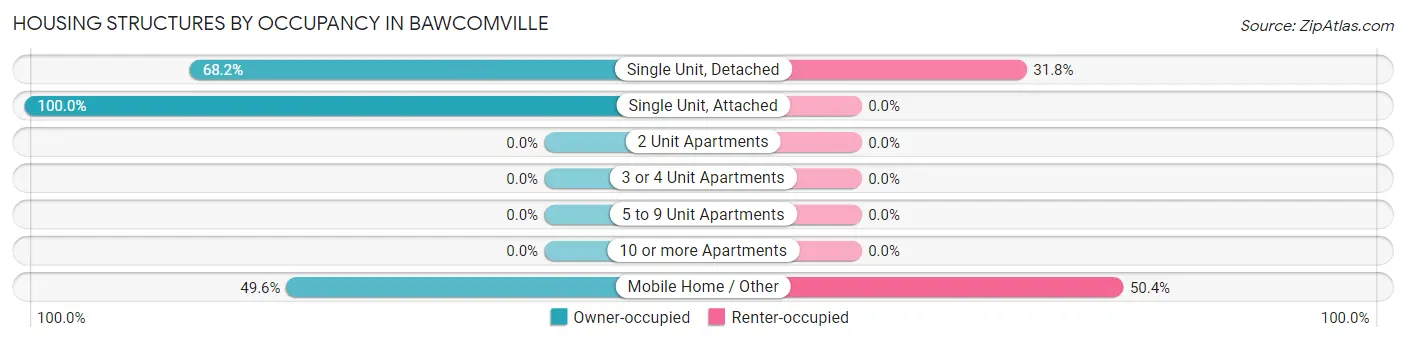
| Structure Type | Owner-occupied | Renter-occupied |
| Single Unit, Detached | 373 (68.2%) | 174 (31.8%) |
| Single Unit, Attached | 10 (100.0%) | 0 (0.0%) |
| 2 Unit Apartments | 0 (0.0%) | 0 (0.0%) |
| 3 or 4 Unit Apartments | 0 (0.0%) | 0 (0.0%) |
| 5 to 9 Unit Apartments | 0 (0.0%) | 0 (0.0%) |
| 10 or more Apartments | 0 (0.0%) | 0 (0.0%) |
| Mobile Home / Other | 313 (49.6%) | 318 (50.4%) |
| Total | 696 (58.6%) | 492 (41.4%) |
Housing Structures by Number of Rooms in Bawcomville
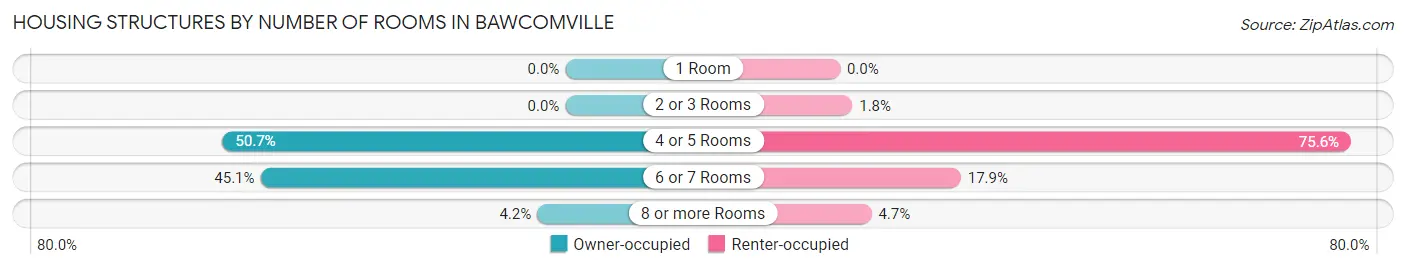
| Number of Rooms | Owner-occupied | Renter-occupied |
| 1 Room | 0 (0.0%) | 0 (0.0%) |
| 2 or 3 Rooms | 0 (0.0%) | 9 (1.8%) |
| 4 or 5 Rooms | 353 (50.7%) | 372 (75.6%) |
| 6 or 7 Rooms | 314 (45.1%) | 88 (17.9%) |
| 8 or more Rooms | 29 (4.2%) | 23 (4.7%) |
| Total | 696 (100.0%) | 492 (100.0%) |
Housing Structure by Heating Type in Bawcomville
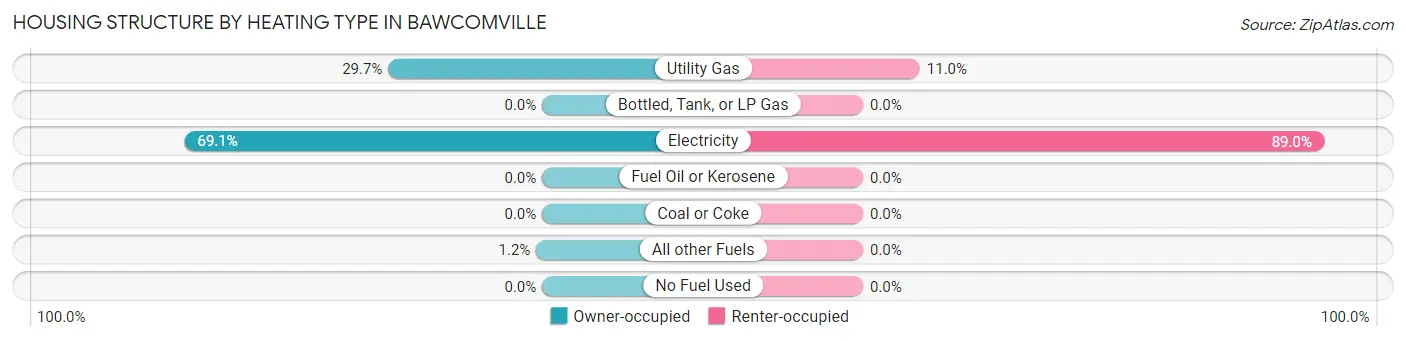
| Heating Type | Owner-occupied | Renter-occupied |
| Utility Gas | 207 (29.7%) | 54 (11.0%) |
| Bottled, Tank, or LP Gas | 0 (0.0%) | 0 (0.0%) |
| Electricity | 481 (69.1%) | 438 (89.0%) |
| Fuel Oil or Kerosene | 0 (0.0%) | 0 (0.0%) |
| Coal or Coke | 0 (0.0%) | 0 (0.0%) |
| All other Fuels | 8 (1.1%) | 0 (0.0%) |
| No Fuel Used | 0 (0.0%) | 0 (0.0%) |
| Total | 696 (100.0%) | 492 (100.0%) |
Household Vehicle Usage in Bawcomville
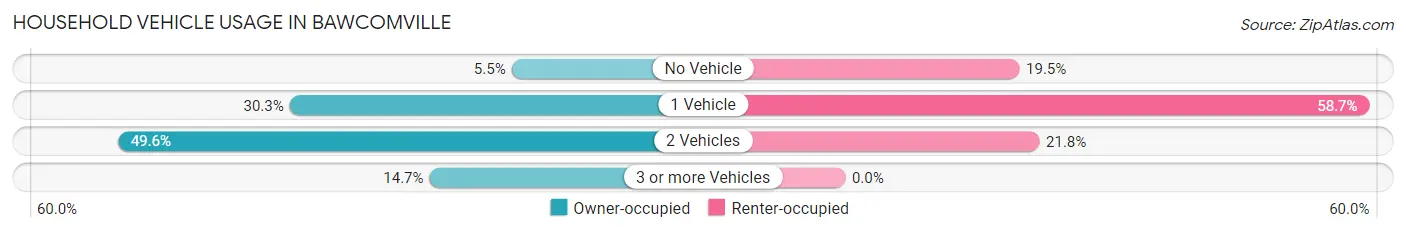
| Vehicles per Household | Owner-occupied | Renter-occupied |
| No Vehicle | 38 (5.5%) | 96 (19.5%) |
| 1 Vehicle | 211 (30.3%) | 289 (58.7%) |
| 2 Vehicles | 345 (49.6%) | 107 (21.7%) |
| 3 or more Vehicles | 102 (14.7%) | 0 (0.0%) |
| Total | 696 (100.0%) | 492 (100.0%) |
Real Estate & Mortgages in Bawcomville
Real Estate and Mortgage Overview in Bawcomville
| Characteristic | Without Mortgage | With Mortgage |
| Housing Units | 524 | 172 |
| Median Property Value | $53,300 | $95,400 |
| Median Household Income | $22,091 | $9 |
| Monthly Housing Costs | $454 | $0 |
| Real Estate Taxes | $329 | $160 |
Property Value by Mortgage Status in Bawcomville
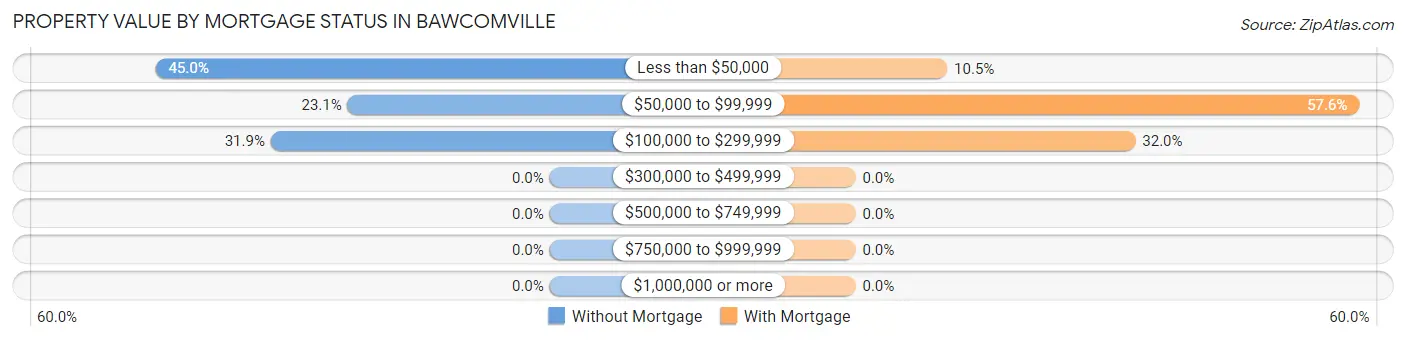
| Property Value | Without Mortgage | With Mortgage |
| Less than $50,000 | 236 (45.0%) | 18 (10.5%) |
| $50,000 to $99,999 | 121 (23.1%) | 99 (57.6%) |
| $100,000 to $299,999 | 167 (31.9%) | 55 (32.0%) |
| $300,000 to $499,999 | 0 (0.0%) | 0 (0.0%) |
| $500,000 to $749,999 | 0 (0.0%) | 0 (0.0%) |
| $750,000 to $999,999 | 0 (0.0%) | 0 (0.0%) |
| $1,000,000 or more | 0 (0.0%) | 0 (0.0%) |
| Total | 524 (100.0%) | 172 (100.0%) |
Household Income by Mortgage Status in Bawcomville
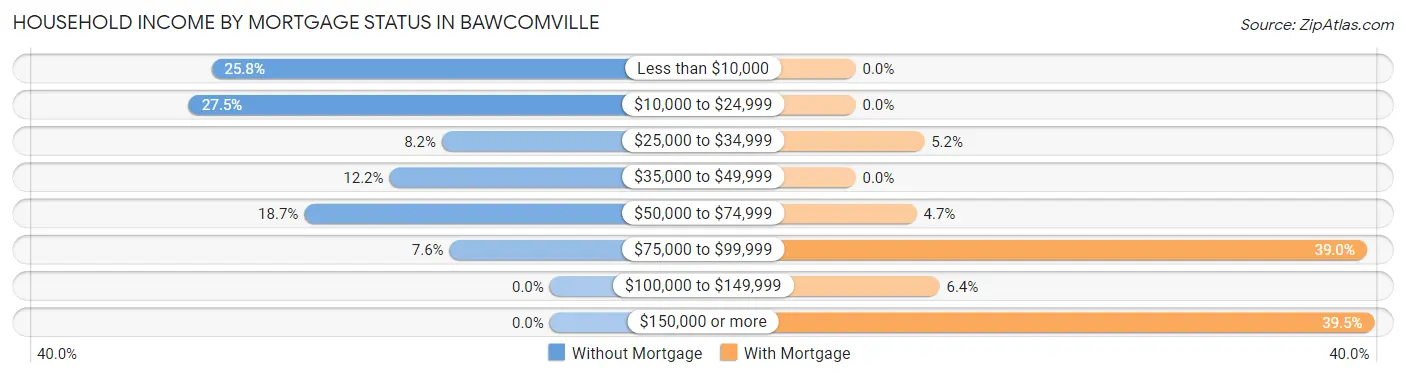
| Household Income | Without Mortgage | With Mortgage |
| Less than $10,000 | 135 (25.8%) | 0 (0.0%) |
| $10,000 to $24,999 | 144 (27.5%) | 0 (0.0%) |
| $25,000 to $34,999 | 43 (8.2%) | 9 (5.2%) |
| $35,000 to $49,999 | 64 (12.2%) | 0 (0.0%) |
| $50,000 to $74,999 | 98 (18.7%) | 8 (4.6%) |
| $75,000 to $99,999 | 40 (7.6%) | 67 (39.0%) |
| $100,000 to $149,999 | 0 (0.0%) | 11 (6.4%) |
| $150,000 or more | 0 (0.0%) | 68 (39.5%) |
| Total | 524 (100.0%) | 172 (100.0%) |
Property Value to Household Income Ratio in Bawcomville
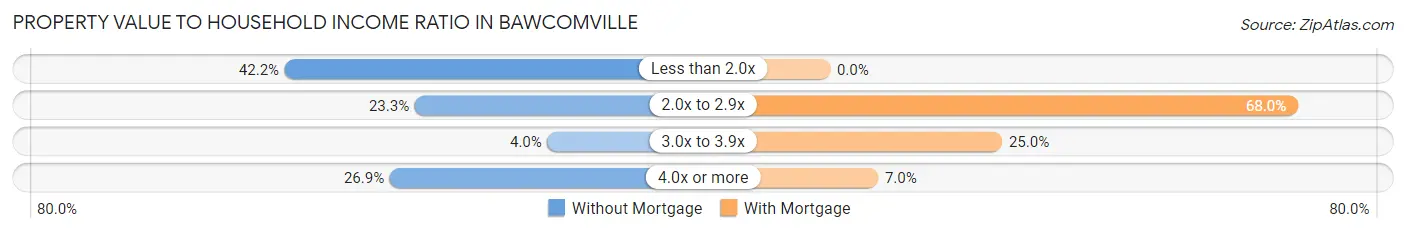
| Value-to-Income Ratio | Without Mortgage | With Mortgage |
| Less than 2.0x | 221 (42.2%) | 0 (0.0%) |
| 2.0x to 2.9x | 122 (23.3%) | 117 (68.0%) |
| 3.0x to 3.9x | 21 (4.0%) | 43 (25.0%) |
| 4.0x or more | 141 (26.9%) | 12 (7.0%) |
| Total | 524 (100.0%) | 172 (100.0%) |
Real Estate Taxes by Mortgage Status in Bawcomville
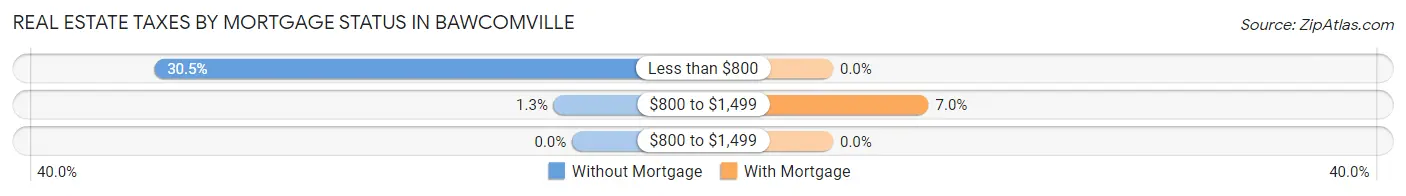
| Property Taxes | Without Mortgage | With Mortgage |
| Less than $800 | 160 (30.5%) | 0 (0.0%) |
| $800 to $1,499 | 7 (1.3%) | 12 (7.0%) |
| $800 to $1,499 | 0 (0.0%) | 0 (0.0%) |
| Total | 524 (100.0%) | 172 (100.0%) |
Health & Disability in Bawcomville
Health Insurance Coverage by Age in Bawcomville
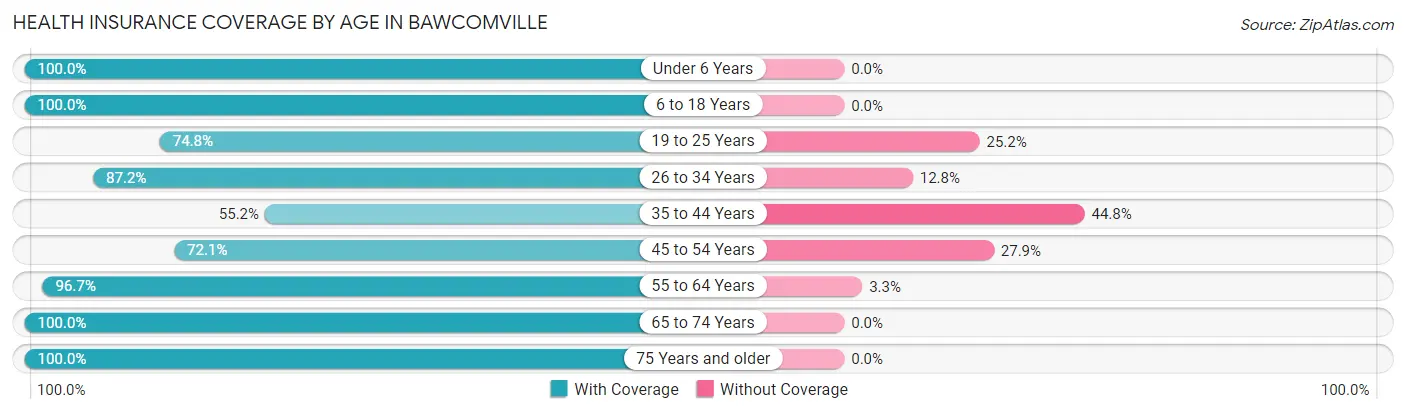
| Age Bracket | With Coverage | Without Coverage |
| Under 6 Years | 60 (100.0%) | 0 (0.0%) |
| 6 to 18 Years | 353 (100.0%) | 0 (0.0%) |
| 19 to 25 Years | 86 (74.8%) | 29 (25.2%) |
| 26 to 34 Years | 123 (87.2%) | 18 (12.8%) |
| 35 to 44 Years | 308 (55.2%) | 250 (44.8%) |
| 45 to 54 Years | 274 (72.1%) | 106 (27.9%) |
| 55 to 64 Years | 492 (96.7%) | 17 (3.3%) |
| 65 to 74 Years | 333 (100.0%) | 0 (0.0%) |
| 75 Years and older | 205 (100.0%) | 0 (0.0%) |
| Total | 2,234 (84.2%) | 420 (15.8%) |
Health Insurance Coverage by Citizenship Status in Bawcomville
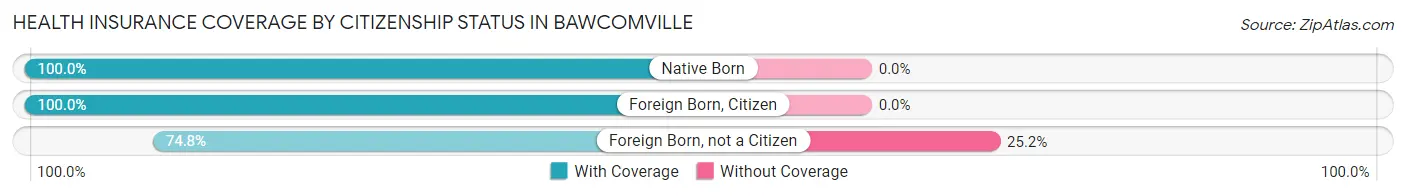
| Citizenship Status | With Coverage | Without Coverage |
| Native Born | 60 (100.0%) | 0 (0.0%) |
| Foreign Born, Citizen | 353 (100.0%) | 0 (0.0%) |
| Foreign Born, not a Citizen | 86 (74.8%) | 29 (25.2%) |
Health Insurance Coverage by Household Income in Bawcomville
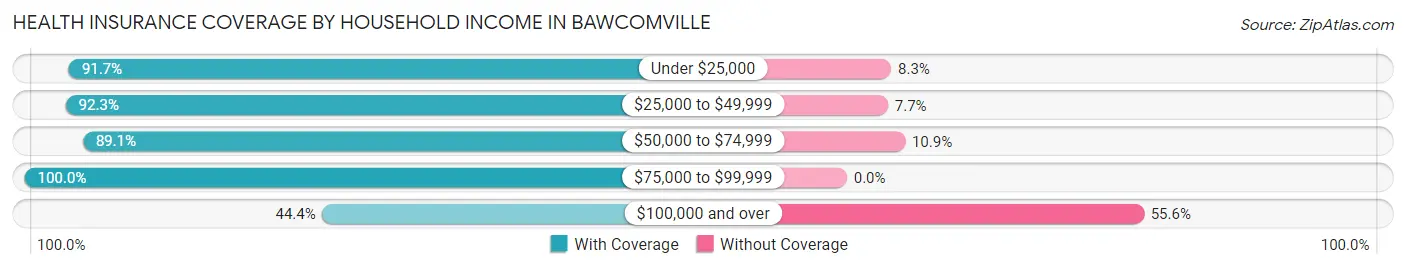
| Household Income | With Coverage | Without Coverage |
| Under $25,000 | 862 (91.7%) | 78 (8.3%) |
| $25,000 to $49,999 | 636 (92.3%) | 53 (7.7%) |
| $50,000 to $74,999 | 384 (89.1%) | 47 (10.9%) |
| $75,000 to $99,999 | 159 (100.0%) | 0 (0.0%) |
| $100,000 and over | 193 (44.4%) | 242 (55.6%) |
Public vs Private Health Insurance Coverage by Age in Bawcomville
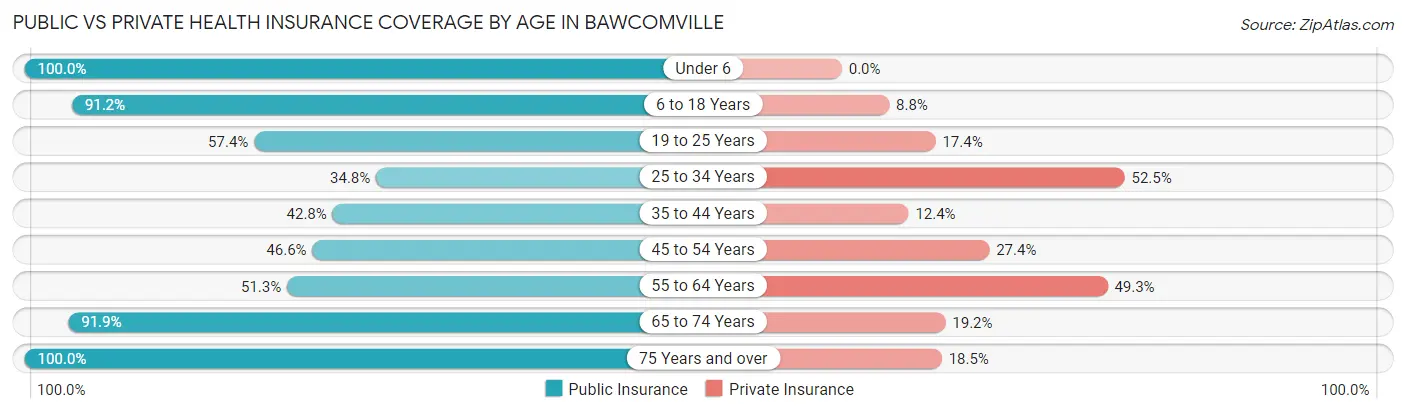
| Age Bracket | Public Insurance | Private Insurance |
| Under 6 | 60 (100.0%) | 0 (0.0%) |
| 6 to 18 Years | 322 (91.2%) | 31 (8.8%) |
| 19 to 25 Years | 66 (57.4%) | 20 (17.4%) |
| 25 to 34 Years | 49 (34.7%) | 74 (52.5%) |
| 35 to 44 Years | 239 (42.8%) | 69 (12.4%) |
| 45 to 54 Years | 177 (46.6%) | 104 (27.4%) |
| 55 to 64 Years | 261 (51.3%) | 251 (49.3%) |
| 65 to 74 Years | 306 (91.9%) | 64 (19.2%) |
| 75 Years and over | 205 (100.0%) | 38 (18.5%) |
| Total | 1,685 (63.5%) | 651 (24.5%) |
Disability Status by Sex by Age in Bawcomville
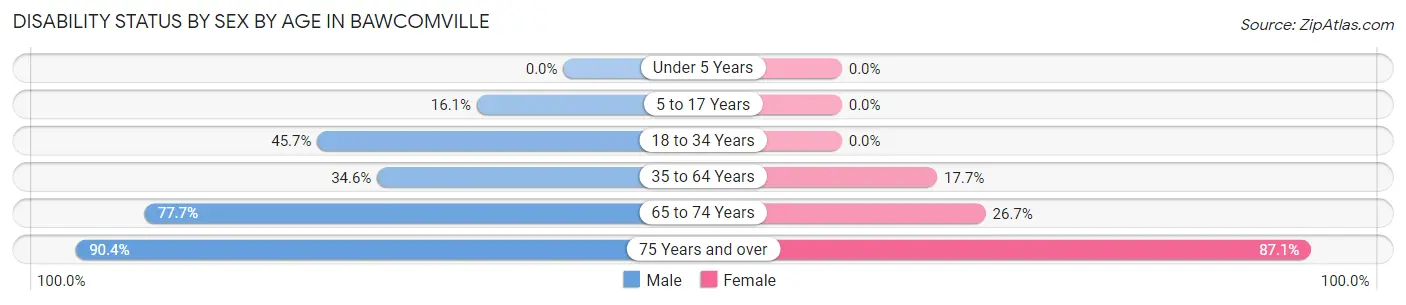
| Age Bracket | Male | Female |
| Under 5 Years | 0 (0.0%) | 0 (0.0%) |
| 5 to 17 Years | 13 (16.1%) | 0 (0.0%) |
| 18 to 34 Years | 116 (45.7%) | 0 (0.0%) |
| 35 to 64 Years | 283 (34.5%) | 111 (17.7%) |
| 65 to 74 Years | 87 (77.7%) | 59 (26.7%) |
| 75 Years and over | 66 (90.4%) | 115 (87.1%) |
Disability Class by Sex by Age in Bawcomville
Disability Class: Hearing Difficulty
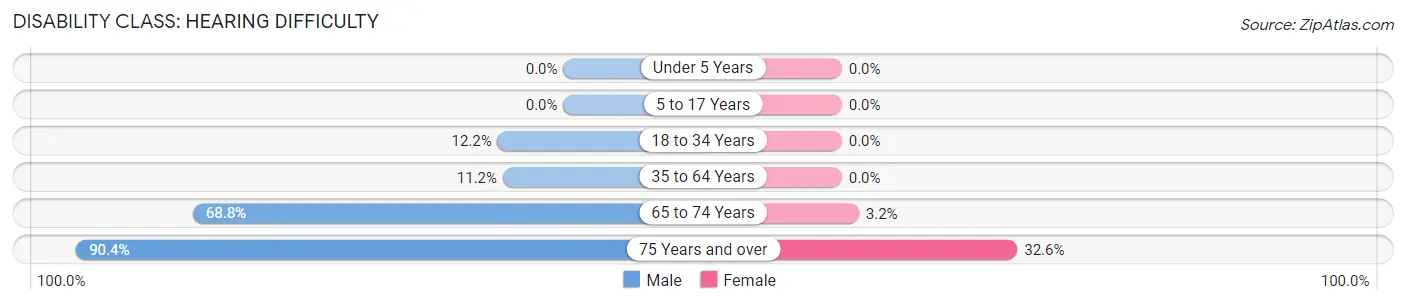
| Age Bracket | Male | Female |
| Under 5 Years | 0 (0.0%) | 0 (0.0%) |
| 5 to 17 Years | 0 (0.0%) | 0 (0.0%) |
| 18 to 34 Years | 31 (12.2%) | 0 (0.0%) |
| 35 to 64 Years | 92 (11.2%) | 0 (0.0%) |
| 65 to 74 Years | 77 (68.8%) | 7 (3.2%) |
| 75 Years and over | 66 (90.4%) | 43 (32.6%) |
Disability Class: Vision Difficulty
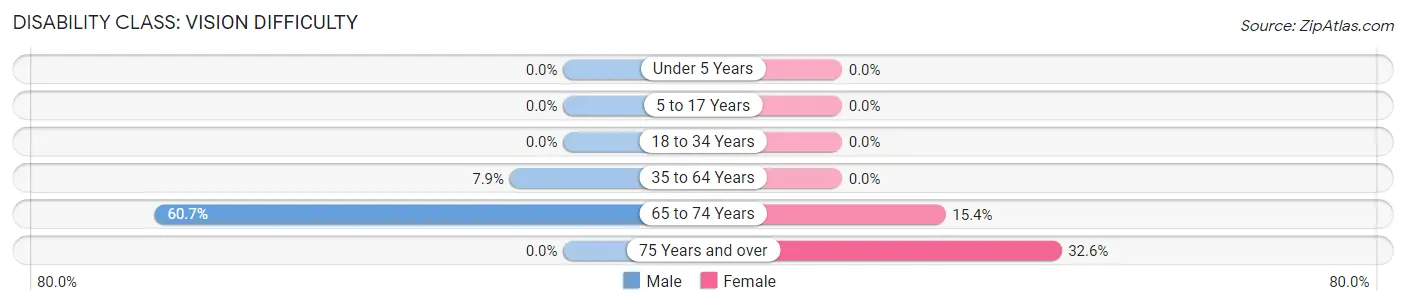
| Age Bracket | Male | Female |
| Under 5 Years | 0 (0.0%) | 0 (0.0%) |
| 5 to 17 Years | 0 (0.0%) | 0 (0.0%) |
| 18 to 34 Years | 0 (0.0%) | 0 (0.0%) |
| 35 to 64 Years | 65 (7.9%) | 0 (0.0%) |
| 65 to 74 Years | 68 (60.7%) | 34 (15.4%) |
| 75 Years and over | 0 (0.0%) | 43 (32.6%) |
Disability Class: Cognitive Difficulty
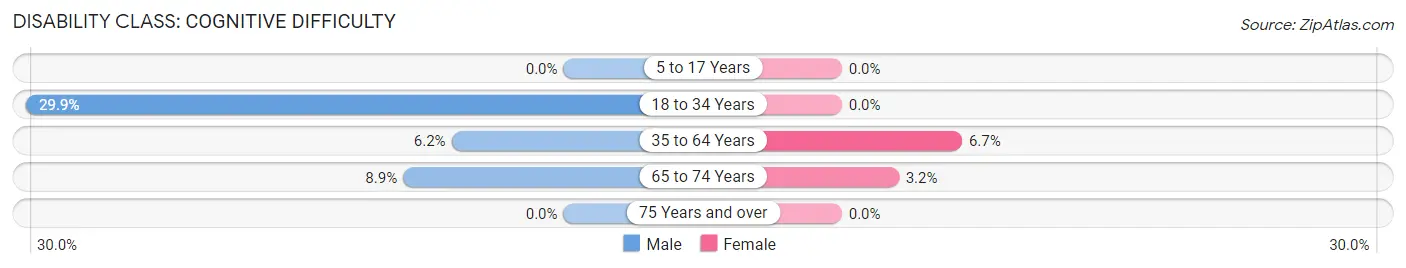
| Age Bracket | Male | Female |
| 5 to 17 Years | 0 (0.0%) | 0 (0.0%) |
| 18 to 34 Years | 76 (29.9%) | 0 (0.0%) |
| 35 to 64 Years | 51 (6.2%) | 42 (6.7%) |
| 65 to 74 Years | 10 (8.9%) | 7 (3.2%) |
| 75 Years and over | 0 (0.0%) | 0 (0.0%) |
Disability Class: Ambulatory Difficulty
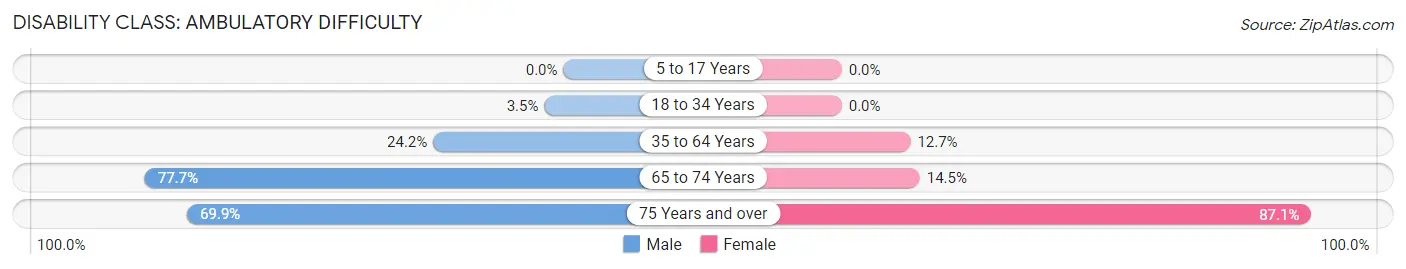
| Age Bracket | Male | Female |
| 5 to 17 Years | 0 (0.0%) | 0 (0.0%) |
| 18 to 34 Years | 9 (3.5%) | 0 (0.0%) |
| 35 to 64 Years | 198 (24.2%) | 80 (12.7%) |
| 65 to 74 Years | 87 (77.7%) | 32 (14.5%) |
| 75 Years and over | 51 (69.9%) | 115 (87.1%) |
Disability Class: Self-Care Difficulty
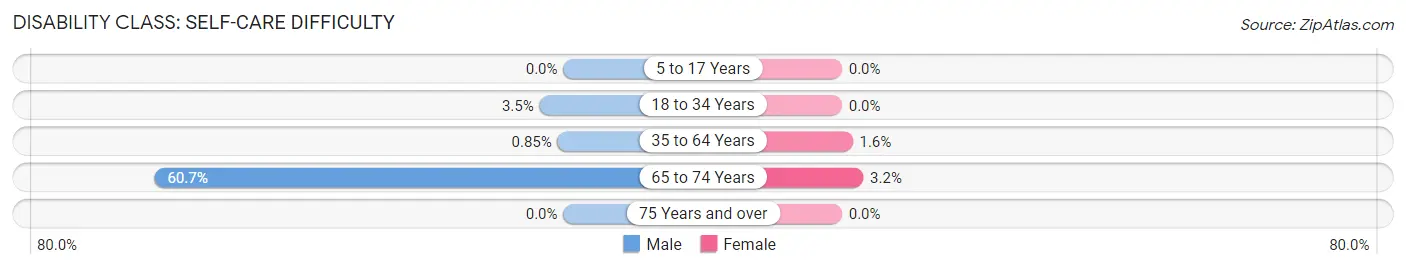
| Age Bracket | Male | Female |
| 5 to 17 Years | 0 (0.0%) | 0 (0.0%) |
| 18 to 34 Years | 9 (3.5%) | 0 (0.0%) |
| 35 to 64 Years | 7 (0.9%) | 10 (1.6%) |
| 65 to 74 Years | 68 (60.7%) | 7 (3.2%) |
| 75 Years and over | 0 (0.0%) | 0 (0.0%) |
Technology Access in Bawcomville
Computing Device Access in Bawcomville
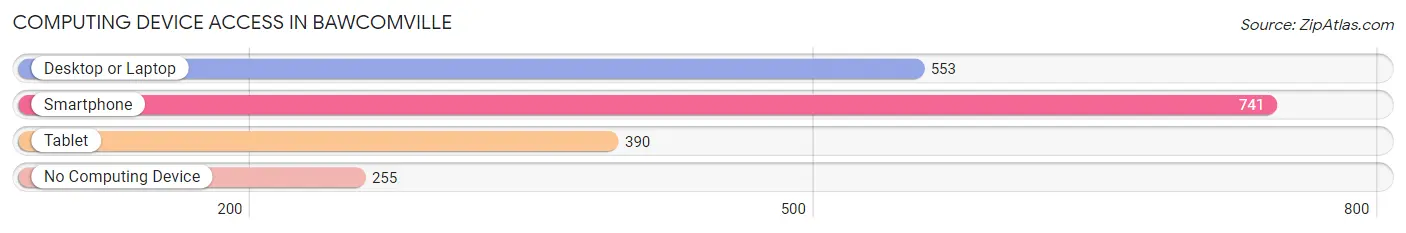
| Device Type | # Households | % Households |
| Desktop or Laptop | 553 | 46.6% |
| Smartphone | 741 | 62.4% |
| Tablet | 390 | 32.8% |
| No Computing Device | 255 | 21.5% |
| Total | 1,188 | 100.0% |
Internet Access in Bawcomville
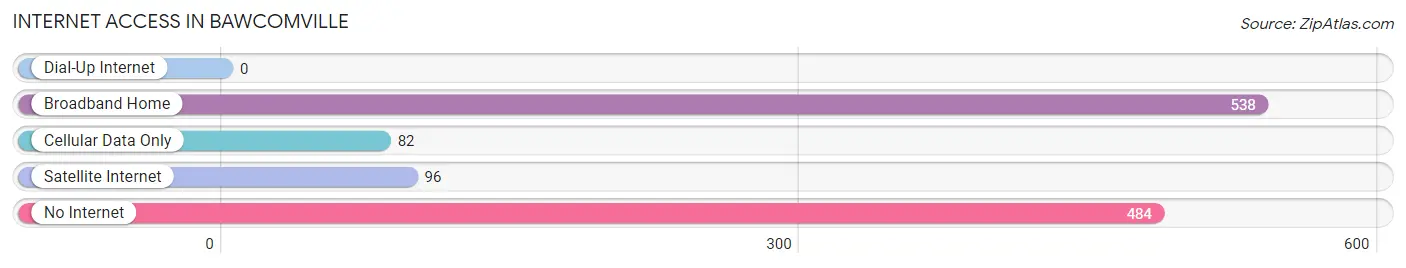
| Internet Type | # Households | % Households |
| Dial-Up Internet | 0 | 0.0% |
| Broadband Home | 538 | 45.3% |
| Cellular Data Only | 82 | 6.9% |
| Satellite Internet | 96 | 8.1% |
| No Internet | 484 | 40.7% |
| Total | 1,188 | 100.0% |
Bawcomville Summary
Bawcomville, Louisiana is a small town located in the northern part of the state, near the Mississippi River. It is a rural community with a population of just over 1,000 people. The town is known for its rich history, diverse geography, and unique economy.
History
Bawcomville was founded in 1820 by a group of settlers from the nearby town of Natchez. The settlers were looking for a place to settle and start a new life. The town was named after the first settler, William Bawcom. The town quickly grew and became a thriving community.
In the late 1800s, Bawcomville was a major stop on the Mississippi River. It was a popular destination for steamboats and other river traffic. The town was also a major hub for the cotton industry. The town was home to several cotton mills and warehouses.
In the early 1900s, the town began to decline. The cotton industry moved away and the river traffic decreased. The town was left with a small population and few economic opportunities.
Geography
Bawcomville is located in the northern part of Louisiana, near the Mississippi River. The town is situated on a flat plain, with the river to the east and the hills of the Ouachita Mountains to the west. The town is surrounded by farmland and forests.
The climate in Bawcomville is humid subtropical, with hot summers and mild winters. The average temperature in the summer is around 90 degrees Fahrenheit, and the average temperature in the winter is around 50 degrees Fahrenheit.
Economy
The economy of Bawcomville is largely based on agriculture. The town is home to several farms, which produce a variety of crops, including corn, soybeans, and cotton. The town also has a few small businesses, such as a grocery store, a hardware store, and a few restaurants.
The town is also home to a few manufacturing companies, which produce a variety of products, including furniture, clothing, and electronics.
Demographics
As of the 2010 census, the population of Bawcomville was 1,072. The town is predominantly white, with a small African American population. The median household income is $35,000, and the median age is 38.
Bawcomville is a small town with a rich history, diverse geography, and unique economy. The town is home to a variety of businesses and industries, and the population is diverse and welcoming. Bawcomville is a great place to live and work, and it is a great example of the beauty and culture of Louisiana.
Common Questions
What is the Total Population of Bawcomville?
Total Population of Bawcomville is 2,654.
What is the Total Male Population of Bawcomville?
Total Male Population of Bawcomville is 1,361.
What is the Total Female Population of Bawcomville?
Total Female Population of Bawcomville is 1,293.
What is the Ratio of Males per 100 Females in Bawcomville?
There are 105.26 Males per 100 Females in Bawcomville.
What is the Ratio of Females per 100 Males in Bawcomville?
There are 95.00 Females per 100 Males in Bawcomville.
What is the Median Population Age in Bawcomville?
Median Population Age in Bawcomville is 49.5 Years.
What is the Average Family Size in Bawcomville
Average Family Size in Bawcomville is 2.9 People.
What is the Average Household Size in Bawcomville
Average Household Size in Bawcomville is 2.2 People.
What is Per Capita Income in Bawcomville?
Per Capita income in Bawcomville is $20,756.
What is the Median Family Income in Bawcomville?
Median Family Income in Bawcomville is $40,417.
What is the Median Household income in Bawcomville?
Median Household Income in Bawcomville is $30,636.
What is Income or Wage Gap in Bawcomville?
Income or Wage Gap in Bawcomville is 39.6%.
Women in Bawcomville earn 60.4 cents for every dollar earned by a man.
What is Inequality or Gini Index in Bawcomville?
Inequality or Gini Index in Bawcomville is 0.48.
How Large is the Labor Force in Bawcomville?
There are 1,109 People in the Labor Forcein in Bawcomville.
What is the Percentage of People in the Labor Force in Bawcomville?
46.5% of People are in the Labor Force in Bawcomville.
What is the Unemployment Rate in Bawcomville?
Unemployment Rate in Bawcomville is 5.6%.