Arnaudville, LA
Arnaudville Map
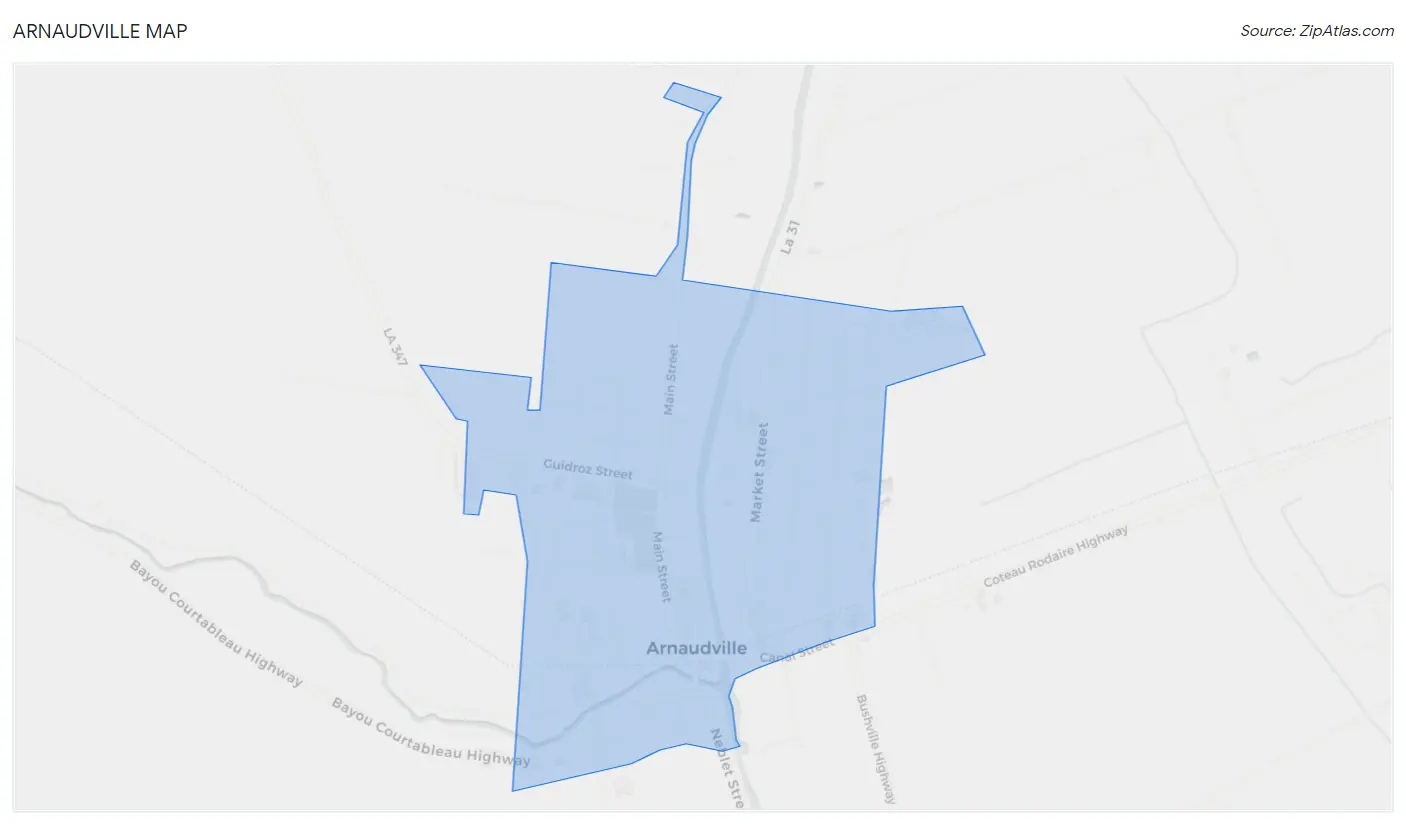
Arnaudville Overview
1,522
TOTAL POPULATION
822
MALE POPULATION
700
FEMALE POPULATION
117.43
MALES / 100 FEMALES
85.16
FEMALES / 100 MALES
29.5
MEDIAN AGE
2.5
AVG FAMILY SIZE
2.4
AVG HOUSEHOLD SIZE
$17,931
PER CAPITA INCOME
$16,371
AVG FAMILY INCOME
$24,219
AVG HOUSEHOLD INCOME
66.6%
WAGE / INCOME GAP [ % ]
33.4¢/ $1
WAGE / INCOME GAP [ $ ]
0.58
INEQUALITY / GINI INDEX
599
LABOR FORCE [ PEOPLE ]
48.5%
PERCENT IN LABOR FORCE
7.0%
UNEMPLOYMENT RATE
Arnaudville Zip Codes
Arnaudville Area Codes
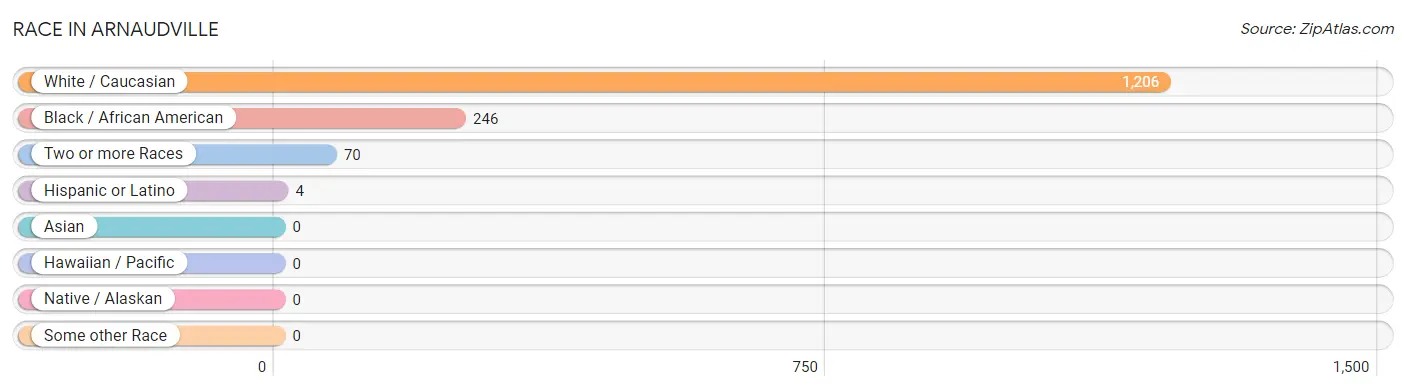
Race in Arnaudville
The most populous races in Arnaudville are White / Caucasian (1,206 | 79.2%), Black / African American (246 | 16.2%), and Two or more Races (70 | 4.6%).
| Race | # Population | % Population |
| Asian | 0 | 0.0% |
| Black / African American | 246 | 16.2% |
| Hawaiian / Pacific | 0 | 0.0% |
| Hispanic or Latino | 4 | 0.3% |
| Native / Alaskan | 0 | 0.0% |
| White / Caucasian | 1,206 | 79.2% |
| Two or more Races | 70 | 4.6% |
| Some other Race | 0 | 0.0% |
| Total | 1,522 | 100.0% |
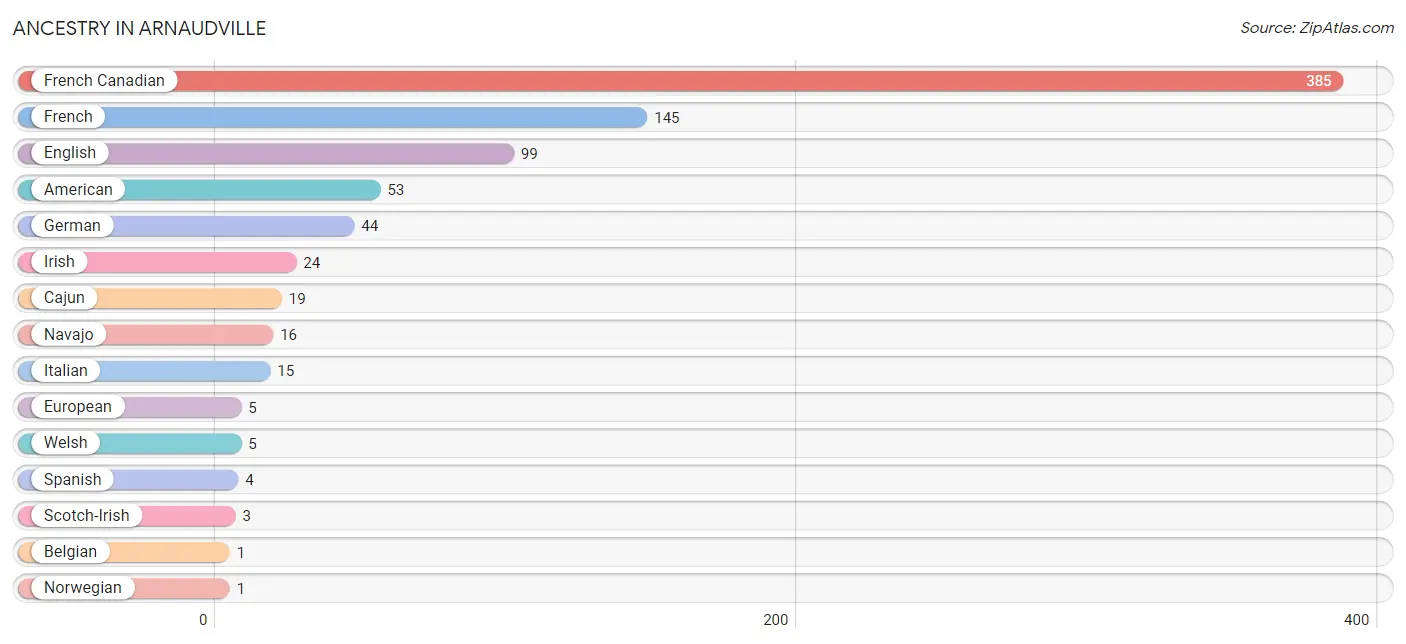
Ancestry in Arnaudville
The most populous ancestries reported in Arnaudville are French Canadian (385 | 25.3%), French (145 | 9.5%), English (99 | 6.5%), American (53 | 3.5%), and German (44 | 2.9%), together accounting for 47.7% of all Arnaudville residents.
| Ancestry | # Population | % Population |
| American | 53 | 3.5% |
| Belgian | 1 | 0.1% |
| Cajun | 19 | 1.3% |
| English | 99 | 6.5% |
| European | 5 | 0.3% |
| French | 145 | 9.5% |
| French Canadian | 385 | 25.3% |
| German | 44 | 2.9% |
| Irish | 24 | 1.6% |
| Italian | 15 | 1.0% |
| Navajo | 16 | 1.1% |
| Norwegian | 1 | 0.1% |
| Scotch-Irish | 3 | 0.2% |
| Spanish | 4 | 0.3% |
| Welsh | 5 | 0.3% | View All 15 Rows |
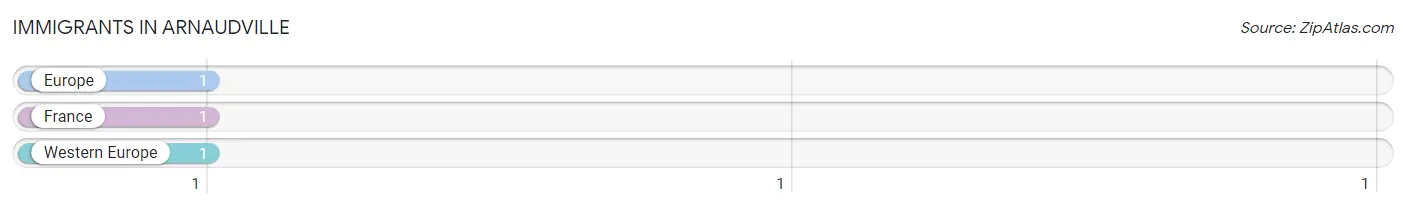
Immigrants in Arnaudville
The most numerous immigrant groups reported in Arnaudville came from Europe (1 | 0.1%), France (1 | 0.1%), and Western Europe (1 | 0.1%), together accounting for 0.2% of all Arnaudville residents.
| Immigration Origin | # Population | % Population |
| Europe | 1 | 0.1% |
| France | 1 | 0.1% |
| Western Europe | 1 | 0.1% | View All 3 Rows |
Sex and Age in Arnaudville
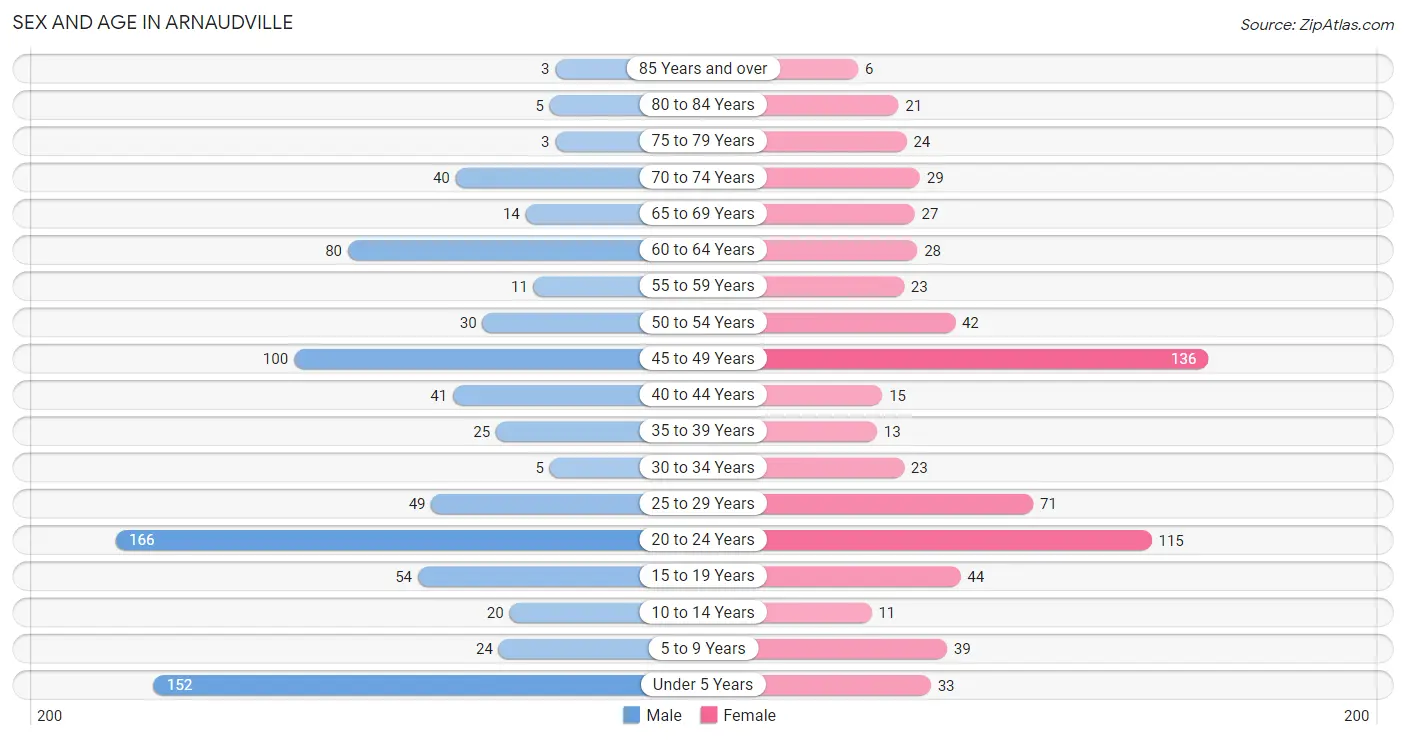
Sex and Age in Arnaudville
The most populous age groups in Arnaudville are 20 to 24 Years (166 | 20.2%) for men and 45 to 49 Years (136 | 19.4%) for women.
| Age Bracket | Male | Female |
| Under 5 Years | 152 (18.5%) | 33 (4.7%) |
| 5 to 9 Years | 24 (2.9%) | 39 (5.6%) |
| 10 to 14 Years | 20 (2.4%) | 11 (1.6%) |
| 15 to 19 Years | 54 (6.6%) | 44 (6.3%) |
| 20 to 24 Years | 166 (20.2%) | 115 (16.4%) |
| 25 to 29 Years | 49 (6.0%) | 71 (10.1%) |
| 30 to 34 Years | 5 (0.6%) | 23 (3.3%) |
| 35 to 39 Years | 25 (3.0%) | 13 (1.9%) |
| 40 to 44 Years | 41 (5.0%) | 15 (2.1%) |
| 45 to 49 Years | 100 (12.2%) | 136 (19.4%) |
| 50 to 54 Years | 30 (3.6%) | 42 (6.0%) |
| 55 to 59 Years | 11 (1.3%) | 23 (3.3%) |
| 60 to 64 Years | 80 (9.7%) | 28 (4.0%) |
| 65 to 69 Years | 14 (1.7%) | 27 (3.9%) |
| 70 to 74 Years | 40 (4.9%) | 29 (4.1%) |
| 75 to 79 Years | 3 (0.4%) | 24 (3.4%) |
| 80 to 84 Years | 5 (0.6%) | 21 (3.0%) |
| 85 Years and over | 3 (0.4%) | 6 (0.9%) |
| Total | 822 (100.0%) | 700 (100.0%) |
Families and Households in Arnaudville
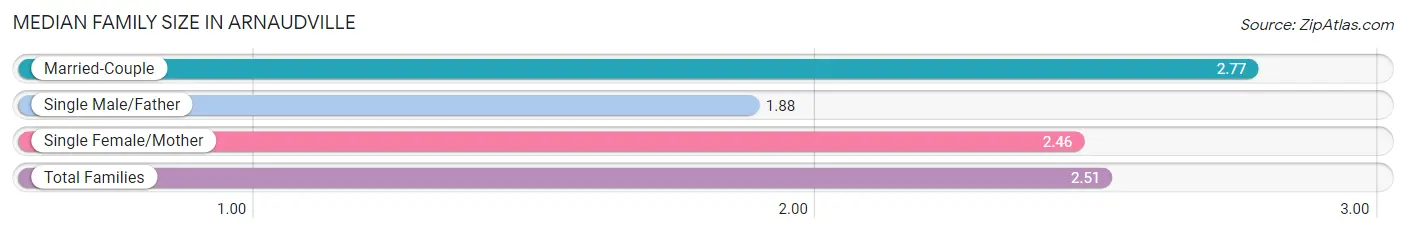
Median Family Size in Arnaudville
The median family size in Arnaudville is 2.51 persons per family, with married-couple families (120 | 31.9%) accounting for the largest median family size of 2.77 persons per family. On the other hand, single male/father families (33 | 8.8%) represent the smallest median family size with 1.88 persons per family.
| Family Type | # Families | Family Size |
| Married-Couple | 120 (31.9%) | 2.77 |
| Single Male/Father | 33 (8.8%) | 1.88 |
| Single Female/Mother | 223 (59.3%) | 2.46 |
| Total Families | 376 (100.0%) | 2.51 |
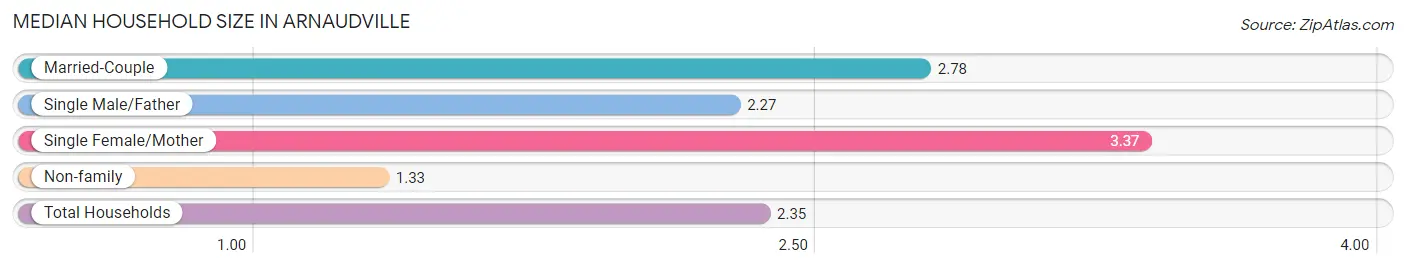
Median Household Size in Arnaudville
The median household size in Arnaudville is 2.35 persons per household, with single female/mother households (223 | 34.5%) accounting for the largest median household size of 3.37 persons per household. non-family households (271 | 41.9%) represent the smallest median household size with 1.33 persons per household.
| Household Type | # Households | Household Size |
| Married-Couple | 120 (18.5%) | 2.78 |
| Single Male/Father | 33 (5.1%) | 2.27 |
| Single Female/Mother | 223 (34.5%) | 3.37 |
| Non-family | 271 (41.9%) | 1.33 |
| Total Households | 647 (100.0%) | 2.35 |
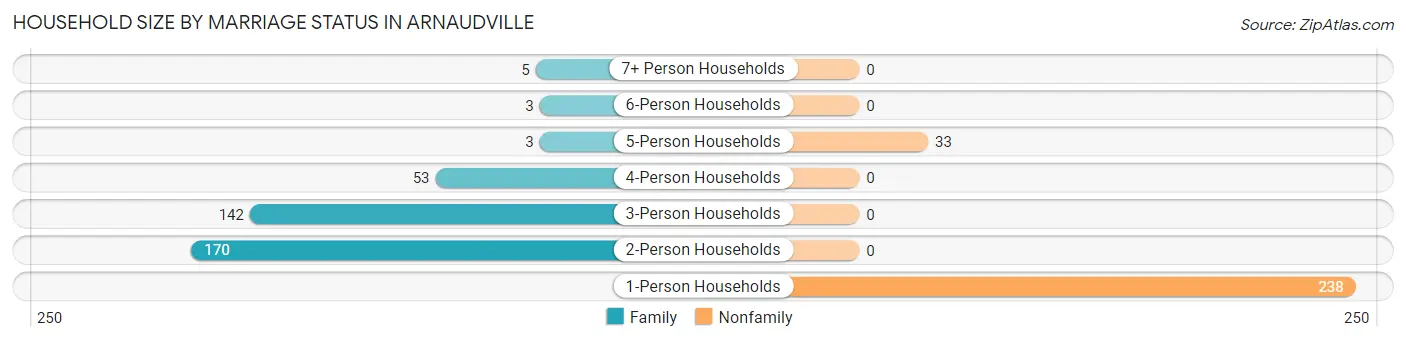
Household Size by Marriage Status in Arnaudville
Out of a total of 647 households in Arnaudville, 376 (58.1%) are family households, while 271 (41.9%) are nonfamily households. The most numerous type of family households are 2-person households, comprising 170, and the most common type of nonfamily households are 1-person households, comprising 238.
| Household Size | Family Households | Nonfamily Households |
| 1-Person Households | - | 238 (36.8%) |
| 2-Person Households | 170 (26.3%) | 0 (0.0%) |
| 3-Person Households | 142 (22.0%) | 0 (0.0%) |
| 4-Person Households | 53 (8.2%) | 0 (0.0%) |
| 5-Person Households | 3 (0.5%) | 33 (5.1%) |
| 6-Person Households | 3 (0.5%) | 0 (0.0%) |
| 7+ Person Households | 5 (0.8%) | 0 (0.0%) |
| Total | 376 (58.1%) | 271 (41.9%) |
Female Fertility in Arnaudville
Fertility by Age in Arnaudville
| Age Bracket | Women with Births | Births / 1,000 Women |
| 15 to 19 years | 0 (0.0%) | 0.0 |
| 20 to 34 years | 0 (0.0%) | 0.0 |
| 35 to 50 years | 0 (0.0%) | 0.0 |
| Total | 0 (0.0%) | 0.0 |
Fertility by Age by Marriage Status in Arnaudville
| Age Bracket | Married | Unmarried |
| 15 to 19 years | 0 (0.0%) | 0 (0.0%) |
| 20 to 34 years | 0 (0.0%) | 0 (0.0%) |
| 35 to 50 years | 0 (0.0%) | 0 (0.0%) |
| Total | 0 (0.0%) | 0 (0.0%) |
Fertility by Education in Arnaudville
| Educational Attainment | Women with Births | Births / 1,000 Women |
| Less than High School | 0 (0.0%) | 0.0 |
| High School Diploma | 0 (0.0%) | 0.0 |
| College or Associate's Degree | 0 (0.0%) | 0.0 |
| Bachelor's Degree | 0 (0.0%) | 0.0 |
| Graduate Degree | 0 (0.0%) | 0.0 |
| Total | 0 (0.0%) | 0.0 |
Fertility by Education by Marriage Status in Arnaudville
| Educational Attainment | Married | Unmarried |
| Less than High School | 0 (0.0%) | 0 (0.0%) |
| High School Diploma | 0 (0.0%) | 0 (0.0%) |
| College or Associate's Degree | 0 (0.0%) | 0 (0.0%) |
| Bachelor's Degree | 0 (0.0%) | 0 (0.0%) |
| Graduate Degree | 0 (0.0%) | 0 (0.0%) |
| Total | 0 (0.0%) | 0 (0.0%) |
Income in Arnaudville
Income Overview in Arnaudville
Per Capita Income in Arnaudville is $17,931, while median incomes of families and households are $16,371 and $24,219 respectively.
| Characteristic | Number | Measure |
| Per Capita Income | 1,522 | $17,931 |
| Median Family Income | 376 | $16,371 |
| Mean Family Income | 376 | $35,152 |
| Median Household Income | 647 | $24,219 |
| Mean Household Income | 647 | $43,078 |
| Income Deficit | 376 | $0 |
| Wage / Income Gap (%) | 1,522 | 66.60% |
| Wage / Income Gap ($) | 1,522 | 33.40¢ per $1 |
| Gini / Inequality Index | 1,522 | 0.58 |
Earnings by Sex in Arnaudville
Average Earnings in Arnaudville are $20,789, $45,114 for men and $15,066 for women, a difference of 66.6%.
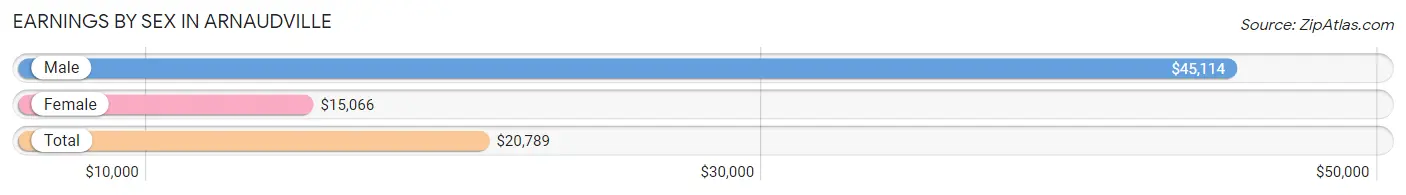
| Sex | Number | Average Earnings |
| Male | 235 (37.1%) | $45,114 |
| Female | 399 (62.9%) | $15,066 |
| Total | 634 (100.0%) | $20,789 |
Earnings by Sex by Income Bracket in Arnaudville
The most common earnings brackets in Arnaudville are $75,000 to $99,999 for men (34 | 14.5%) and $2,499 or less for women (83 | 20.8%).
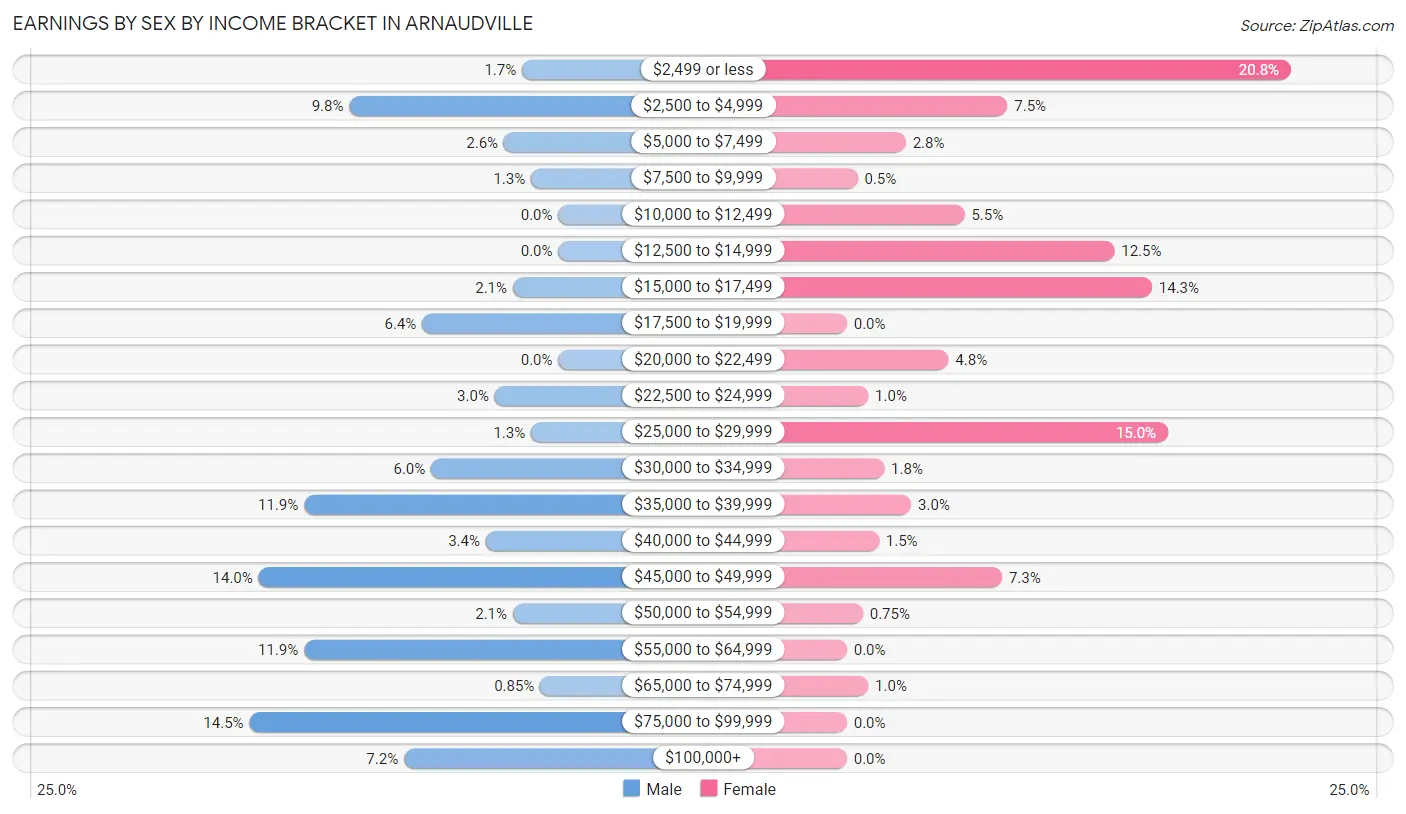
| Income | Male | Female |
| $2,499 or less | 4 (1.7%) | 83 (20.8%) |
| $2,500 to $4,999 | 23 (9.8%) | 30 (7.5%) |
| $5,000 to $7,499 | 6 (2.5%) | 11 (2.8%) |
| $7,500 to $9,999 | 3 (1.3%) | 2 (0.5%) |
| $10,000 to $12,499 | 0 (0.0%) | 22 (5.5%) |
| $12,500 to $14,999 | 0 (0.0%) | 50 (12.5%) |
| $15,000 to $17,499 | 5 (2.1%) | 57 (14.3%) |
| $17,500 to $19,999 | 15 (6.4%) | 0 (0.0%) |
| $20,000 to $22,499 | 0 (0.0%) | 19 (4.8%) |
| $22,500 to $24,999 | 7 (3.0%) | 4 (1.0%) |
| $25,000 to $29,999 | 3 (1.3%) | 60 (15.0%) |
| $30,000 to $34,999 | 14 (6.0%) | 7 (1.8%) |
| $35,000 to $39,999 | 28 (11.9%) | 12 (3.0%) |
| $40,000 to $44,999 | 8 (3.4%) | 6 (1.5%) |
| $45,000 to $49,999 | 33 (14.0%) | 29 (7.3%) |
| $50,000 to $54,999 | 5 (2.1%) | 3 (0.7%) |
| $55,000 to $64,999 | 28 (11.9%) | 0 (0.0%) |
| $65,000 to $74,999 | 2 (0.9%) | 4 (1.0%) |
| $75,000 to $99,999 | 34 (14.5%) | 0 (0.0%) |
| $100,000+ | 17 (7.2%) | 0 (0.0%) |
| Total | 235 (100.0%) | 399 (100.0%) |
Earnings by Sex by Educational Attainment in Arnaudville
Average earnings in Arnaudville are $46,174 for men and $16,601 for women, a difference of 64.0%. Men with an educational attainment of bachelor's degree enjoy the highest average annual earnings of $84,000, while those with high school diploma education earn the least with $45,644. Women with an educational attainment of bachelor's degree earn the most with the average annual earnings of $35,833, while those with high school diploma education have the smallest earnings of $13,850.
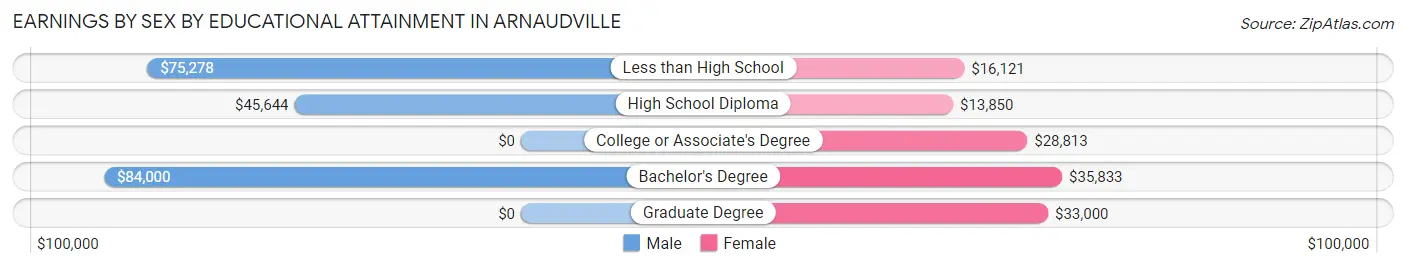
| Educational Attainment | Male Income | Female Income |
| Less than High School | $75,278 | $16,121 |
| High School Diploma | $45,644 | $13,850 |
| College or Associate's Degree | - | - |
| Bachelor's Degree | $84,000 | $35,833 |
| Graduate Degree | - | - |
| Total | $46,174 | $16,601 |
Family Income in Arnaudville
Family Income Brackets in Arnaudville
According to the Arnaudville family income data, there are 125 families falling into the less than $10,000 income range, which is the most common income bracket and makes up 33.2% of all families.
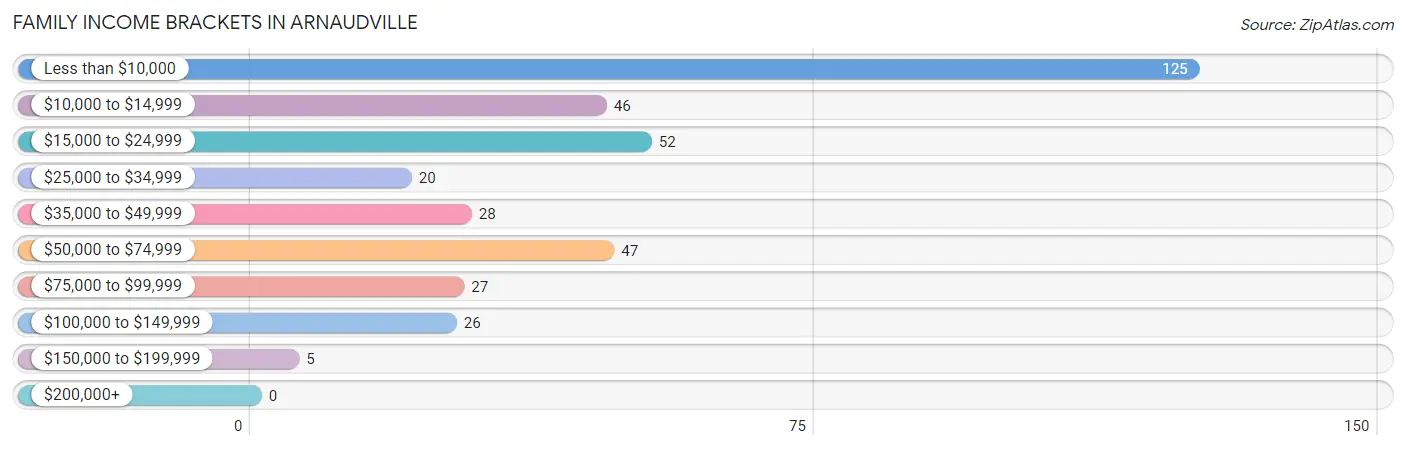
| Income Bracket | # Families | % Families |
| Less than $10,000 | 125 | 33.2% |
| $10,000 to $14,999 | 46 | 12.2% |
| $15,000 to $24,999 | 52 | 13.8% |
| $25,000 to $34,999 | 20 | 5.3% |
| $35,000 to $49,999 | 28 | 7.4% |
| $50,000 to $74,999 | 47 | 12.5% |
| $75,000 to $99,999 | 27 | 7.2% |
| $100,000 to $149,999 | 26 | 6.9% |
| $150,000 to $199,999 | 5 | 1.3% |
| $200,000+ | 0 | 0.0% |
Family Income by Famaliy Size in Arnaudville
4-person families (36 | 9.6%) account for the highest median family income in Arnaudville with $71,833 per family, while 4-person families (36 | 9.6%) have the highest median income of $17,958 per family member.
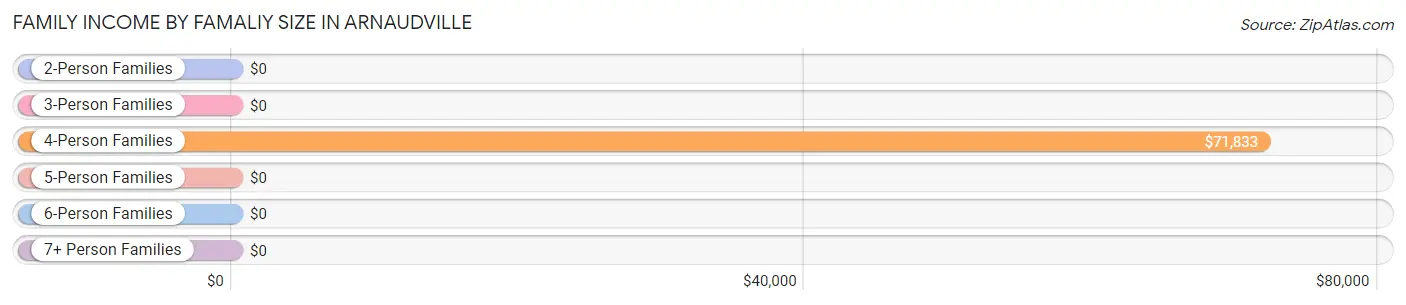
| Income Bracket | # Families | Median Income |
| 2-Person Families | 273 (72.6%) | $0 |
| 3-Person Families | 62 (16.5%) | $0 |
| 4-Person Families | 36 (9.6%) | $71,833 |
| 5-Person Families | 0 (0.0%) | $0 |
| 6-Person Families | 0 (0.0%) | $0 |
| 7+ Person Families | 5 (1.3%) | $0 |
| Total | 376 (100.0%) | $16,371 |
Family Income by Number of Earners in Arnaudville
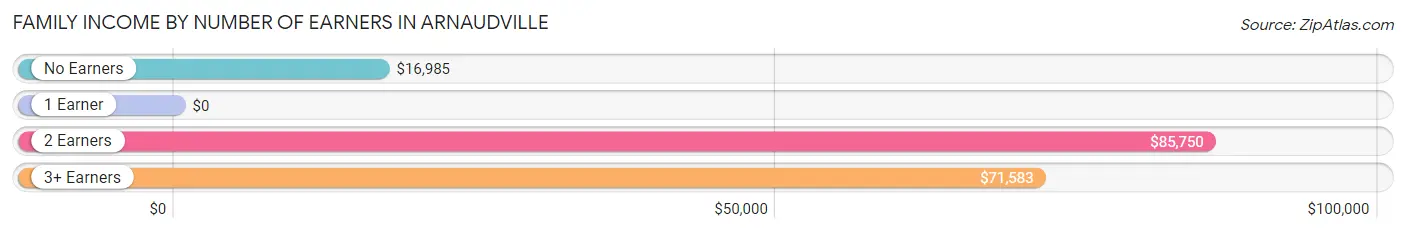
| Number of Earners | # Families | Median Income |
| No Earners | 61 (16.2%) | $16,985 |
| 1 Earner | 241 (64.1%) | $0 |
| 2 Earners | 55 (14.6%) | $85,750 |
| 3+ Earners | 19 (5.1%) | $71,583 |
| Total | 376 (100.0%) | $16,371 |
Household Income in Arnaudville
Household Income Brackets in Arnaudville
With 180 households falling in the category, the less than $10,000 income range is the most frequent in Arnaudville, accounting for 27.8% of all households. In contrast, only 5 households (0.8%) fall into the $150,000 to $199,999 income bracket, making it the least populous group.
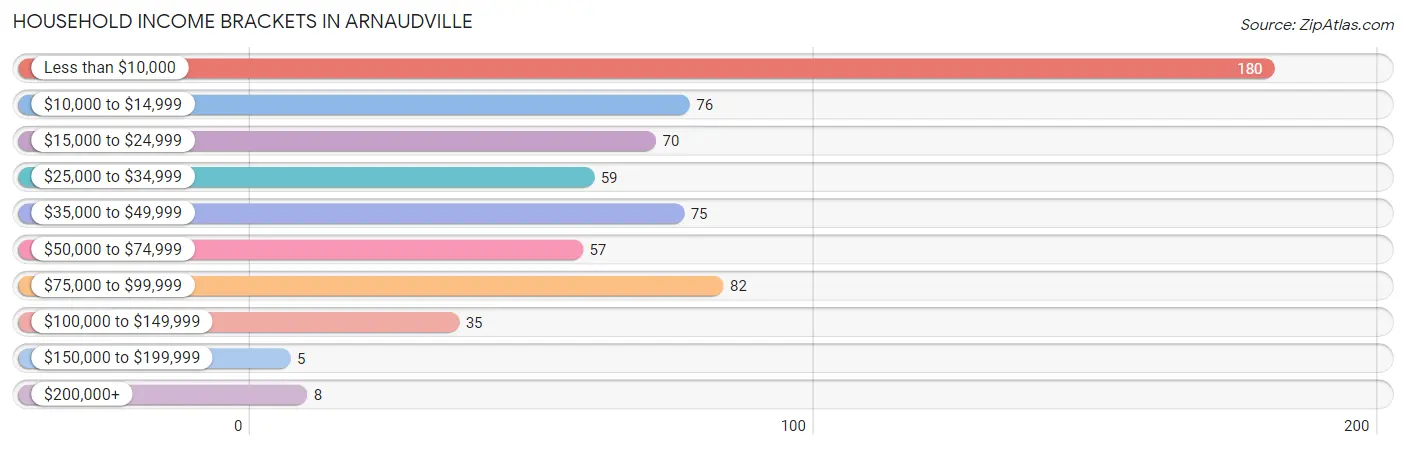
| Income Bracket | # Households | % Households |
| Less than $10,000 | 180 | 27.8% |
| $10,000 to $14,999 | 76 | 11.7% |
| $15,000 to $24,999 | 70 | 10.8% |
| $25,000 to $34,999 | 59 | 9.1% |
| $35,000 to $49,999 | 75 | 11.6% |
| $50,000 to $74,999 | 57 | 8.8% |
| $75,000 to $99,999 | 82 | 12.7% |
| $100,000 to $149,999 | 35 | 5.4% |
| $150,000 to $199,999 | 5 | 0.8% |
| $200,000+ | 8 | 1.2% |
Household Income by Householder Age in Arnaudville
The median household income in Arnaudville is $24,219, with the highest median household income of $76,176 found in the 25 to 44 years age bracket for the primary householder. A total of 138 households (21.3%) fall into this category. Meanwhile, the 15 to 24 years age bracket for the primary householder has the lowest median household income of $0, with 80 households (12.4%) in this group.
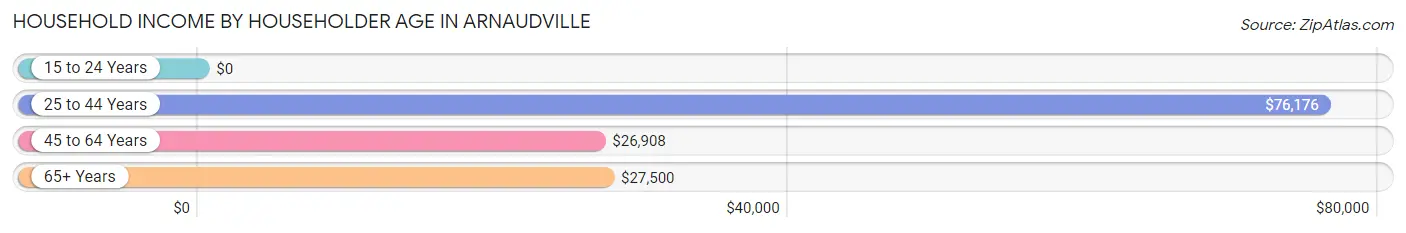
| Income Bracket | # Households | Median Income |
| 15 to 24 Years | 80 (12.4%) | $0 |
| 25 to 44 Years | 138 (21.3%) | $76,176 |
| 45 to 64 Years | 305 (47.1%) | $26,908 |
| 65+ Years | 124 (19.2%) | $27,500 |
| Total | 647 (100.0%) | $24,219 |
Poverty in Arnaudville
Income Below Poverty by Sex and Age in Arnaudville
With 61.1% poverty level for males and 47.9% for females among the residents of Arnaudville, 16 and 17 year old males and 18 to 24 year old females are the most vulnerable to poverty, with 8 males (100.0%) and 118 females (86.1%) in their respective age groups living below the poverty level.
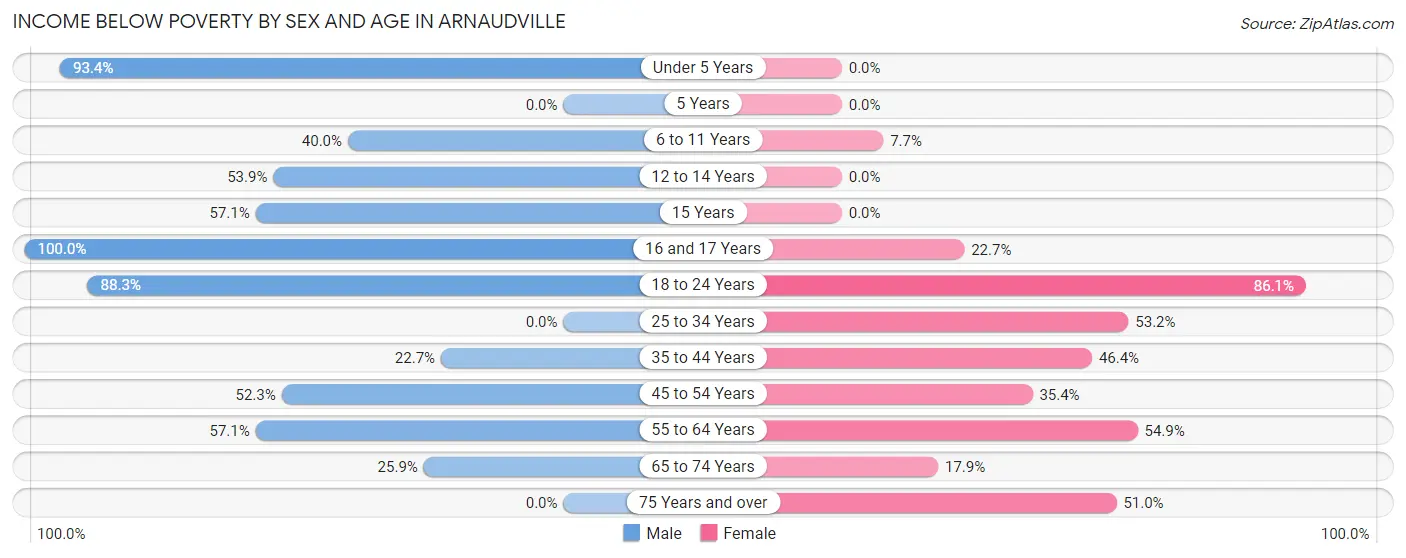
| Age Bracket | Male | Female |
| Under 5 Years | 142 (93.4%) | 0 (0.0%) |
| 5 Years | 0 (0.0%) | 0 (0.0%) |
| 6 to 11 Years | 6 (40.0%) | 3 (7.7%) |
| 12 to 14 Years | 7 (53.8%) | 0 (0.0%) |
| 15 Years | 4 (57.1%) | 0 (0.0%) |
| 16 and 17 Years | 8 (100.0%) | 5 (22.7%) |
| 18 to 24 Years | 181 (88.3%) | 118 (86.1%) |
| 25 to 34 Years | 0 (0.0%) | 50 (53.2%) |
| 35 to 44 Years | 15 (22.7%) | 13 (46.4%) |
| 45 to 54 Years | 68 (52.3%) | 63 (35.4%) |
| 55 to 64 Years | 52 (57.1%) | 28 (54.9%) |
| 65 to 74 Years | 14 (25.9%) | 10 (17.9%) |
| 75 Years and over | 0 (0.0%) | 26 (51.0%) |
| Total | 497 (61.1%) | 316 (47.9%) |
Income Above Poverty by Sex and Age in Arnaudville
According to the poverty statistics in Arnaudville, males aged 5 years and females aged 5 years are the age groups that are most secure financially, with 100.0% of males and 100.0% of females in these age groups living above the poverty line.
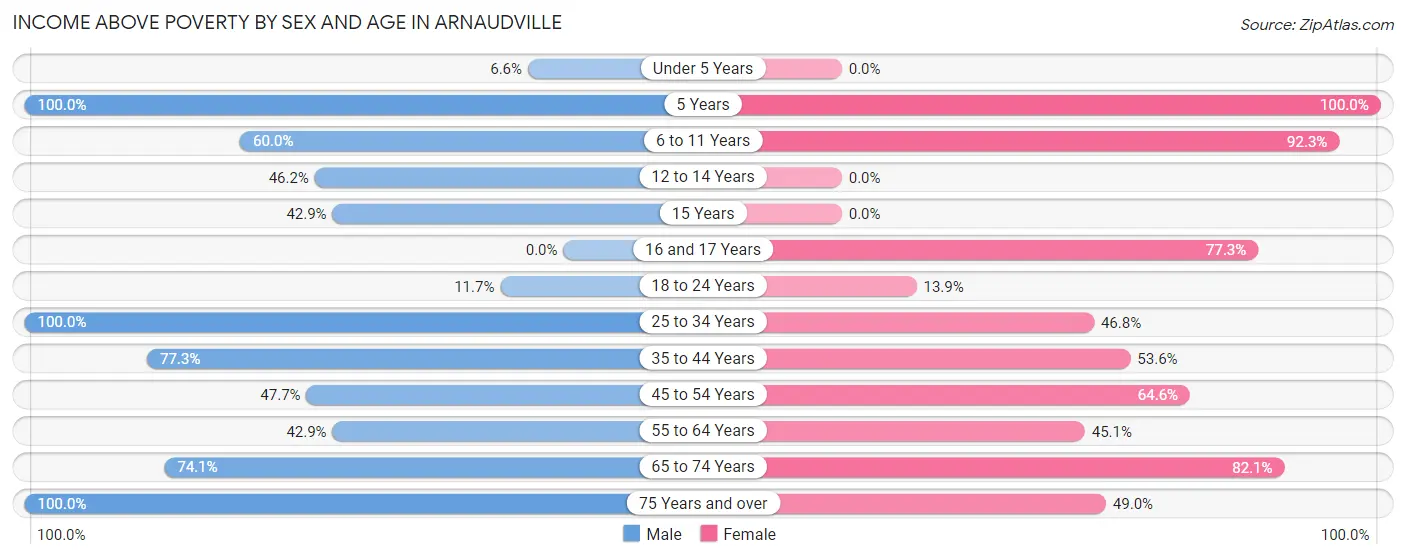
| Age Bracket | Male | Female |
| Under 5 Years | 10 (6.6%) | 0 (0.0%) |
| 5 Years | 8 (100.0%) | 4 (100.0%) |
| 6 to 11 Years | 9 (60.0%) | 36 (92.3%) |
| 12 to 14 Years | 6 (46.2%) | 0 (0.0%) |
| 15 Years | 3 (42.9%) | 0 (0.0%) |
| 16 and 17 Years | 0 (0.0%) | 17 (77.3%) |
| 18 to 24 Years | 24 (11.7%) | 19 (13.9%) |
| 25 to 34 Years | 54 (100.0%) | 44 (46.8%) |
| 35 to 44 Years | 51 (77.3%) | 15 (53.6%) |
| 45 to 54 Years | 62 (47.7%) | 115 (64.6%) |
| 55 to 64 Years | 39 (42.9%) | 23 (45.1%) |
| 65 to 74 Years | 40 (74.1%) | 46 (82.1%) |
| 75 Years and over | 11 (100.0%) | 25 (49.0%) |
| Total | 317 (38.9%) | 344 (52.1%) |
Income Below Poverty Among Married-Couple Families in Arnaudville
The poverty statistics for married-couple families in Arnaudville show that 13.3% or 16 of the total 120 families live below the poverty line. Families with 3 or 4 children have the highest poverty rate of 100.0%, comprising of 2 families. On the other hand, families with 1 or 2 children have the lowest poverty rate of 0.0%, which includes 0 families.
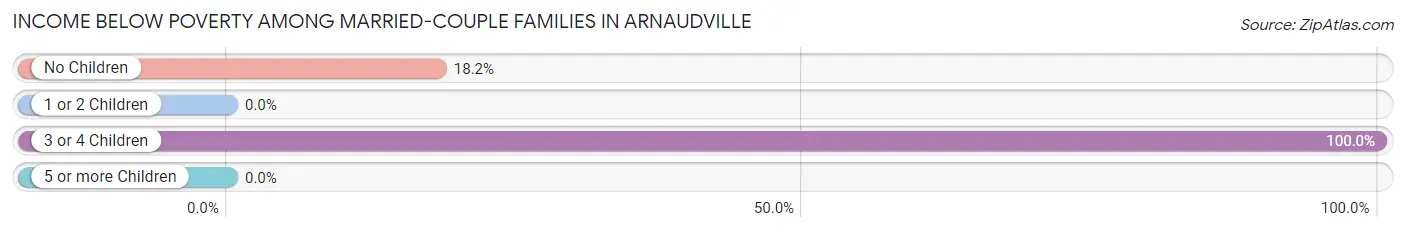
| Children | Above Poverty | Below Poverty |
| No Children | 63 (81.8%) | 14 (18.2%) |
| 1 or 2 Children | 41 (100.0%) | 0 (0.0%) |
| 3 or 4 Children | 0 (0.0%) | 2 (100.0%) |
| 5 or more Children | 0 (0.0%) | 0 (0.0%) |
| Total | 104 (86.7%) | 16 (13.3%) |
Income Below Poverty Among Single-Parent Households in Arnaudville
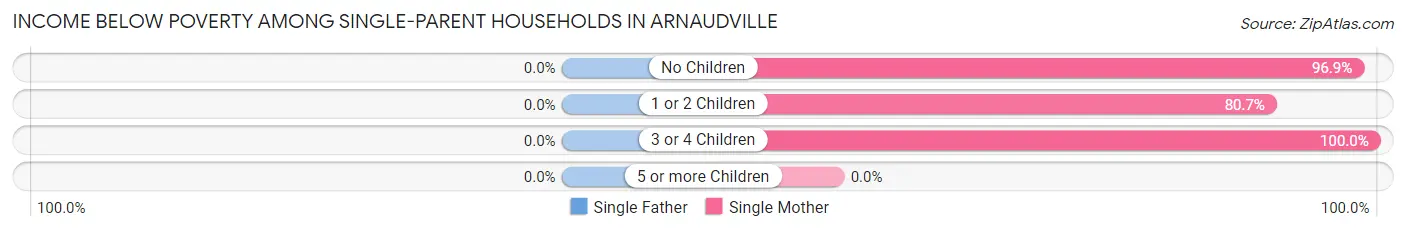
| Children | Single Father | Single Mother |
| No Children | 0 (0.0%) | 63 (96.9%) |
| 1 or 2 Children | 0 (0.0%) | 125 (80.6%) |
| 3 or 4 Children | 0 (0.0%) | 3 (100.0%) |
| 5 or more Children | 0 (0.0%) | 0 (0.0%) |
| Total | 0 (0.0%) | 191 (85.7%) |
Income Below Poverty Among Married-Couple vs Single-Parent Households in Arnaudville
The poverty data for Arnaudville shows that 16 of the married-couple family households (13.3%) and 191 of the single-parent households (74.6%) are living below the poverty level. Within the married-couple family households, those with 3 or 4 children have the highest poverty rate, with 2 households (100.0%) falling below the poverty line. Among the single-parent households, those with 3 or 4 children have the highest poverty rate, with 3 household (100.0%) living below poverty.
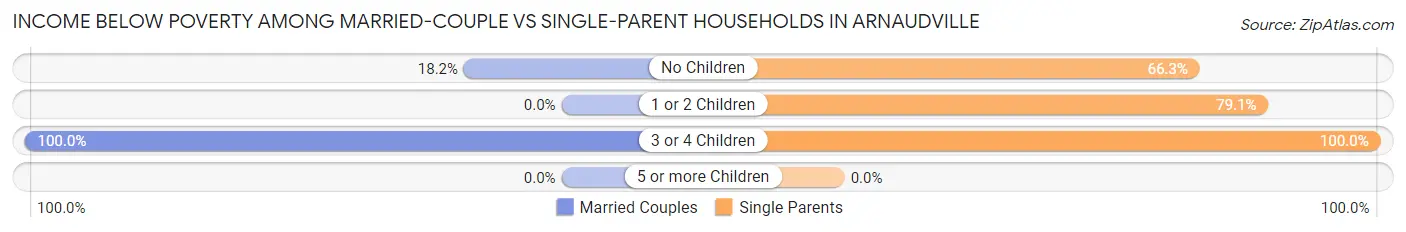
| Children | Married-Couple Families | Single-Parent Households |
| No Children | 14 (18.2%) | 63 (66.3%) |
| 1 or 2 Children | 0 (0.0%) | 125 (79.1%) |
| 3 or 4 Children | 2 (100.0%) | 3 (100.0%) |
| 5 or more Children | 0 (0.0%) | 0 (0.0%) |
| Total | 16 (13.3%) | 191 (74.6%) |
Employment Characteristics in Arnaudville
Employment by Class of Employer in Arnaudville
Among the 547 employed individuals in Arnaudville, private company employees (344 | 62.9%), self-employed (not incorporated) (95 | 17.4%), and local government employees (40 | 7.3%) make up the most common classes of employment.
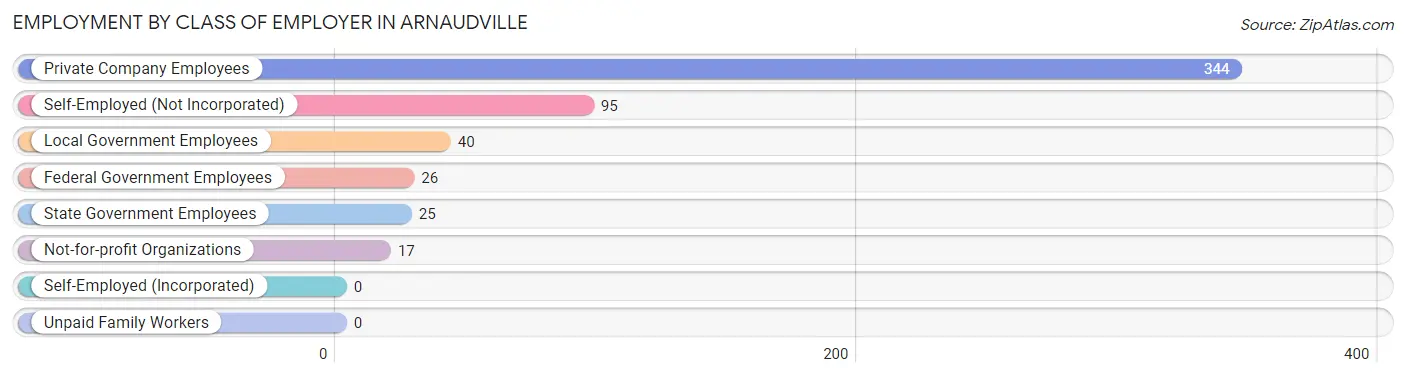
| Employer Class | # Employees | % Employees |
| Private Company Employees | 344 | 62.9% |
| Self-Employed (Incorporated) | 0 | 0.0% |
| Self-Employed (Not Incorporated) | 95 | 17.4% |
| Not-for-profit Organizations | 17 | 3.1% |
| Local Government Employees | 40 | 7.3% |
| State Government Employees | 25 | 4.6% |
| Federal Government Employees | 26 | 4.8% |
| Unpaid Family Workers | 0 | 0.0% |
| Total | 547 | 100.0% |
Employment Status by Age in Arnaudville
According to the labor force statistics for Arnaudville, out of the total population over 16 years of age (1,236), 48.5% or 599 individuals are in the labor force, with 7.0% or 42 of them unemployed. The age group with the highest labor force participation rate is 30 to 34 years, with 100.0% or 28 individuals in the labor force. Within the labor force, the 60 to 64 years age range has the highest percentage of unemployed individuals, with 34.8% or 8 of them being unemployed.
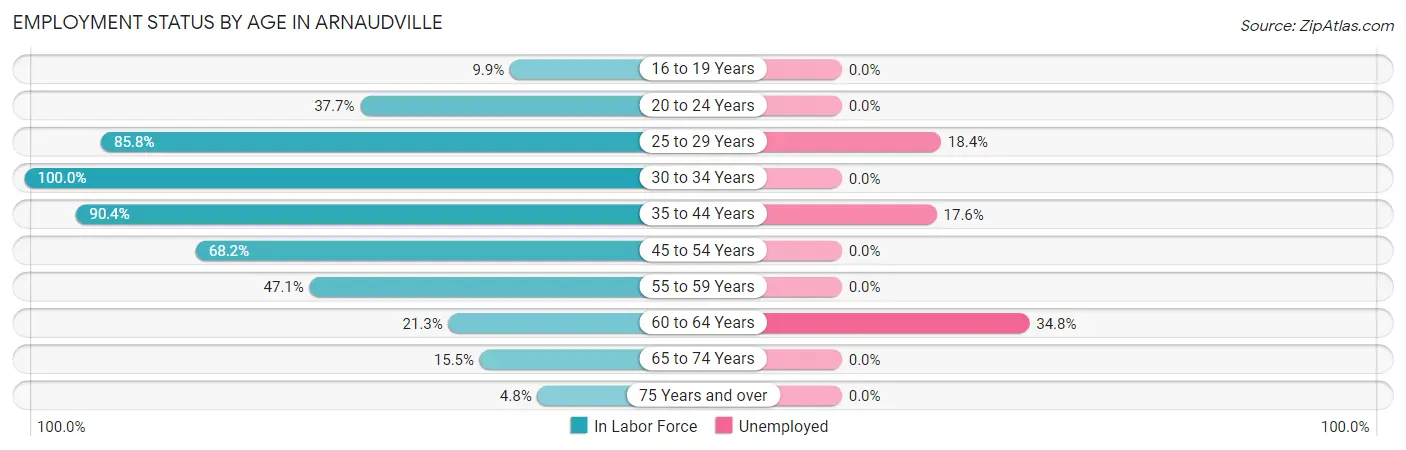
| Age Bracket | In Labor Force | Unemployed |
| 16 to 19 Years | 9 (9.9%) | 0 (0.0%) |
| 20 to 24 Years | 106 (37.7%) | 0 (0.0%) |
| 25 to 29 Years | 103 (85.8%) | 19 (18.4%) |
| 30 to 34 Years | 28 (100.0%) | 0 (0.0%) |
| 35 to 44 Years | 85 (90.4%) | 15 (17.6%) |
| 45 to 54 Years | 210 (68.2%) | 0 (0.0%) |
| 55 to 59 Years | 16 (47.1%) | 0 (0.0%) |
| 60 to 64 Years | 23 (21.3%) | 8 (34.8%) |
| 65 to 74 Years | 17 (15.5%) | 0 (0.0%) |
| 75 Years and over | 3 (4.8%) | 0 (0.0%) |
| Total | 599 (48.5%) | 42 (7.0%) |
Employment Status by Educational Attainment in Arnaudville
According to labor force statistics for Arnaudville, 67.2% of individuals (465) out of the total population between 25 and 64 years of age (692) are in the labor force, with 9.0% or 42 of them being unemployed. The group with the highest labor force participation rate are those with the educational attainment of bachelor's degree or higher, with 100.0% or 34 individuals in the labor force. Within the labor force, individuals with high school diploma education have the highest percentage of unemployment, with 15.4% or 34 of them being unemployed.
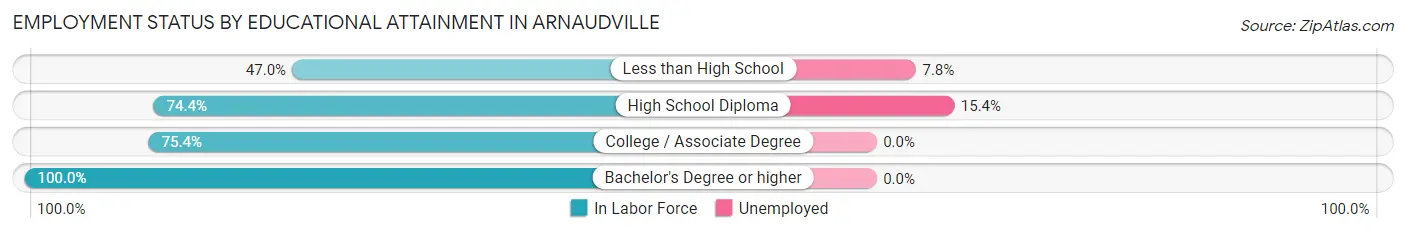
| Educational Attainment | In Labor Force | Unemployed |
| Less than High School | 103 (47.0%) | 17 (7.8%) |
| High School Diploma | 221 (74.4%) | 46 (15.4%) |
| College / Associate Degree | 107 (75.4%) | 0 (0.0%) |
| Bachelor's Degree or higher | 34 (100.0%) | 0 (0.0%) |
| Total | 465 (67.2%) | 62 (9.0%) |
Employment Occupations by Sex in Arnaudville
Management, Business, Science and Arts Occupations
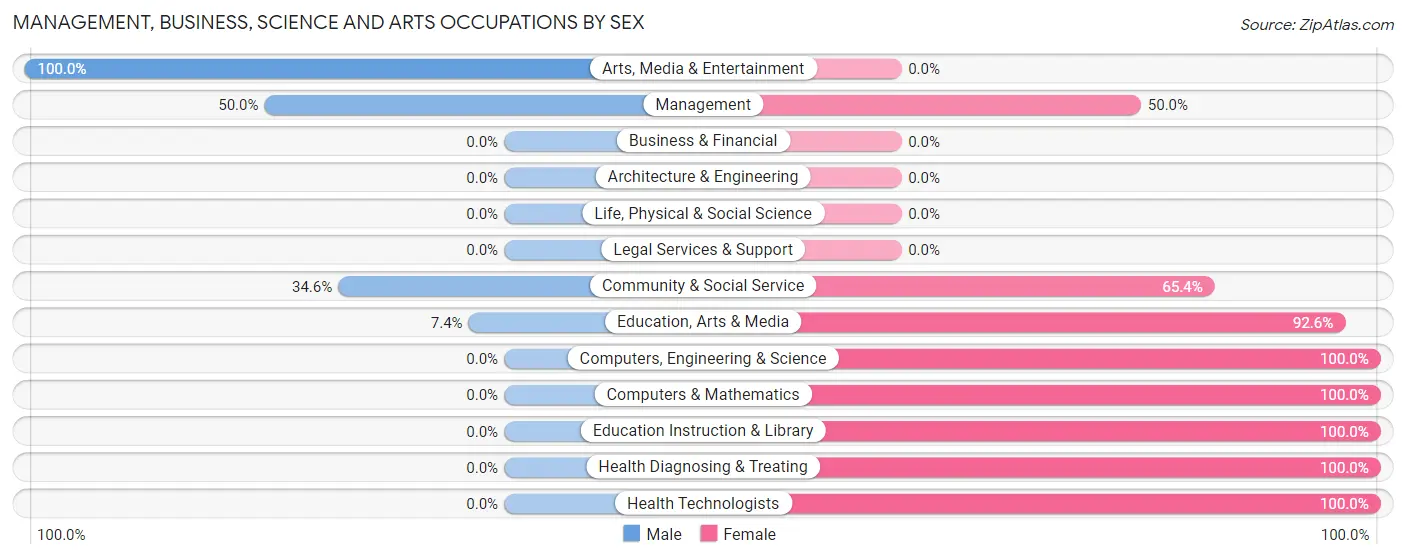
The most common Management, Business, Science and Arts occupations in Arnaudville are Community & Social Service (78 | 14.0%), Management (30 | 5.4%), Education, Arts & Media (27 | 4.8%), Education Instruction & Library (26 | 4.7%), and Arts, Media & Entertainment (25 | 4.5%).

Management, Business, Science and Arts Occupations by Sex
Within the Management, Business, Science and Arts occupations in Arnaudville, the most male-oriented occupations are Arts, Media & Entertainment (100.0%), Management (50.0%), and Community & Social Service (34.6%), while the most female-oriented occupations are Computers, Engineering & Science (100.0%), Computers & Mathematics (100.0%), and Education Instruction & Library (100.0%).
| Occupation | Male | Female |
| Management | 15 (50.0%) | 15 (50.0%) |
| Business & Financial | 0 (0.0%) | 0 (0.0%) |
| Computers, Engineering & Science | 0 (0.0%) | 4 (100.0%) |
| Computers & Mathematics | 0 (0.0%) | 4 (100.0%) |
| Architecture & Engineering | 0 (0.0%) | 0 (0.0%) |
| Life, Physical & Social Science | 0 (0.0%) | 0 (0.0%) |
| Community & Social Service | 27 (34.6%) | 51 (65.4%) |
| Education, Arts & Media | 2 (7.4%) | 25 (92.6%) |
| Legal Services & Support | 0 (0.0%) | 0 (0.0%) |
| Education Instruction & Library | 0 (0.0%) | 26 (100.0%) |
| Arts, Media & Entertainment | 25 (100.0%) | 0 (0.0%) |
| Health Diagnosing & Treating | 0 (0.0%) | 5 (100.0%) |
| Health Technologists | 0 (0.0%) | 5 (100.0%) |
| Total (Category) | 42 (35.9%) | 75 (64.1%) |
| Total (Overall) | 191 (34.2%) | 367 (65.8%) |
Services Occupations
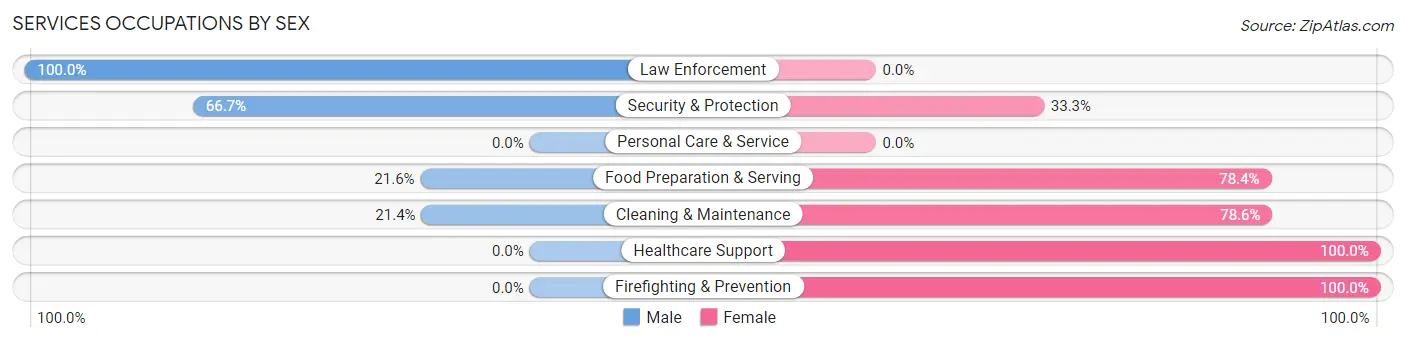
The most common Services occupations in Arnaudville are Food Preparation & Serving (37 | 6.6%), Healthcare Support (25 | 4.5%), Cleaning & Maintenance (14 | 2.5%), Security & Protection (9 | 1.6%), and Law Enforcement (6 | 1.1%).

Services Occupations by Sex
Within the Services occupations in Arnaudville, the most male-oriented occupations are Law Enforcement (100.0%), Security & Protection (66.7%), and Food Preparation & Serving (21.6%), while the most female-oriented occupations are Healthcare Support (100.0%), Firefighting & Prevention (100.0%), and Cleaning & Maintenance (78.6%).
| Occupation | Male | Female |
| Healthcare Support | 0 (0.0%) | 25 (100.0%) |
| Security & Protection | 6 (66.7%) | 3 (33.3%) |
| Firefighting & Prevention | 0 (0.0%) | 3 (100.0%) |
| Law Enforcement | 6 (100.0%) | 0 (0.0%) |
| Food Preparation & Serving | 8 (21.6%) | 29 (78.4%) |
| Cleaning & Maintenance | 3 (21.4%) | 11 (78.6%) |
| Personal Care & Service | 0 (0.0%) | 0 (0.0%) |
| Total (Category) | 17 (20.0%) | 68 (80.0%) |
| Total (Overall) | 191 (34.2%) | 367 (65.8%) |
Sales and Office Occupations
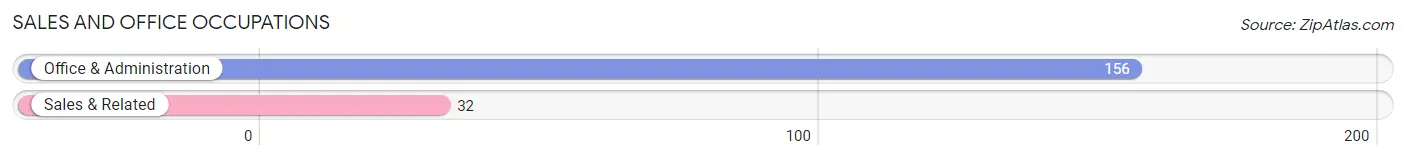
The most common Sales and Office occupations in Arnaudville are Office & Administration (156 | 28.0%), and Sales & Related (32 | 5.7%).
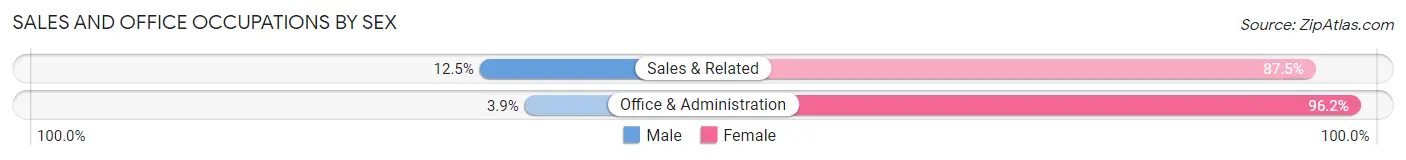
Sales and Office Occupations by Sex
| Occupation | Male | Female |
| Sales & Related | 4 (12.5%) | 28 (87.5%) |
| Office & Administration | 6 (3.8%) | 150 (96.2%) |
| Total (Category) | 10 (5.3%) | 178 (94.7%) |
| Total (Overall) | 191 (34.2%) | 367 (65.8%) |
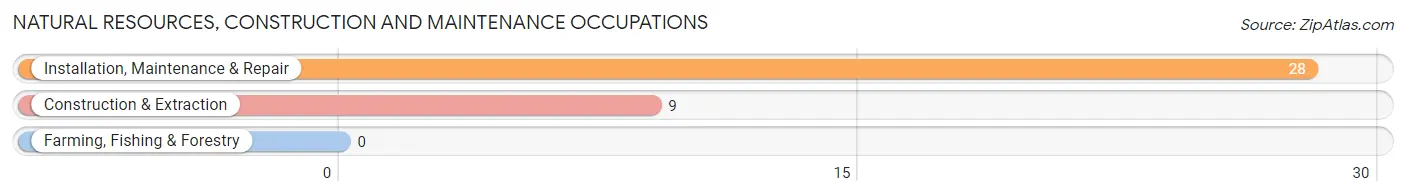
Natural Resources, Construction and Maintenance Occupations
The most common Natural Resources, Construction and Maintenance occupations in Arnaudville are Installation, Maintenance & Repair (28 | 5.0%), and Construction & Extraction (9 | 1.6%).
Natural Resources, Construction and Maintenance Occupations by Sex
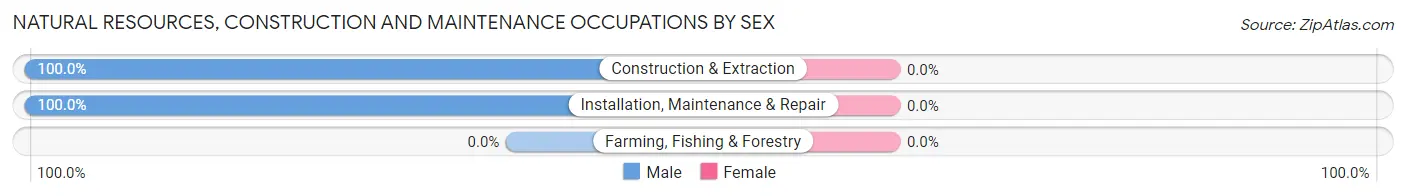
| Occupation | Male | Female |
| Farming, Fishing & Forestry | 0 (0.0%) | 0 (0.0%) |
| Construction & Extraction | 9 (100.0%) | 0 (0.0%) |
| Installation, Maintenance & Repair | 28 (100.0%) | 0 (0.0%) |
| Total (Category) | 37 (100.0%) | 0 (0.0%) |
| Total (Overall) | 191 (34.2%) | 367 (65.8%) |
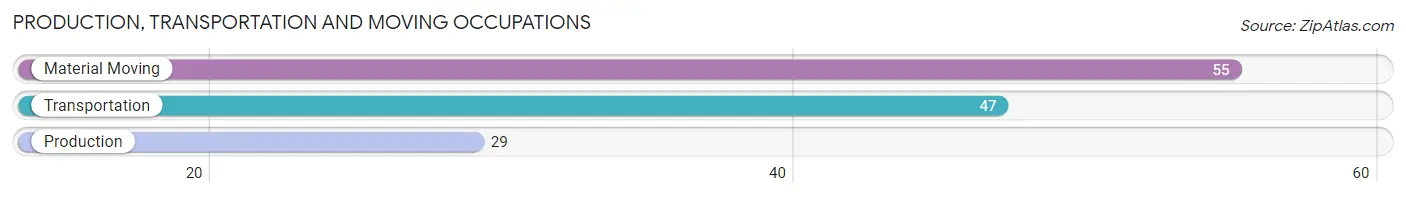
Production, Transportation and Moving Occupations
The most common Production, Transportation and Moving occupations in Arnaudville are Material Moving (55 | 9.9%), Transportation (47 | 8.4%), and Production (29 | 5.2%).
Production, Transportation and Moving Occupations by Sex
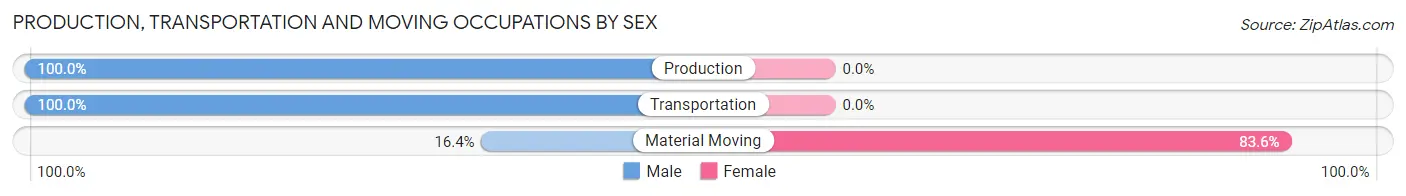
| Occupation | Male | Female |
| Production | 29 (100.0%) | 0 (0.0%) |
| Transportation | 47 (100.0%) | 0 (0.0%) |
| Material Moving | 9 (16.4%) | 46 (83.6%) |
| Total (Category) | 85 (64.9%) | 46 (35.1%) |
| Total (Overall) | 191 (34.2%) | 367 (65.8%) |
Employment Industries by Sex in Arnaudville
Employment Industries in Arnaudville
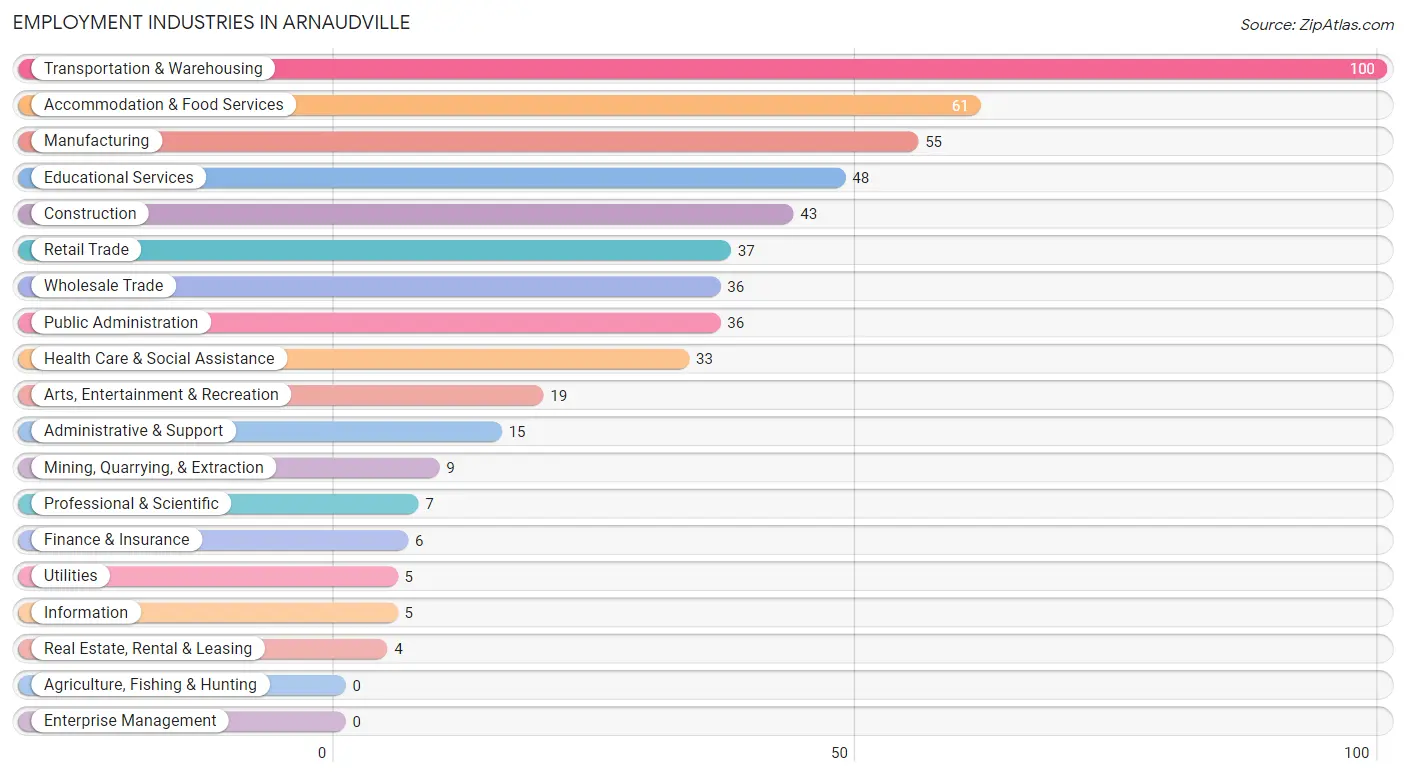
The major employment industries in Arnaudville include Transportation & Warehousing (100 | 17.9%), Accommodation & Food Services (61 | 10.9%), Manufacturing (55 | 9.9%), Educational Services (48 | 8.6%), and Construction (43 | 7.7%).
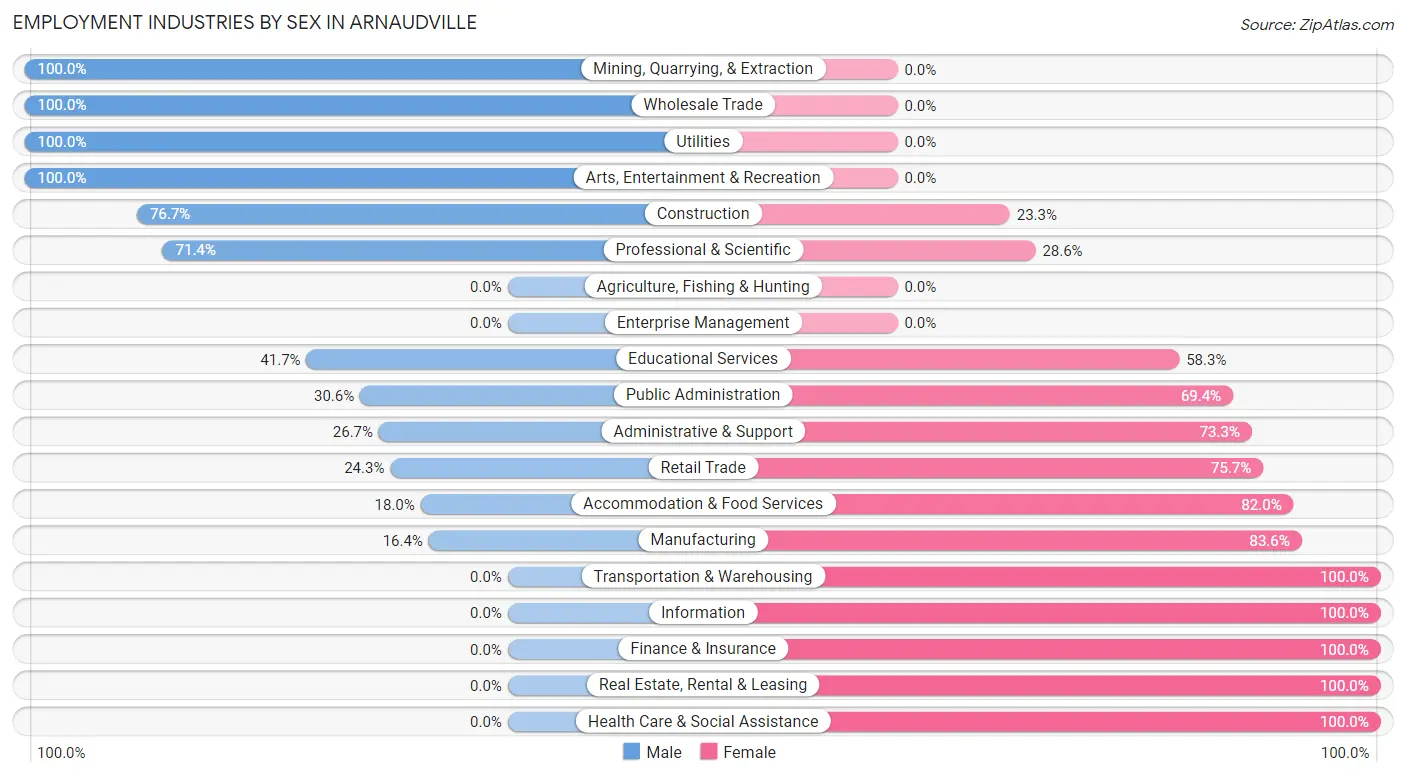
Employment Industries by Sex in Arnaudville
The Arnaudville industries that see more men than women are Mining, Quarrying, & Extraction (100.0%), Wholesale Trade (100.0%), and Utilities (100.0%), whereas the industries that tend to have a higher number of women are Transportation & Warehousing (100.0%), Information (100.0%), and Finance & Insurance (100.0%).
| Industry | Male | Female |
| Agriculture, Fishing & Hunting | 0 (0.0%) | 0 (0.0%) |
| Mining, Quarrying, & Extraction | 9 (100.0%) | 0 (0.0%) |
| Construction | 33 (76.7%) | 10 (23.3%) |
| Manufacturing | 9 (16.4%) | 46 (83.6%) |
| Wholesale Trade | 36 (100.0%) | 0 (0.0%) |
| Retail Trade | 9 (24.3%) | 28 (75.7%) |
| Transportation & Warehousing | 0 (0.0%) | 100 (100.0%) |
| Utilities | 5 (100.0%) | 0 (0.0%) |
| Information | 0 (0.0%) | 5 (100.0%) |
| Finance & Insurance | 0 (0.0%) | 6 (100.0%) |
| Real Estate, Rental & Leasing | 0 (0.0%) | 4 (100.0%) |
| Professional & Scientific | 5 (71.4%) | 2 (28.6%) |
| Enterprise Management | 0 (0.0%) | 0 (0.0%) |
| Administrative & Support | 4 (26.7%) | 11 (73.3%) |
| Educational Services | 20 (41.7%) | 28 (58.3%) |
| Health Care & Social Assistance | 0 (0.0%) | 33 (100.0%) |
| Arts, Entertainment & Recreation | 19 (100.0%) | 0 (0.0%) |
| Accommodation & Food Services | 11 (18.0%) | 50 (82.0%) |
| Public Administration | 11 (30.6%) | 25 (69.4%) |
| Total | 191 (34.2%) | 367 (65.8%) |
Education in Arnaudville
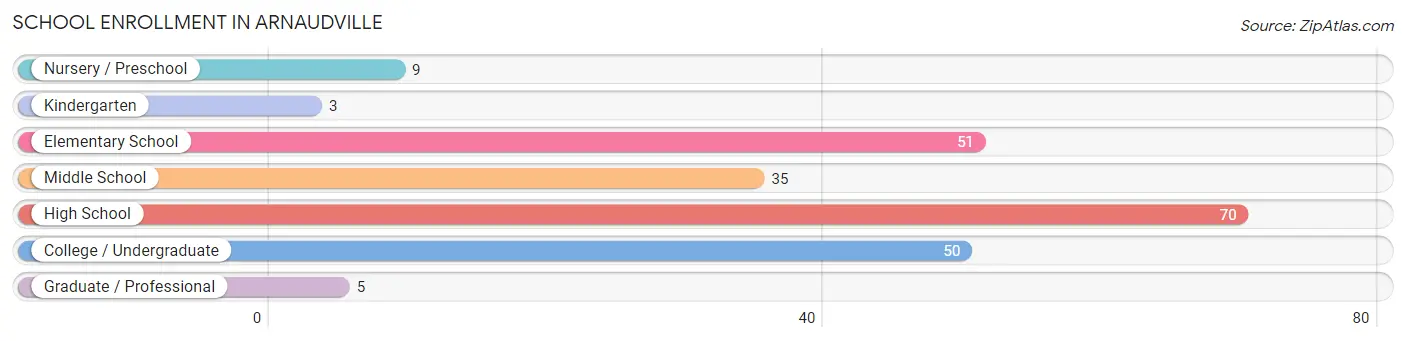
School Enrollment in Arnaudville
The most common levels of schooling among the 223 students in Arnaudville are high school (70 | 31.4%), elementary school (51 | 22.9%), and college / undergraduate (50 | 22.4%).
| School Level | # Students | % Students |
| Nursery / Preschool | 9 | 4.0% |
| Kindergarten | 3 | 1.3% |
| Elementary School | 51 | 22.9% |
| Middle School | 35 | 15.7% |
| High School | 70 | 31.4% |
| College / Undergraduate | 50 | 22.4% |
| Graduate / Professional | 5 | 2.2% |
| Total | 223 | 100.0% |
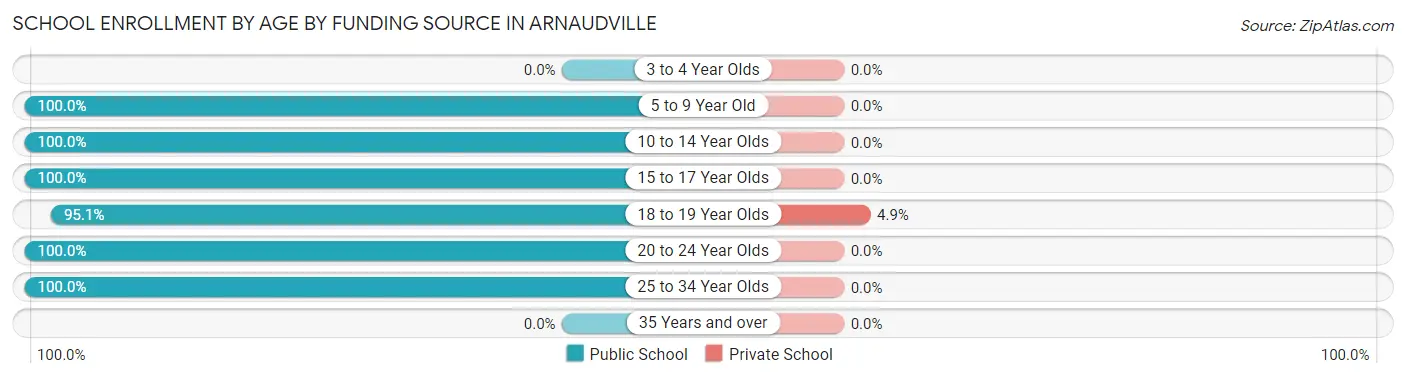
School Enrollment by Age by Funding Source in Arnaudville
Out of a total of 223 students who are enrolled in schools in Arnaudville, 3 (1.3%) attend a private institution, while the remaining 220 (98.7%) are enrolled in public schools. The age group of 18 to 19 year olds has the highest likelihood of being enrolled in private schools, with 3 (4.9% in the age bracket) enrolled. Conversely, the age group of 5 to 9 year old has the lowest likelihood of being enrolled in a private school, with 63 (100.0% in the age bracket) attending a public institution.
| Age Bracket | Public School | Private School |
| 3 to 4 Year Olds | 0 (0.0%) | 0 (0.0%) |
| 5 to 9 Year Old | 63 (100.0%) | 0 (0.0%) |
| 10 to 14 Year Olds | 31 (100.0%) | 0 (0.0%) |
| 15 to 17 Year Olds | 31 (100.0%) | 0 (0.0%) |
| 18 to 19 Year Olds | 58 (95.1%) | 3 (4.9%) |
| 20 to 24 Year Olds | 15 (100.0%) | 0 (0.0%) |
| 25 to 34 Year Olds | 22 (100.0%) | 0 (0.0%) |
| 35 Years and over | 0 (0.0%) | 0 (0.0%) |
| Total | 220 (98.7%) | 3 (1.3%) |
Educational Attainment by Field of Study in Arnaudville
Business (19 | 41.3%), liberal arts & history (11 | 23.9%), computers & mathematics (5 | 10.9%), education (4 | 8.7%), and arts & humanities (3 | 6.5%) are the most common fields of study among 46 individuals in Arnaudville who have obtained a bachelor's degree or higher.
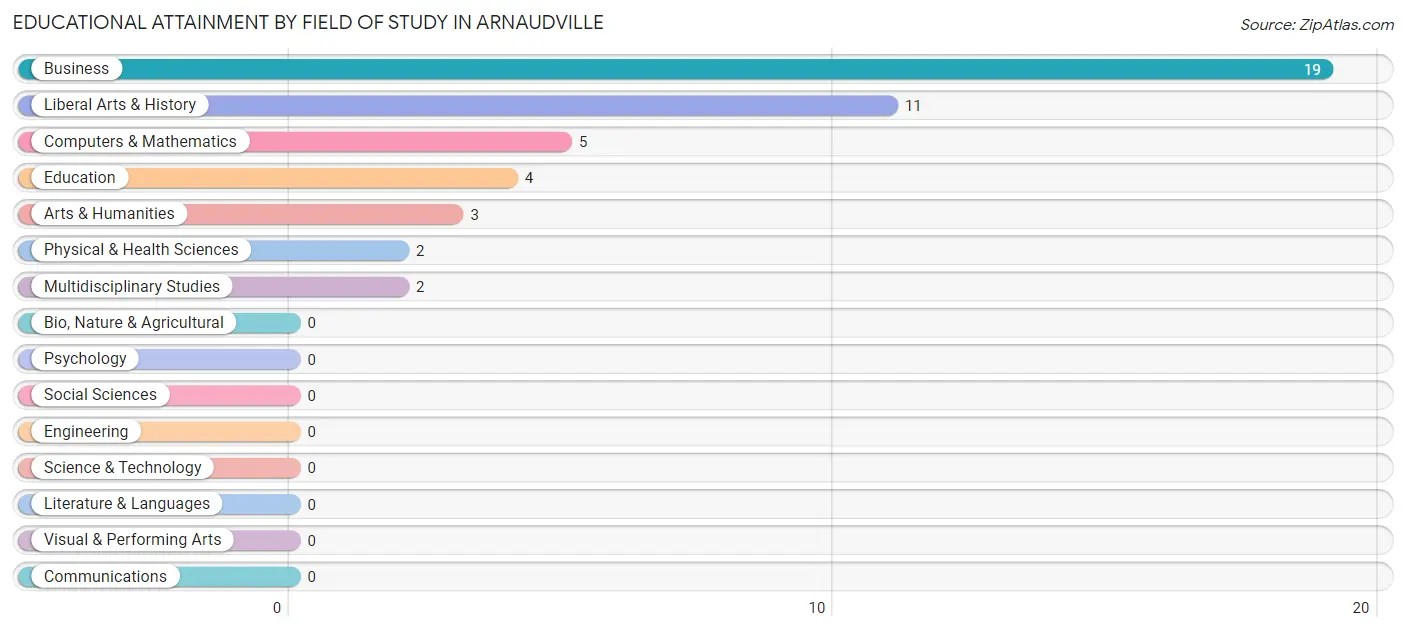
| Field of Study | # Graduates | % Graduates |
| Computers & Mathematics | 5 | 10.9% |
| Bio, Nature & Agricultural | 0 | 0.0% |
| Physical & Health Sciences | 2 | 4.3% |
| Psychology | 0 | 0.0% |
| Social Sciences | 0 | 0.0% |
| Engineering | 0 | 0.0% |
| Multidisciplinary Studies | 2 | 4.3% |
| Science & Technology | 0 | 0.0% |
| Business | 19 | 41.3% |
| Education | 4 | 8.7% |
| Literature & Languages | 0 | 0.0% |
| Liberal Arts & History | 11 | 23.9% |
| Visual & Performing Arts | 0 | 0.0% |
| Communications | 0 | 0.0% |
| Arts & Humanities | 3 | 6.5% |
| Total | 46 | 100.0% |
Transportation & Commute in Arnaudville
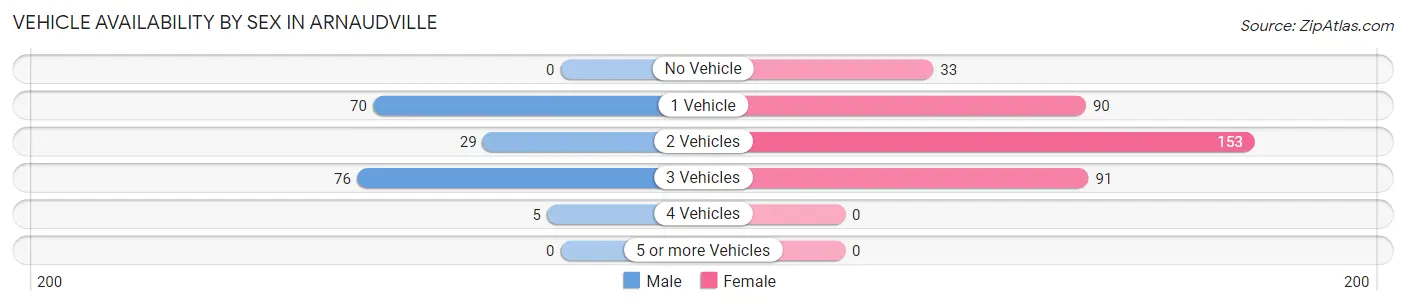
Vehicle Availability by Sex in Arnaudville
The most prevalent vehicle ownership categories in Arnaudville are males with 3 vehicles (76, accounting for 42.2%) and females with 3 vehicles (91, making up 20.7%).
| Vehicles Available | Male | Female |
| No Vehicle | 0 (0.0%) | 33 (9.0%) |
| 1 Vehicle | 70 (38.9%) | 90 (24.5%) |
| 2 Vehicles | 29 (16.1%) | 153 (41.7%) |
| 3 Vehicles | 76 (42.2%) | 91 (24.8%) |
| 4 Vehicles | 5 (2.8%) | 0 (0.0%) |
| 5 or more Vehicles | 0 (0.0%) | 0 (0.0%) |
| Total | 180 (100.0%) | 367 (100.0%) |
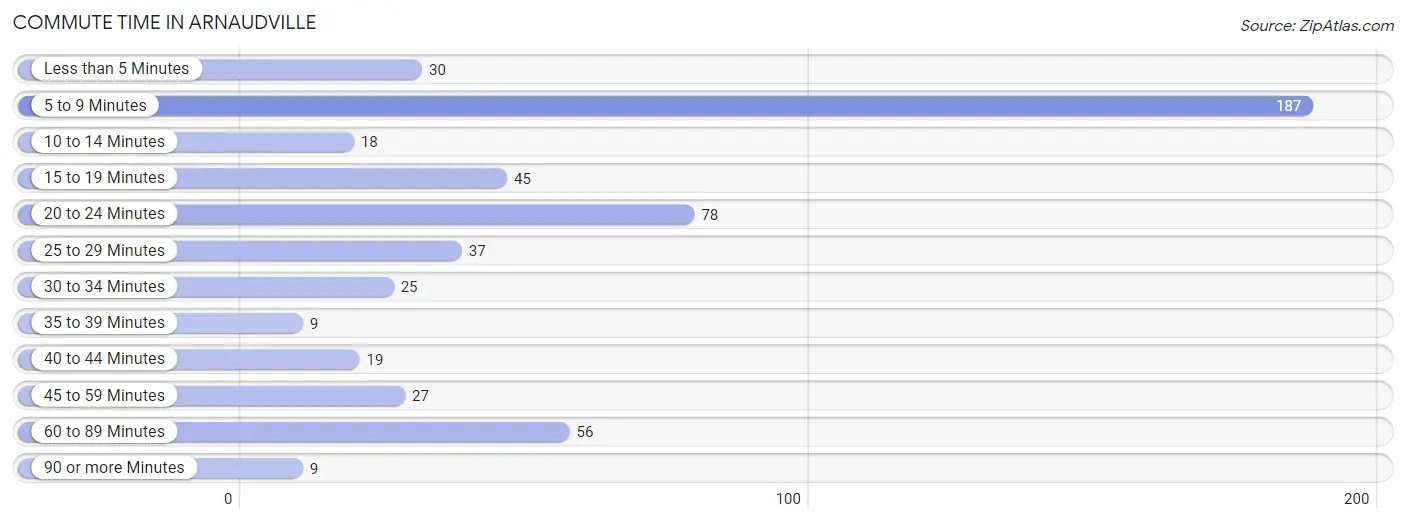
Commute Time in Arnaudville
The most frequently occuring commute durations in Arnaudville are 5 to 9 minutes (187 commuters, 34.6%), 20 to 24 minutes (78 commuters, 14.4%), and 60 to 89 minutes (56 commuters, 10.4%).
| Commute Time | # Commuters | % Commuters |
| Less than 5 Minutes | 30 | 5.6% |
| 5 to 9 Minutes | 187 | 34.6% |
| 10 to 14 Minutes | 18 | 3.3% |
| 15 to 19 Minutes | 45 | 8.3% |
| 20 to 24 Minutes | 78 | 14.4% |
| 25 to 29 Minutes | 37 | 6.9% |
| 30 to 34 Minutes | 25 | 4.6% |
| 35 to 39 Minutes | 9 | 1.7% |
| 40 to 44 Minutes | 19 | 3.5% |
| 45 to 59 Minutes | 27 | 5.0% |
| 60 to 89 Minutes | 56 | 10.4% |
| 90 or more Minutes | 9 | 1.7% |
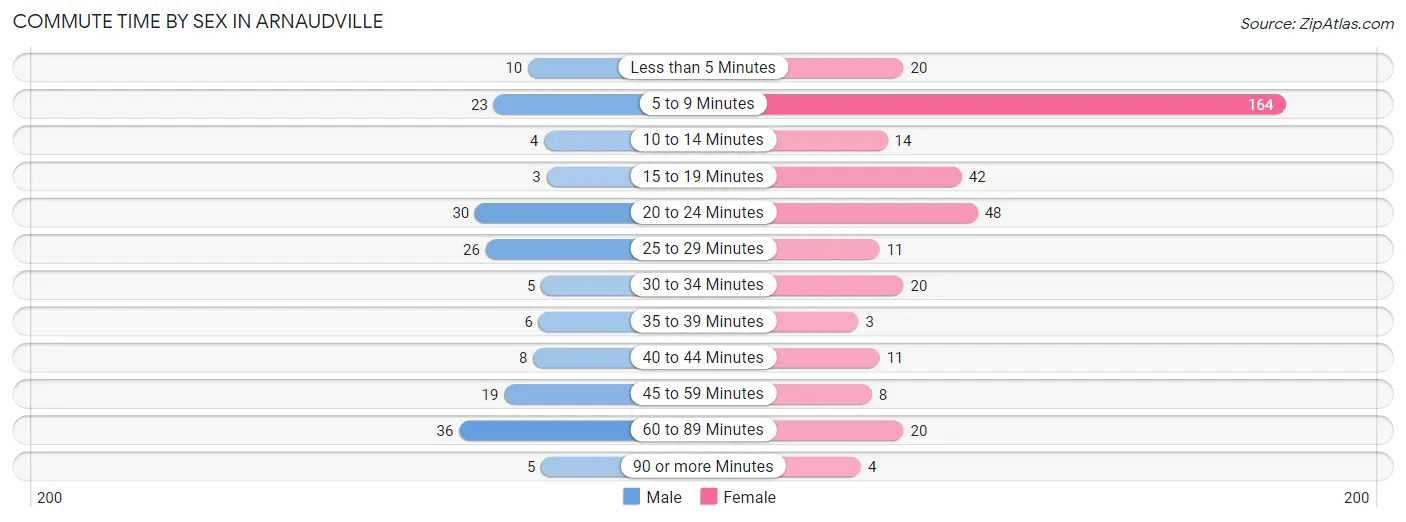
Commute Time by Sex in Arnaudville
The most common commute times in Arnaudville are 60 to 89 minutes (36 commuters, 20.6%) for males and 5 to 9 minutes (164 commuters, 44.9%) for females.
| Commute Time | Male | Female |
| Less than 5 Minutes | 10 (5.7%) | 20 (5.5%) |
| 5 to 9 Minutes | 23 (13.1%) | 164 (44.9%) |
| 10 to 14 Minutes | 4 (2.3%) | 14 (3.8%) |
| 15 to 19 Minutes | 3 (1.7%) | 42 (11.5%) |
| 20 to 24 Minutes | 30 (17.1%) | 48 (13.2%) |
| 25 to 29 Minutes | 26 (14.9%) | 11 (3.0%) |
| 30 to 34 Minutes | 5 (2.9%) | 20 (5.5%) |
| 35 to 39 Minutes | 6 (3.4%) | 3 (0.8%) |
| 40 to 44 Minutes | 8 (4.6%) | 11 (3.0%) |
| 45 to 59 Minutes | 19 (10.9%) | 8 (2.2%) |
| 60 to 89 Minutes | 36 (20.6%) | 20 (5.5%) |
| 90 or more Minutes | 5 (2.9%) | 4 (1.1%) |
Time of Departure to Work by Sex in Arnaudville
The most frequent times of departure to work in Arnaudville are 5:30 AM to 5:59 AM (38, 21.7%) for males and 5:00 AM to 5:29 AM (80, 21.9%) for females.
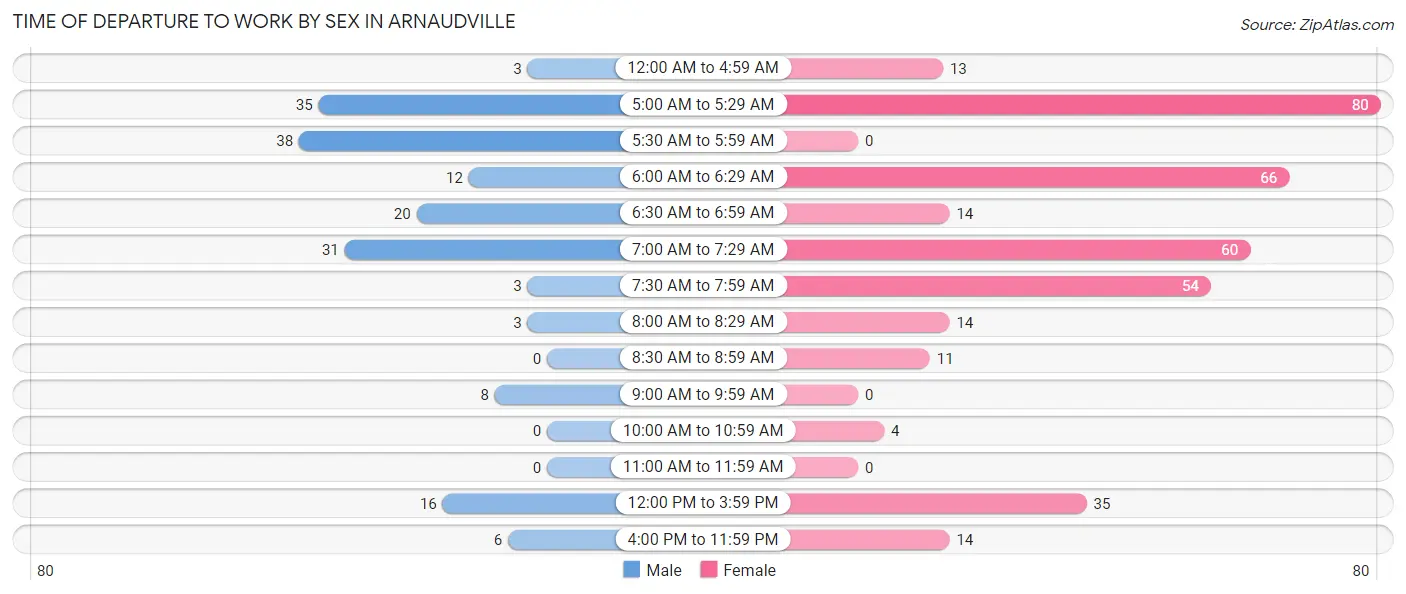
| Time of Departure | Male | Female |
| 12:00 AM to 4:59 AM | 3 (1.7%) | 13 (3.6%) |
| 5:00 AM to 5:29 AM | 35 (20.0%) | 80 (21.9%) |
| 5:30 AM to 5:59 AM | 38 (21.7%) | 0 (0.0%) |
| 6:00 AM to 6:29 AM | 12 (6.9%) | 66 (18.1%) |
| 6:30 AM to 6:59 AM | 20 (11.4%) | 14 (3.8%) |
| 7:00 AM to 7:29 AM | 31 (17.7%) | 60 (16.4%) |
| 7:30 AM to 7:59 AM | 3 (1.7%) | 54 (14.8%) |
| 8:00 AM to 8:29 AM | 3 (1.7%) | 14 (3.8%) |
| 8:30 AM to 8:59 AM | 0 (0.0%) | 11 (3.0%) |
| 9:00 AM to 9:59 AM | 8 (4.6%) | 0 (0.0%) |
| 10:00 AM to 10:59 AM | 0 (0.0%) | 4 (1.1%) |
| 11:00 AM to 11:59 AM | 0 (0.0%) | 0 (0.0%) |
| 12:00 PM to 3:59 PM | 16 (9.1%) | 35 (9.6%) |
| 4:00 PM to 11:59 PM | 6 (3.4%) | 14 (3.8%) |
| Total | 175 (100.0%) | 365 (100.0%) |
Housing Occupancy in Arnaudville
Occupancy by Ownership in Arnaudville
Of the total 647 dwellings in Arnaudville, owner-occupied units account for 370 (57.2%), while renter-occupied units make up 277 (42.8%).
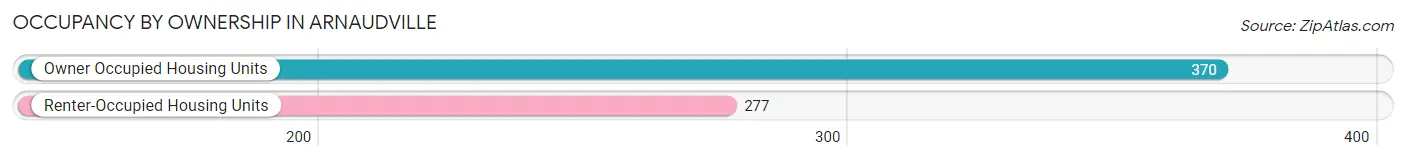
| Occupancy | # Housing Units | % Housing Units |
| Owner Occupied Housing Units | 370 | 57.2% |
| Renter-Occupied Housing Units | 277 | 42.8% |
| Total Occupied Housing Units | 647 | 100.0% |
Occupancy by Household Size in Arnaudville
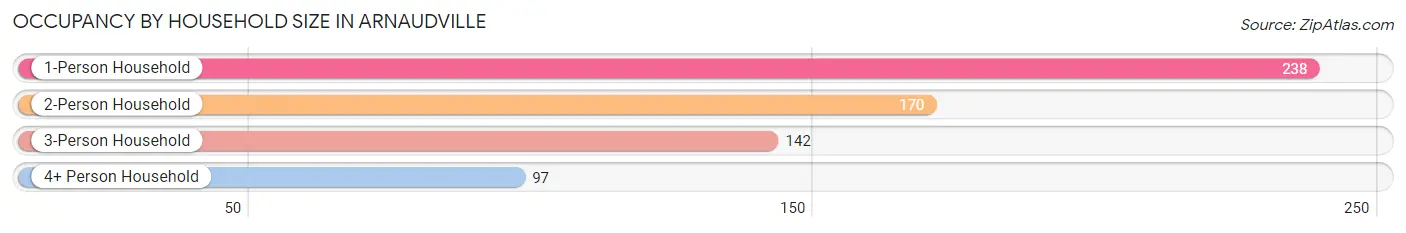
| Household Size | # Housing Units | % Housing Units |
| 1-Person Household | 238 | 36.8% |
| 2-Person Household | 170 | 26.3% |
| 3-Person Household | 142 | 22.0% |
| 4+ Person Household | 97 | 15.0% |
| Total Housing Units | 647 | 100.0% |
Occupancy by Ownership by Household Size in Arnaudville
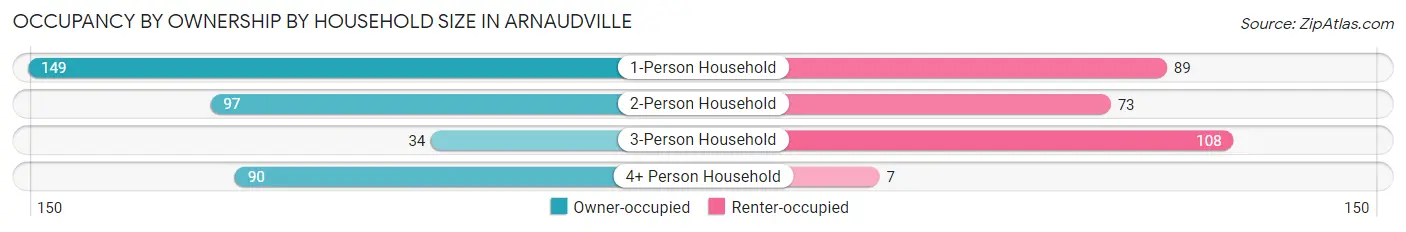
| Household Size | Owner-occupied | Renter-occupied |
| 1-Person Household | 149 (62.6%) | 89 (37.4%) |
| 2-Person Household | 97 (57.1%) | 73 (42.9%) |
| 3-Person Household | 34 (23.9%) | 108 (76.1%) |
| 4+ Person Household | 90 (92.8%) | 7 (7.2%) |
| Total Housing Units | 370 (57.2%) | 277 (42.8%) |
Occupancy by Educational Attainment in Arnaudville
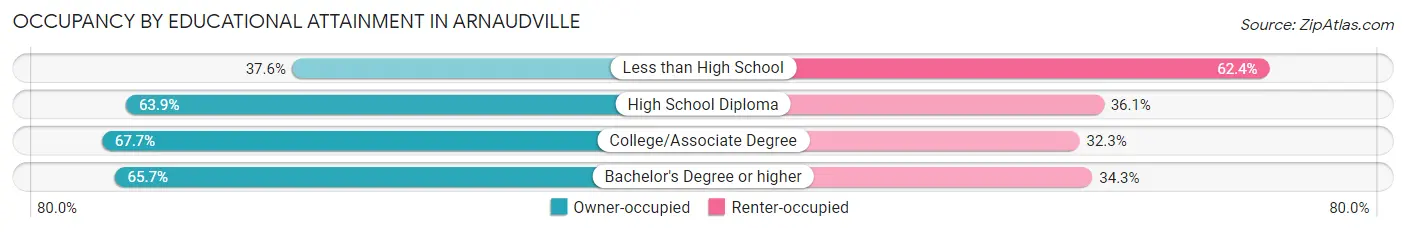
| Household Size | Owner-occupied | Renter-occupied |
| Less than High School | 70 (37.6%) | 116 (62.4%) |
| High School Diploma | 193 (63.9%) | 109 (36.1%) |
| College/Associate Degree | 84 (67.7%) | 40 (32.3%) |
| Bachelor's Degree or higher | 23 (65.7%) | 12 (34.3%) |
Occupancy by Age of Householder in Arnaudville
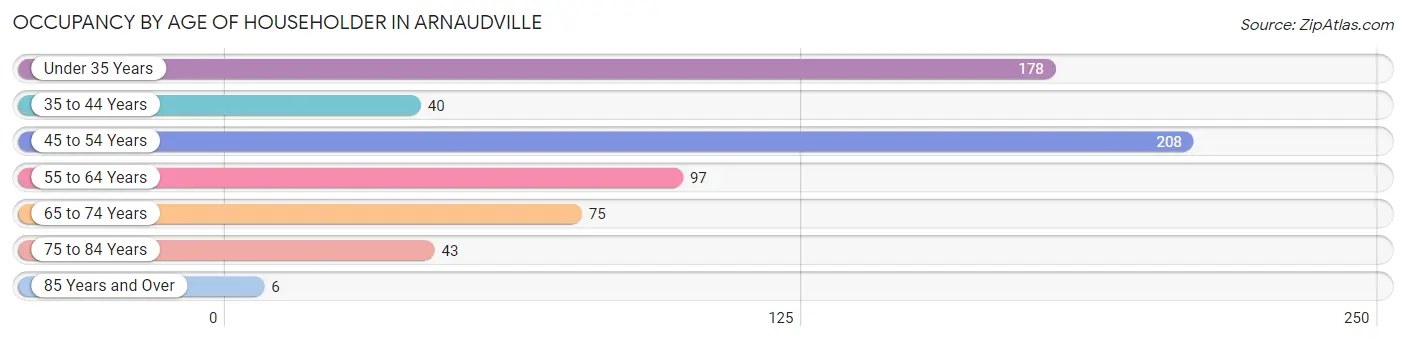
| Age Bracket | # Households | % Households |
| Under 35 Years | 178 | 27.5% |
| 35 to 44 Years | 40 | 6.2% |
| 45 to 54 Years | 208 | 32.2% |
| 55 to 64 Years | 97 | 15.0% |
| 65 to 74 Years | 75 | 11.6% |
| 75 to 84 Years | 43 | 6.7% |
| 85 Years and Over | 6 | 0.9% |
| Total | 647 | 100.0% |
Housing Finances in Arnaudville
Median Income by Occupancy in Arnaudville
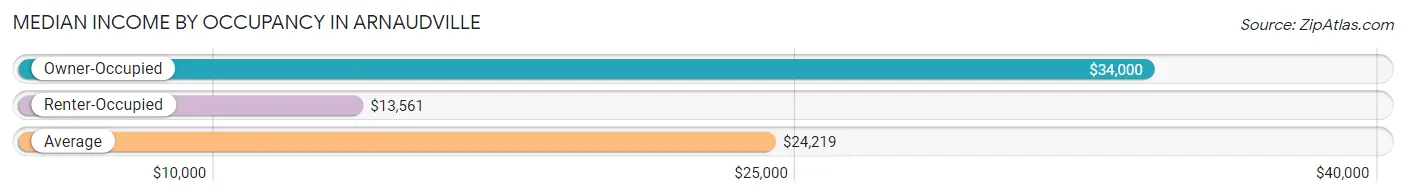
| Occupancy Type | # Households | Median Income |
| Owner-Occupied | 370 (57.2%) | $34,000 |
| Renter-Occupied | 277 (42.8%) | $13,561 |
| Average | 647 (100.0%) | $24,219 |
Occupancy by Householder Income Bracket in Arnaudville
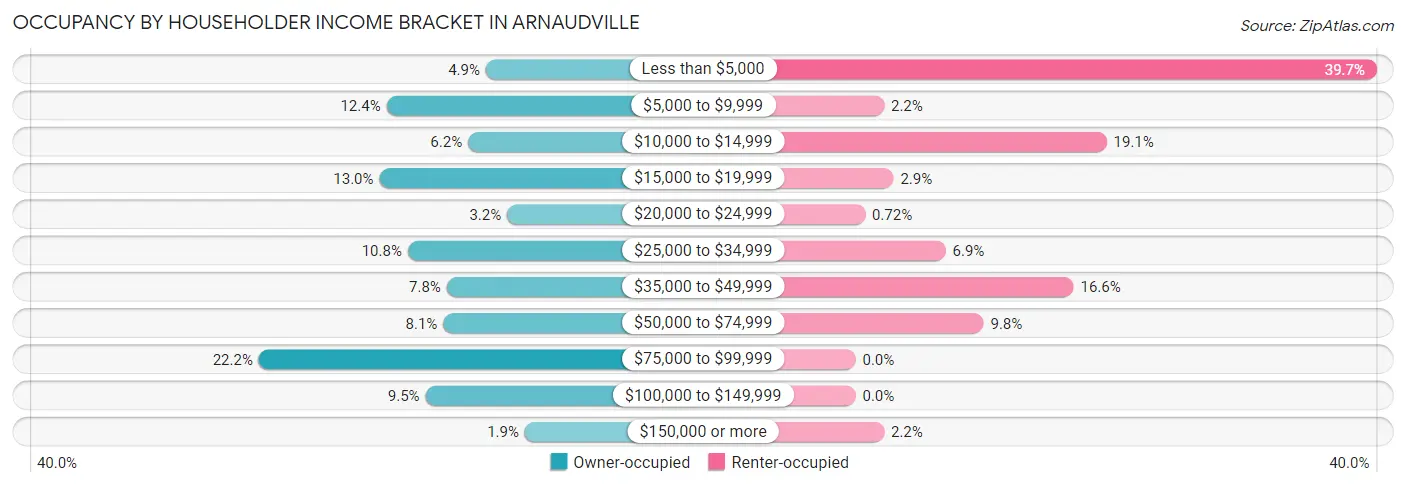
| Income Bracket | Owner-occupied | Renter-occupied |
| Less than $5,000 | 18 (4.9%) | 110 (39.7%) |
| $5,000 to $9,999 | 46 (12.4%) | 6 (2.2%) |
| $10,000 to $14,999 | 23 (6.2%) | 53 (19.1%) |
| $15,000 to $19,999 | 48 (13.0%) | 8 (2.9%) |
| $20,000 to $24,999 | 12 (3.2%) | 2 (0.7%) |
| $25,000 to $34,999 | 40 (10.8%) | 19 (6.9%) |
| $35,000 to $49,999 | 29 (7.8%) | 46 (16.6%) |
| $50,000 to $74,999 | 30 (8.1%) | 27 (9.8%) |
| $75,000 to $99,999 | 82 (22.2%) | 0 (0.0%) |
| $100,000 to $149,999 | 35 (9.5%) | 0 (0.0%) |
| $150,000 or more | 7 (1.9%) | 6 (2.2%) |
| Total | 370 (100.0%) | 277 (100.0%) |
Monthly Housing Cost Tiers in Arnaudville
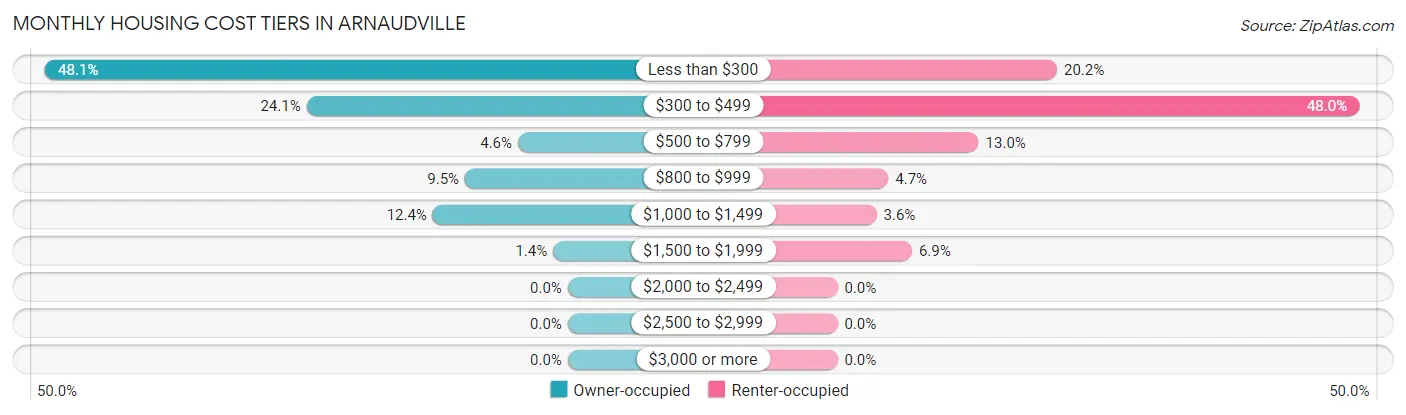
| Monthly Cost | Owner-occupied | Renter-occupied |
| Less than $300 | 178 (48.1%) | 56 (20.2%) |
| $300 to $499 | 89 (24.0%) | 133 (48.0%) |
| $500 to $799 | 17 (4.6%) | 36 (13.0%) |
| $800 to $999 | 35 (9.5%) | 13 (4.7%) |
| $1,000 to $1,499 | 46 (12.4%) | 10 (3.6%) |
| $1,500 to $1,999 | 5 (1.3%) | 19 (6.9%) |
| $2,000 to $2,499 | 0 (0.0%) | 0 (0.0%) |
| $2,500 to $2,999 | 0 (0.0%) | 0 (0.0%) |
| $3,000 or more | 0 (0.0%) | 0 (0.0%) |
| Total | 370 (100.0%) | 277 (100.0%) |
Physical Housing Characteristics in Arnaudville
Housing Structures in Arnaudville
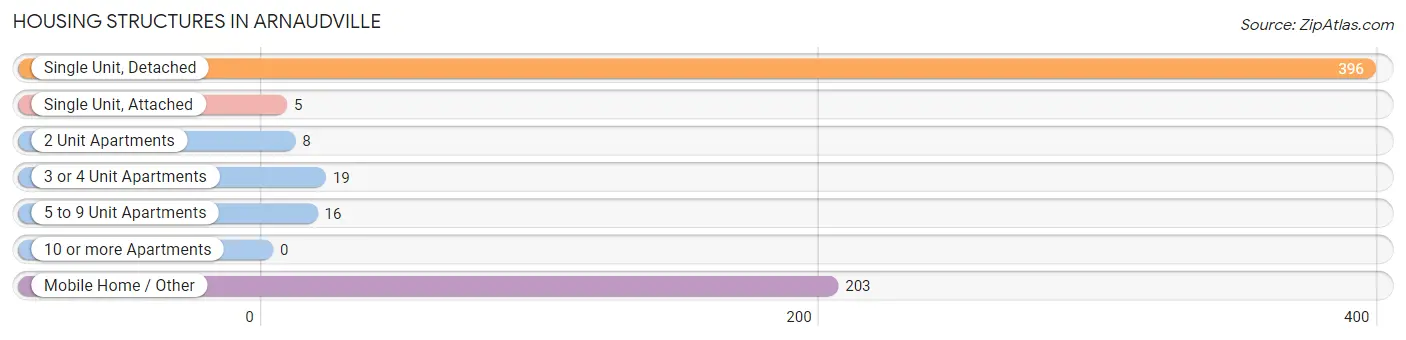
| Structure Type | # Housing Units | % Housing Units |
| Single Unit, Detached | 396 | 61.2% |
| Single Unit, Attached | 5 | 0.8% |
| 2 Unit Apartments | 8 | 1.2% |
| 3 or 4 Unit Apartments | 19 | 2.9% |
| 5 to 9 Unit Apartments | 16 | 2.5% |
| 10 or more Apartments | 0 | 0.0% |
| Mobile Home / Other | 203 | 31.4% |
| Total | 647 | 100.0% |
Housing Structures by Occupancy in Arnaudville
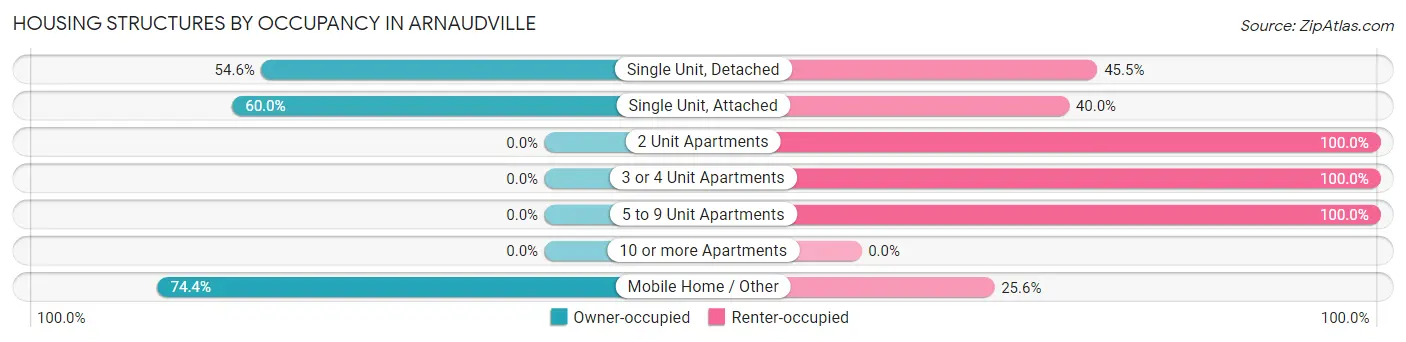
| Structure Type | Owner-occupied | Renter-occupied |
| Single Unit, Detached | 216 (54.5%) | 180 (45.5%) |
| Single Unit, Attached | 3 (60.0%) | 2 (40.0%) |
| 2 Unit Apartments | 0 (0.0%) | 8 (100.0%) |
| 3 or 4 Unit Apartments | 0 (0.0%) | 19 (100.0%) |
| 5 to 9 Unit Apartments | 0 (0.0%) | 16 (100.0%) |
| 10 or more Apartments | 0 (0.0%) | 0 (0.0%) |
| Mobile Home / Other | 151 (74.4%) | 52 (25.6%) |
| Total | 370 (57.2%) | 277 (42.8%) |
Housing Structures by Number of Rooms in Arnaudville
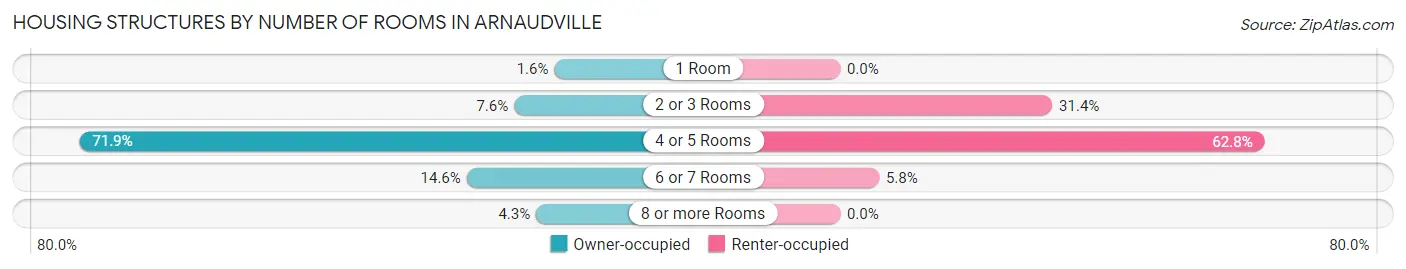
| Number of Rooms | Owner-occupied | Renter-occupied |
| 1 Room | 6 (1.6%) | 0 (0.0%) |
| 2 or 3 Rooms | 28 (7.6%) | 87 (31.4%) |
| 4 or 5 Rooms | 266 (71.9%) | 174 (62.8%) |
| 6 or 7 Rooms | 54 (14.6%) | 16 (5.8%) |
| 8 or more Rooms | 16 (4.3%) | 0 (0.0%) |
| Total | 370 (100.0%) | 277 (100.0%) |
Housing Structure by Heating Type in Arnaudville
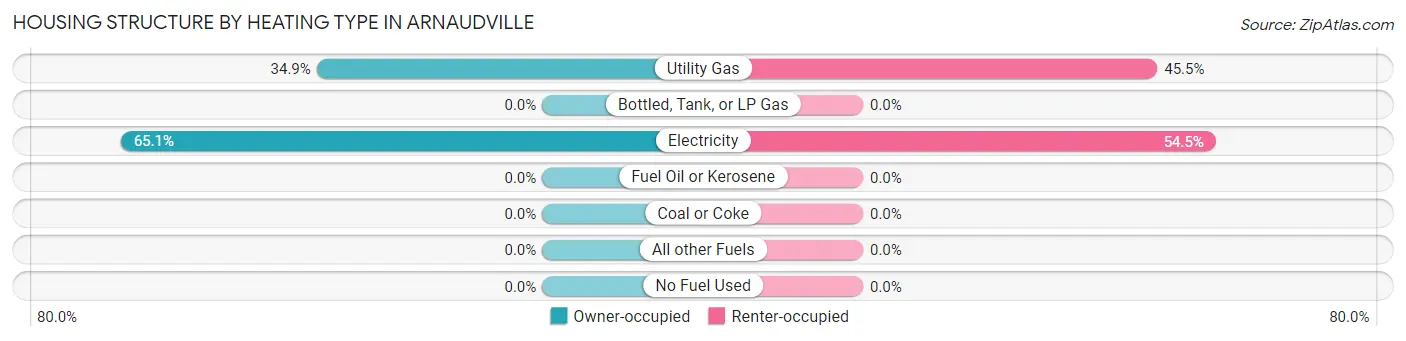
| Heating Type | Owner-occupied | Renter-occupied |
| Utility Gas | 129 (34.9%) | 126 (45.5%) |
| Bottled, Tank, or LP Gas | 0 (0.0%) | 0 (0.0%) |
| Electricity | 241 (65.1%) | 151 (54.5%) |
| Fuel Oil or Kerosene | 0 (0.0%) | 0 (0.0%) |
| Coal or Coke | 0 (0.0%) | 0 (0.0%) |
| All other Fuels | 0 (0.0%) | 0 (0.0%) |
| No Fuel Used | 0 (0.0%) | 0 (0.0%) |
| Total | 370 (100.0%) | 277 (100.0%) |
Household Vehicle Usage in Arnaudville
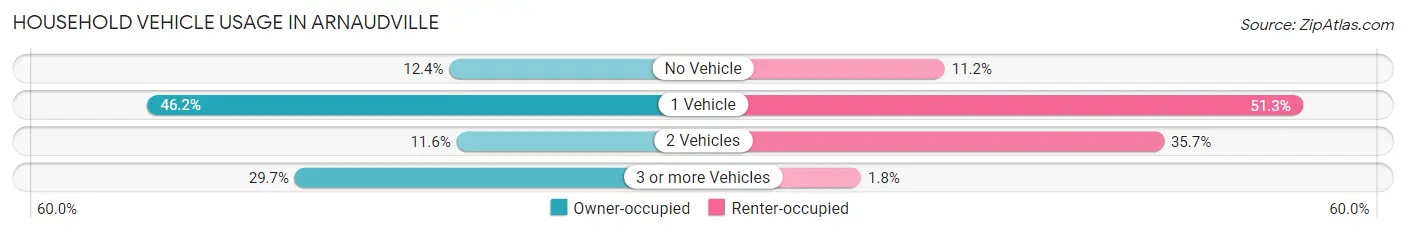
| Vehicles per Household | Owner-occupied | Renter-occupied |
| No Vehicle | 46 (12.4%) | 31 (11.2%) |
| 1 Vehicle | 171 (46.2%) | 142 (51.3%) |
| 2 Vehicles | 43 (11.6%) | 99 (35.7%) |
| 3 or more Vehicles | 110 (29.7%) | 5 (1.8%) |
| Total | 370 (100.0%) | 277 (100.0%) |
Real Estate & Mortgages in Arnaudville
Real Estate and Mortgage Overview in Arnaudville
| Characteristic | Without Mortgage | With Mortgage |
| Housing Units | 269 | 101 |
| Median Property Value | $81,400 | $181,300 |
| Median Household Income | $24,531 | $7 |
| Monthly Housing Costs | $263 | $0 |
| Real Estate Taxes | - | - |
Property Value by Mortgage Status in Arnaudville
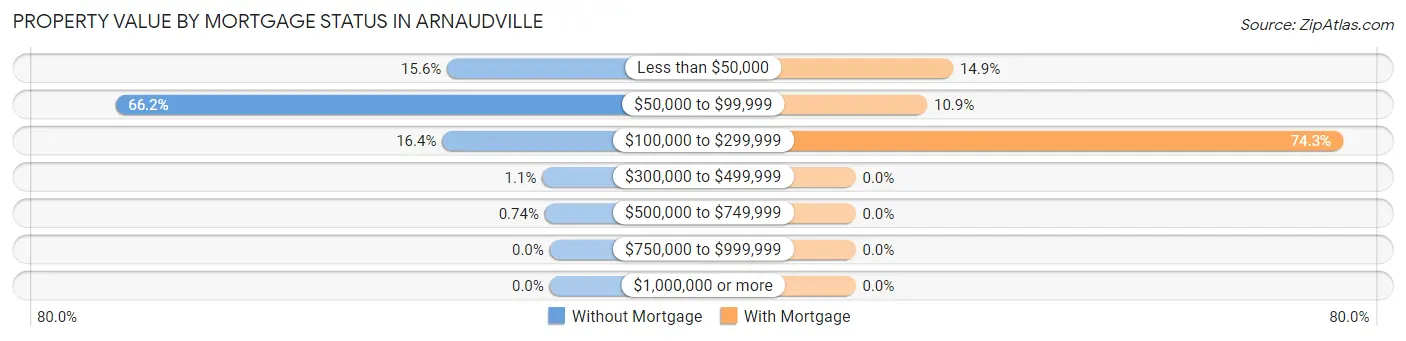
| Property Value | Without Mortgage | With Mortgage |
| Less than $50,000 | 42 (15.6%) | 15 (14.8%) |
| $50,000 to $99,999 | 178 (66.2%) | 11 (10.9%) |
| $100,000 to $299,999 | 44 (16.4%) | 75 (74.3%) |
| $300,000 to $499,999 | 3 (1.1%) | 0 (0.0%) |
| $500,000 to $749,999 | 2 (0.7%) | 0 (0.0%) |
| $750,000 to $999,999 | 0 (0.0%) | 0 (0.0%) |
| $1,000,000 or more | 0 (0.0%) | 0 (0.0%) |
| Total | 269 (100.0%) | 101 (100.0%) |
Household Income by Mortgage Status in Arnaudville
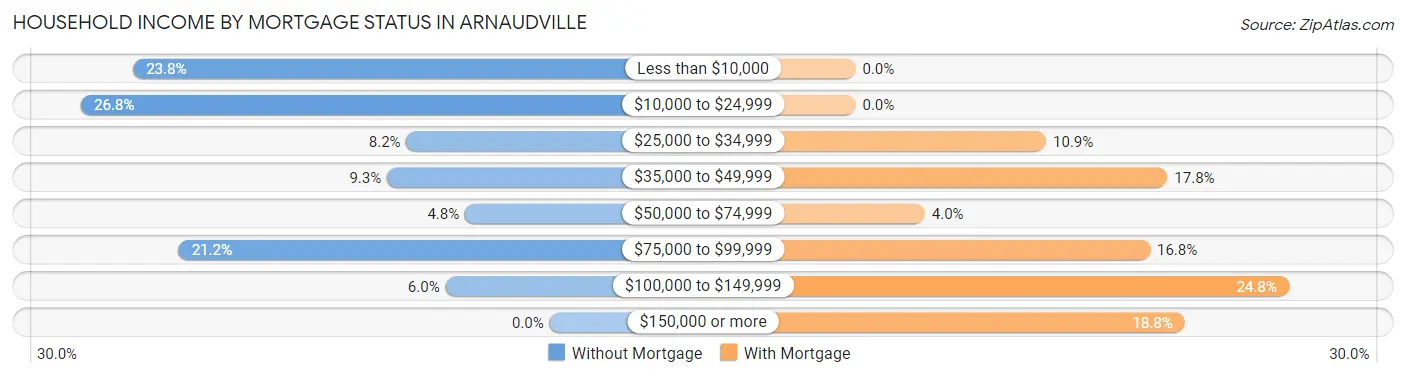
| Household Income | Without Mortgage | With Mortgage |
| Less than $10,000 | 64 (23.8%) | 0 (0.0%) |
| $10,000 to $24,999 | 72 (26.8%) | 0 (0.0%) |
| $25,000 to $34,999 | 22 (8.2%) | 11 (10.9%) |
| $35,000 to $49,999 | 25 (9.3%) | 18 (17.8%) |
| $50,000 to $74,999 | 13 (4.8%) | 4 (4.0%) |
| $75,000 to $99,999 | 57 (21.2%) | 17 (16.8%) |
| $100,000 to $149,999 | 16 (5.9%) | 25 (24.7%) |
| $150,000 or more | 0 (0.0%) | 19 (18.8%) |
| Total | 269 (100.0%) | 101 (100.0%) |
Property Value to Household Income Ratio in Arnaudville
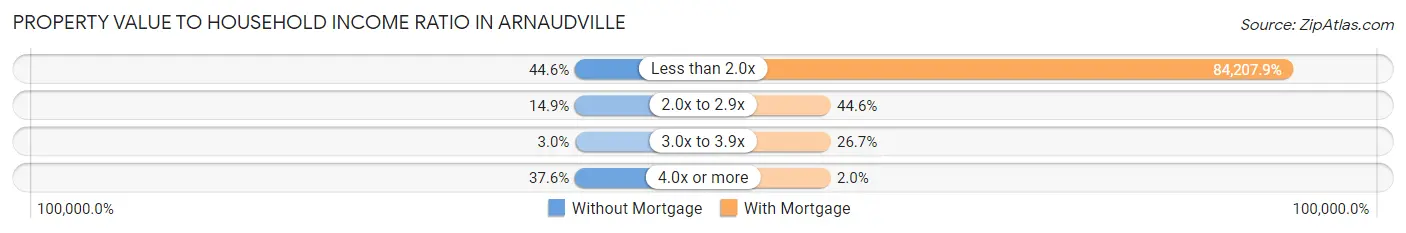
| Value-to-Income Ratio | Without Mortgage | With Mortgage |
| Less than 2.0x | 120 (44.6%) | 85,050 (84,207.9%) |
| 2.0x to 2.9x | 40 (14.9%) | 45 (44.6%) |
| 3.0x to 3.9x | 8 (3.0%) | 27 (26.7%) |
| 4.0x or more | 101 (37.6%) | 2 (2.0%) |
| Total | 269 (100.0%) | 101 (100.0%) |
Real Estate Taxes by Mortgage Status in Arnaudville
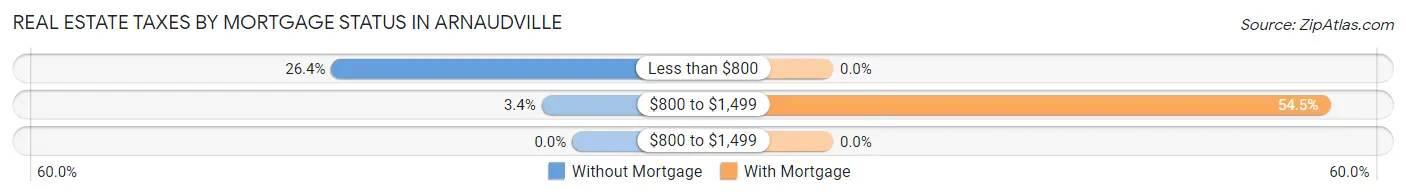
| Property Taxes | Without Mortgage | With Mortgage |
| Less than $800 | 71 (26.4%) | 0 (0.0%) |
| $800 to $1,499 | 9 (3.4%) | 55 (54.5%) |
| $800 to $1,499 | 0 (0.0%) | 0 (0.0%) |
| Total | 269 (100.0%) | 101 (100.0%) |
Health & Disability in Arnaudville
Health Insurance Coverage by Age in Arnaudville
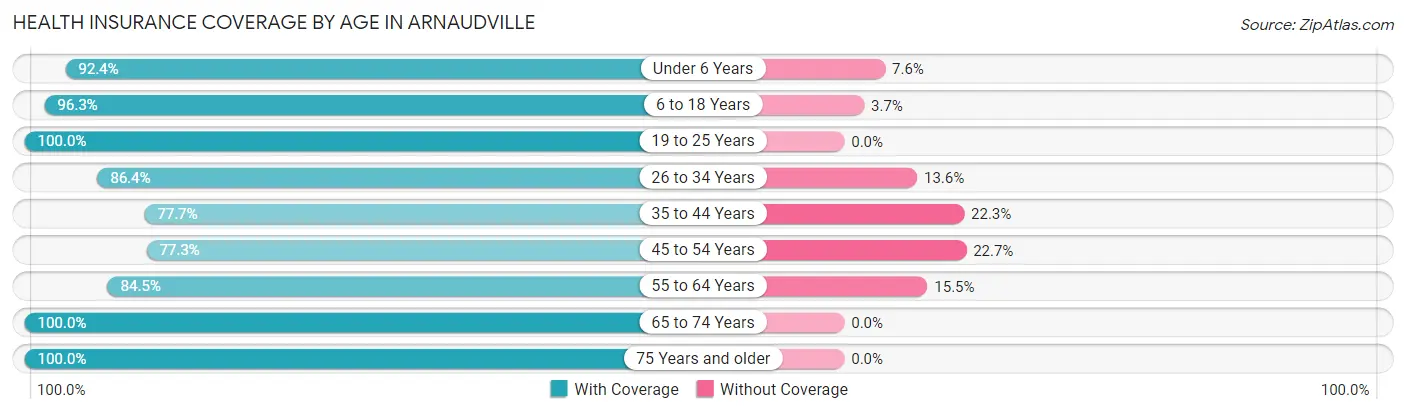
| Age Bracket | With Coverage | Without Coverage |
| Under 6 Years | 182 (92.4%) | 15 (7.6%) |
| 6 to 18 Years | 156 (96.3%) | 6 (3.7%) |
| 19 to 25 Years | 307 (100.0%) | 0 (0.0%) |
| 26 to 34 Years | 121 (86.4%) | 19 (13.6%) |
| 35 to 44 Years | 73 (77.7%) | 21 (22.3%) |
| 45 to 54 Years | 238 (77.3%) | 70 (22.7%) |
| 55 to 64 Years | 120 (84.5%) | 22 (15.5%) |
| 65 to 74 Years | 110 (100.0%) | 0 (0.0%) |
| 75 Years and older | 62 (100.0%) | 0 (0.0%) |
| Total | 1,369 (89.9%) | 153 (10.1%) |
Health Insurance Coverage by Citizenship Status in Arnaudville
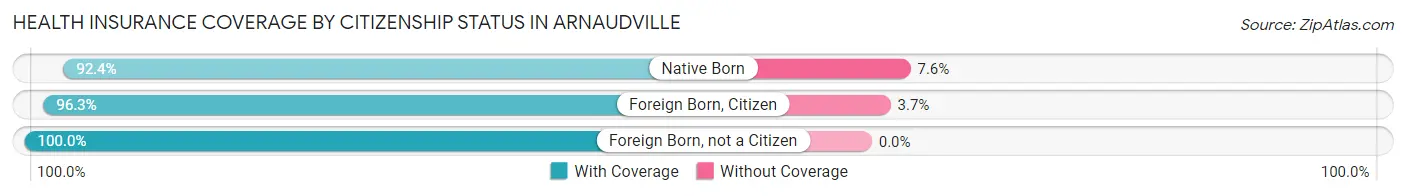
| Citizenship Status | With Coverage | Without Coverage |
| Native Born | 182 (92.4%) | 15 (7.6%) |
| Foreign Born, Citizen | 156 (96.3%) | 6 (3.7%) |
| Foreign Born, not a Citizen | 307 (100.0%) | 0 (0.0%) |
Health Insurance Coverage by Household Income in Arnaudville
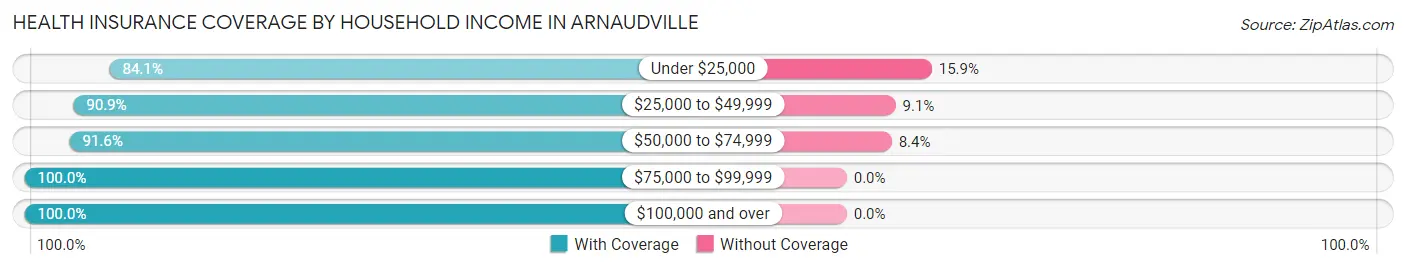
| Household Income | With Coverage | Without Coverage |
| Under $25,000 | 634 (84.1%) | 120 (15.9%) |
| $25,000 to $49,999 | 159 (90.9%) | 16 (9.1%) |
| $50,000 to $74,999 | 185 (91.6%) | 17 (8.4%) |
| $75,000 to $99,999 | 271 (100.0%) | 0 (0.0%) |
| $100,000 and over | 120 (100.0%) | 0 (0.0%) |
Public vs Private Health Insurance Coverage by Age in Arnaudville
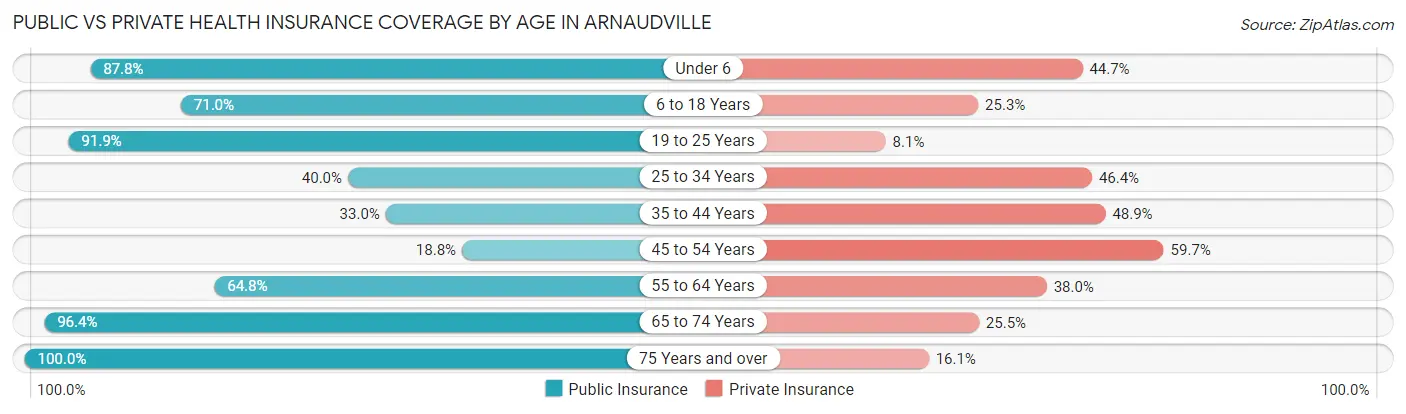
| Age Bracket | Public Insurance | Private Insurance |
| Under 6 | 173 (87.8%) | 88 (44.7%) |
| 6 to 18 Years | 115 (71.0%) | 41 (25.3%) |
| 19 to 25 Years | 282 (91.9%) | 25 (8.1%) |
| 25 to 34 Years | 56 (40.0%) | 65 (46.4%) |
| 35 to 44 Years | 31 (33.0%) | 46 (48.9%) |
| 45 to 54 Years | 58 (18.8%) | 184 (59.7%) |
| 55 to 64 Years | 92 (64.8%) | 54 (38.0%) |
| 65 to 74 Years | 106 (96.4%) | 28 (25.5%) |
| 75 Years and over | 62 (100.0%) | 10 (16.1%) |
| Total | 975 (64.1%) | 541 (35.5%) |
Disability Status by Sex by Age in Arnaudville
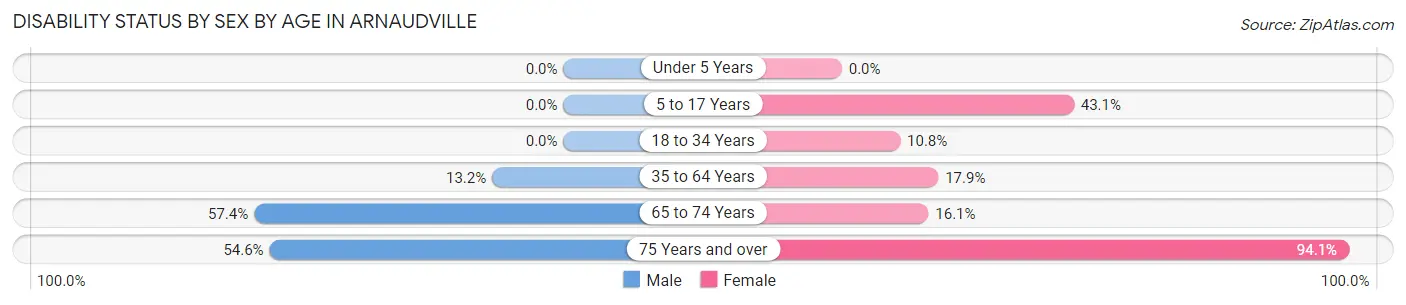
| Age Bracket | Male | Female |
| Under 5 Years | 0 (0.0%) | 0 (0.0%) |
| 5 to 17 Years | 0 (0.0%) | 31 (43.1%) |
| 18 to 34 Years | 0 (0.0%) | 25 (10.8%) |
| 35 to 64 Years | 38 (13.2%) | 46 (17.9%) |
| 65 to 74 Years | 31 (57.4%) | 9 (16.1%) |
| 75 Years and over | 6 (54.5%) | 48 (94.1%) |
Disability Class by Sex by Age in Arnaudville
Disability Class: Hearing Difficulty
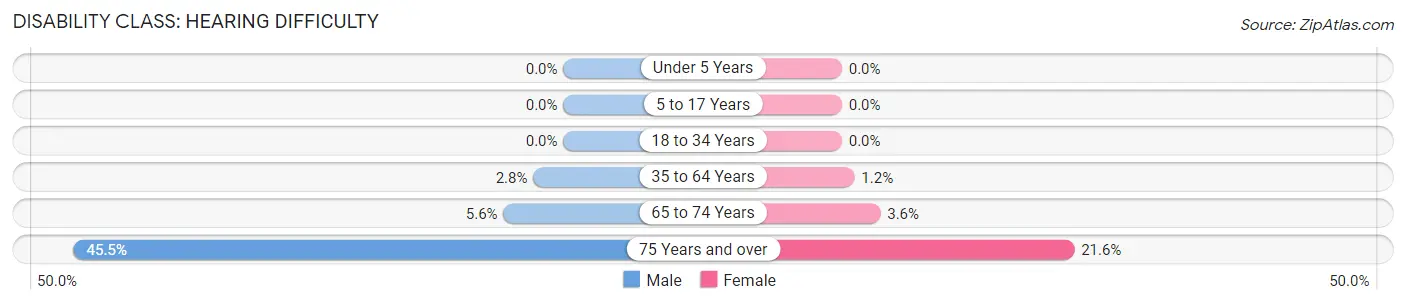
| Age Bracket | Male | Female |
| Under 5 Years | 0 (0.0%) | 0 (0.0%) |
| 5 to 17 Years | 0 (0.0%) | 0 (0.0%) |
| 18 to 34 Years | 0 (0.0%) | 0 (0.0%) |
| 35 to 64 Years | 8 (2.8%) | 3 (1.2%) |
| 65 to 74 Years | 3 (5.6%) | 2 (3.6%) |
| 75 Years and over | 5 (45.5%) | 11 (21.6%) |
Disability Class: Vision Difficulty
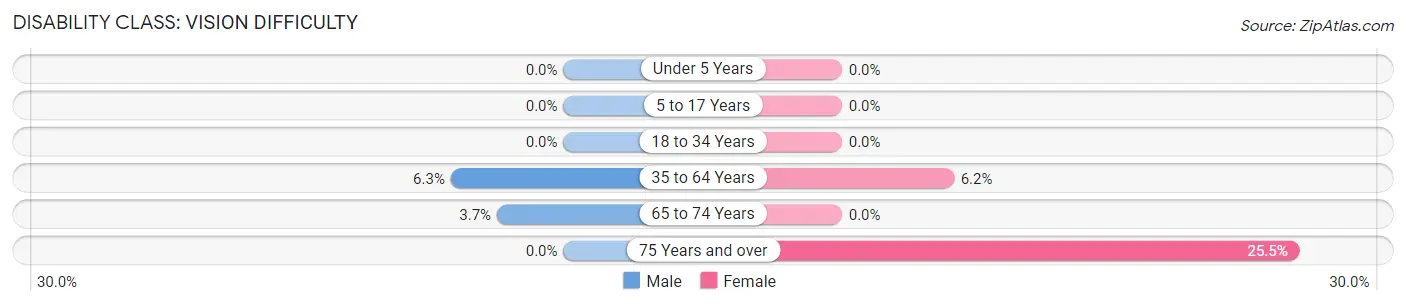
| Age Bracket | Male | Female |
| Under 5 Years | 0 (0.0%) | 0 (0.0%) |
| 5 to 17 Years | 0 (0.0%) | 0 (0.0%) |
| 18 to 34 Years | 0 (0.0%) | 0 (0.0%) |
| 35 to 64 Years | 18 (6.3%) | 16 (6.2%) |
| 65 to 74 Years | 2 (3.7%) | 0 (0.0%) |
| 75 Years and over | 0 (0.0%) | 13 (25.5%) |
Disability Class: Cognitive Difficulty
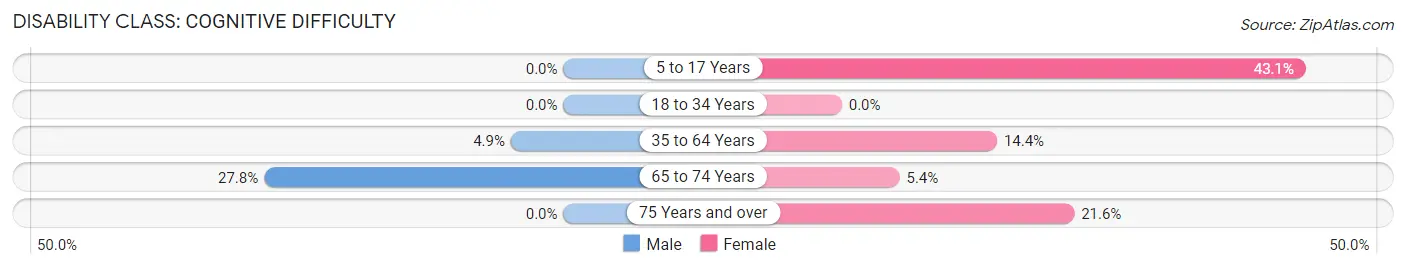
| Age Bracket | Male | Female |
| 5 to 17 Years | 0 (0.0%) | 31 (43.1%) |
| 18 to 34 Years | 0 (0.0%) | 0 (0.0%) |
| 35 to 64 Years | 14 (4.9%) | 37 (14.4%) |
| 65 to 74 Years | 15 (27.8%) | 3 (5.4%) |
| 75 Years and over | 0 (0.0%) | 11 (21.6%) |
Disability Class: Ambulatory Difficulty
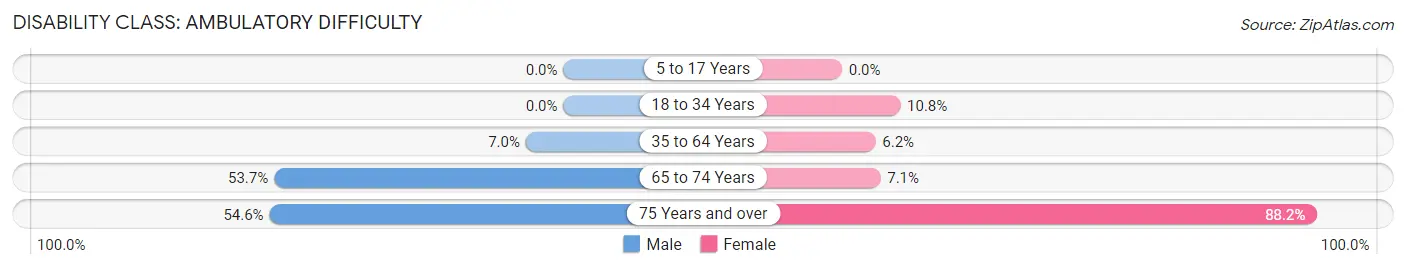
| Age Bracket | Male | Female |
| 5 to 17 Years | 0 (0.0%) | 0 (0.0%) |
| 18 to 34 Years | 0 (0.0%) | 25 (10.8%) |
| 35 to 64 Years | 20 (7.0%) | 16 (6.2%) |
| 65 to 74 Years | 29 (53.7%) | 4 (7.1%) |
| 75 Years and over | 6 (54.5%) | 45 (88.2%) |
Disability Class: Self-Care Difficulty
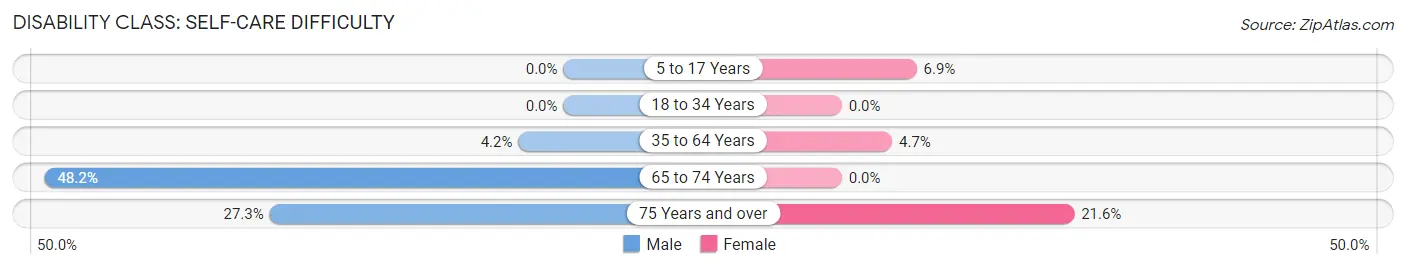
| Age Bracket | Male | Female |
| 5 to 17 Years | 0 (0.0%) | 5 (6.9%) |
| 18 to 34 Years | 0 (0.0%) | 0 (0.0%) |
| 35 to 64 Years | 12 (4.2%) | 12 (4.7%) |
| 65 to 74 Years | 26 (48.1%) | 0 (0.0%) |
| 75 Years and over | 3 (27.3%) | 11 (21.6%) |
Technology Access in Arnaudville
Computing Device Access in Arnaudville
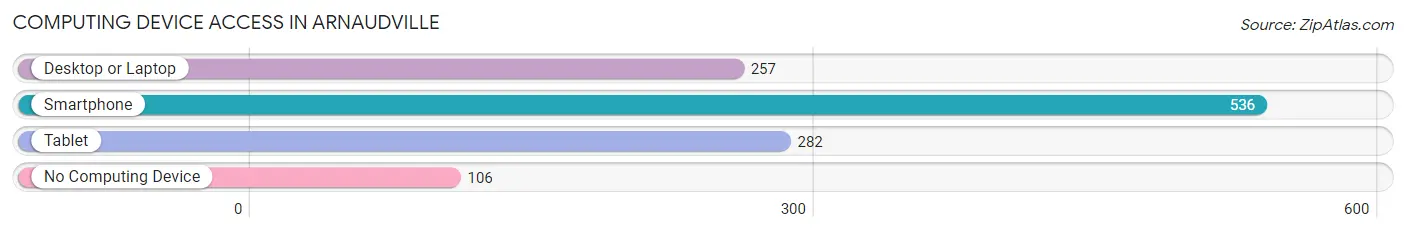
| Device Type | # Households | % Households |
| Desktop or Laptop | 257 | 39.7% |
| Smartphone | 536 | 82.8% |
| Tablet | 282 | 43.6% |
| No Computing Device | 106 | 16.4% |
| Total | 647 | 100.0% |
Internet Access in Arnaudville
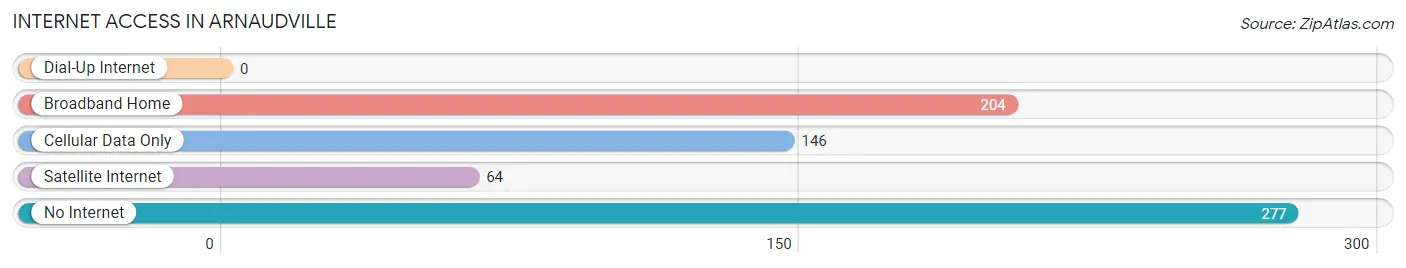
| Internet Type | # Households | % Households |
| Dial-Up Internet | 0 | 0.0% |
| Broadband Home | 204 | 31.5% |
| Cellular Data Only | 146 | 22.6% |
| Satellite Internet | 64 | 9.9% |
| No Internet | 277 | 42.8% |
| Total | 647 | 100.0% |
Arnaudville Summary
Arnaudville is a small town located in St. Landry Parish, Louisiana. It is situated on the banks of Bayou Teche, approximately 30 miles south of Lafayette. The town was founded in 1884 by a group of French-speaking settlers from the nearby town of Grand Coteau. The town was named after the Arnaud family, who were among the first settlers.
History
Arnaudville was founded in 1884 by a group of French-speaking settlers from the nearby town of Grand Coteau. The town was named after the Arnaud family, who were among the first settlers. The town was originally a farming community, with the main crops being cotton, corn, and sugar cane. The town also had a sawmill and a gristmill.
In the early 1900s, the town began to grow and develop. The first school was built in 1910, and the first bank opened in 1912. The town also had a post office, a general store, and a few other businesses.
In the 1920s, the town began to experience a period of growth and prosperity. The population increased from 500 to 1,000, and the town had a number of businesses, including a movie theater, a hotel, and a number of stores.
In the 1940s, the town experienced a decline in population and businesses. The population decreased to 500, and many of the businesses closed. The town also experienced a period of racial tension, as the town was segregated.
In the 1950s, the town began to experience a period of growth and development. The population increased to 1,000, and the town had a number of businesses, including a grocery store, a hardware store, and a number of restaurants.
In the 1960s, the town experienced a period of decline. The population decreased to 500, and many of the businesses closed. The town also experienced a period of racial tension, as the town was segregated.
In the 1970s, the town began to experience a period of growth and development. The population increased to 1,000, and the town had a number of businesses, including a grocery store, a hardware store, and a number of restaurants.
In the 1980s, the town experienced a period of decline. The population decreased to 500, and many of the businesses closed. The town also experienced a period of racial tension, as the town was segregated.
In the 1990s, the town began to experience a period of growth and development. The population increased to 1,000, and the town had a number of businesses, including a grocery store, a hardware store, and a number of restaurants.
Geography
Arnaudville is located in St. Landry Parish, Louisiana. It is situated on the banks of Bayou Teche, approximately 30 miles south of Lafayette. The town is located in a rural area, and is surrounded by farmland and woodlands. The town is located at an elevation of approximately 30 feet above sea level.
Economy
The economy of Arnaudville is largely based on agriculture. The main crops grown in the area are cotton, corn, and sugar cane. The town also has a number of businesses, including a grocery store, a hardware store, and a number of restaurants.
Demographics
As of the 2010 census, the population of Arnaudville was 1,068. The racial makeup of the town was 79.3% White, 17.7% African American, 0.3% Native American, 0.3% Asian, 0.1% Pacific Islander, 0.7% from other races, and 1.9% from two or more races. Hispanic or Latino of any race were 2.2% of the population.
The median household income in Arnaudville was $30,938, and the median family income was $37,500. The per capita income was $15,945. About 18.2% of the population was below the poverty line.
Common Questions
What is the Total Population of Arnaudville?
Total Population of Arnaudville is 1,522.
What is the Total Male Population of Arnaudville?
Total Male Population of Arnaudville is 822.
What is the Total Female Population of Arnaudville?
Total Female Population of Arnaudville is 700.
What is the Ratio of Males per 100 Females in Arnaudville?
There are 117.43 Males per 100 Females in Arnaudville.
What is the Ratio of Females per 100 Males in Arnaudville?
There are 85.16 Females per 100 Males in Arnaudville.
What is the Median Population Age in Arnaudville?
Median Population Age in Arnaudville is 29.5 Years.
What is the Average Family Size in Arnaudville
Average Family Size in Arnaudville is 2.5 People.
What is the Average Household Size in Arnaudville
Average Household Size in Arnaudville is 2.4 People.
What is Per Capita Income in Arnaudville?
Per Capita income in Arnaudville is $17,931.
What is the Median Family Income in Arnaudville?
Median Family Income in Arnaudville is $16,371.
What is the Median Household income in Arnaudville?
Median Household Income in Arnaudville is $24,219.
What is Income or Wage Gap in Arnaudville?
Income or Wage Gap in Arnaudville is 66.6%.
Women in Arnaudville earn 33.4 cents for every dollar earned by a man.
What is Inequality or Gini Index in Arnaudville?
Inequality or Gini Index in Arnaudville is 0.58.
How Large is the Labor Force in Arnaudville?
There are 599 People in the Labor Forcein in Arnaudville.
What is the Percentage of People in the Labor Force in Arnaudville?
48.5% of People are in the Labor Force in Arnaudville.
What is the Unemployment Rate in Arnaudville?
Unemployment Rate in Arnaudville is 7.0%.