Zip Codes with the Highest Percentage of Population Employed in Health Diagnosing & Treating in Chicago, IL
RELATED REPORTS & OPTIONS
Health Diagnosing & Treating
Chicago
Compare Zip Codes
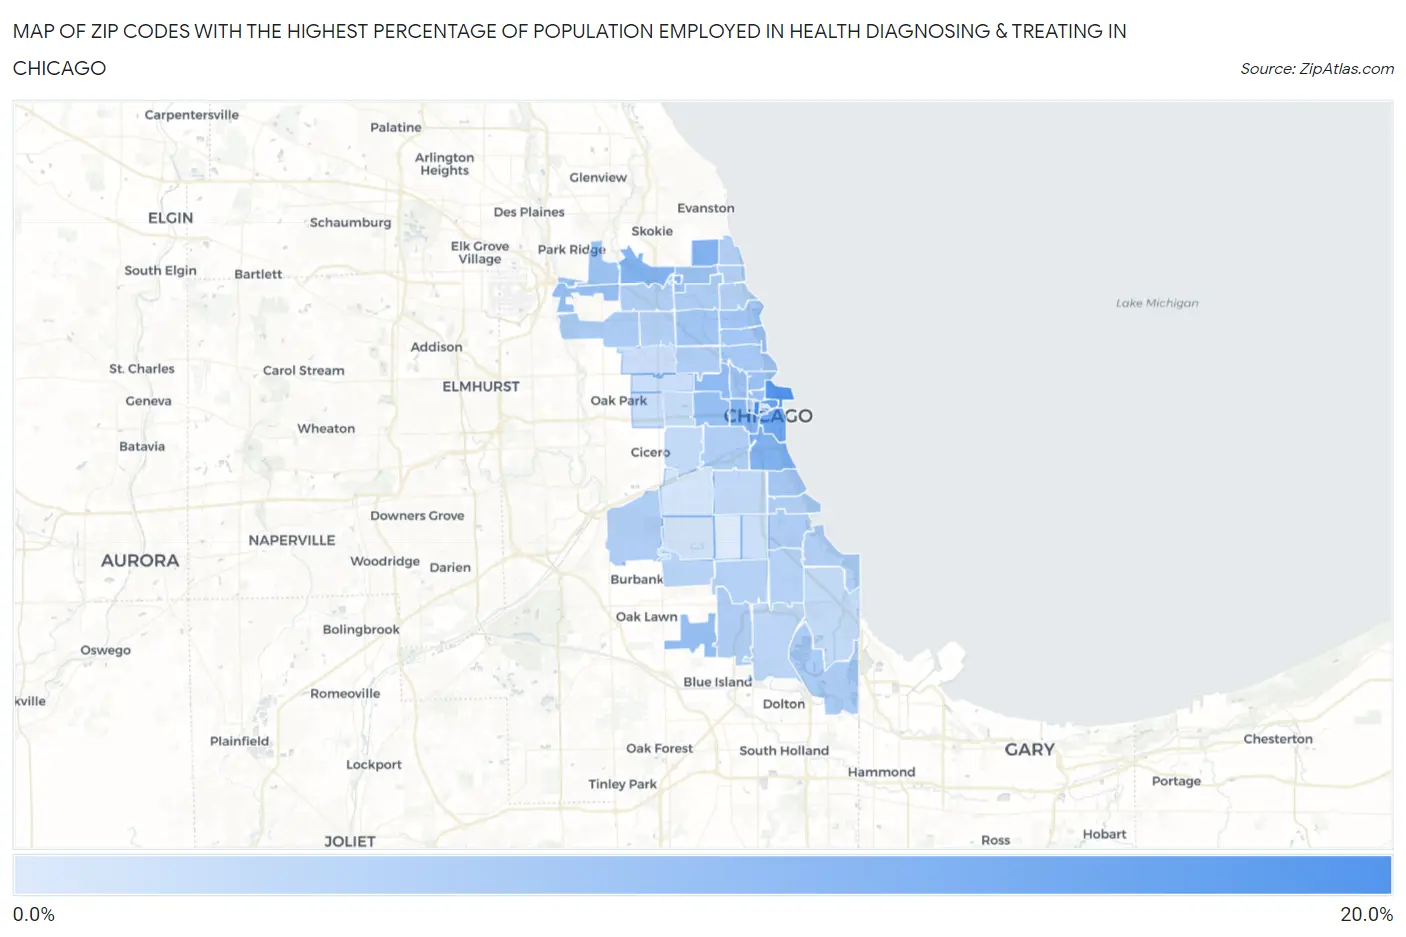
Map of Zip Codes with the Highest Percentage of Population Employed in Health Diagnosing & Treating in Chicago
0.0%
20.0%
Zip Codes with the Highest Percentage of Population Employed in Health Diagnosing & Treating in Chicago, IL
| Zip Code | % Employed | vs State | vs National | |
| 1. | 60606 | 15.7% | 6.2%(+9.45)#47 | 6.2%(+9.44)#1,003 |
| 2. | 60611 | 14.5% | 6.2%(+8.27)#62 | 6.2%(+8.27)#1,256 |
| 3. | 60601 | 12.6% | 6.2%(+6.34)#102 | 6.2%(+6.33)#1,921 |
| 4. | 60605 | 11.5% | 6.2%(+5.25)#125 | 6.2%(+5.24)#2,535 |
| 5. | 60616 | 9.8% | 6.2%(+3.61)#196 | 6.2%(+3.60)#4,062 |
| 6. | 60645 | 9.6% | 6.2%(+3.35)#214 | 6.2%(+3.35)#4,407 |
| 7. | 60607 | 9.6% | 6.2%(+3.33)#218 | 6.2%(+3.32)#4,448 |
| 8. | 60646 | 9.3% | 6.2%(+3.05)#237 | 6.2%(+3.04)#4,889 |
| 9. | 60603 | 8.6% | 6.2%(+2.41)#301 | 6.2%(+2.40)#6,037 |
| 10. | 60622 | 8.4% | 6.2%(+2.16)#323 | 6.2%(+2.15)#6,534 |
| 11. | 60612 | 7.7% | 6.2%(+1.51)#400 | 6.2%(+1.50)#8,138 |
| 12. | 60656 | 7.6% | 6.2%(+1.38)#421 | 6.2%(+1.37)#8,469 |
| 13. | 60655 | 7.5% | 6.2%(+1.24)#434 | 6.2%(+1.23)#8,886 |
| 14. | 60654 | 7.4% | 6.2%(+1.18)#442 | 6.2%(+1.17)#9,067 |
| 15. | 60659 | 7.3% | 6.2%(+1.11)#449 | 6.2%(+1.10)#9,278 |
| 16. | 60610 | 7.1% | 6.2%(+0.913)#470 | 6.2%(+0.904)#9,868 |
| 17. | 60642 | 6.9% | 6.2%(+0.690)#497 | 6.2%(+0.681)#10,599 |
| 18. | 60631 | 6.9% | 6.2%(+0.648)#506 | 6.2%(+0.640)#10,735 |
| 19. | 60613 | 6.6% | 6.2%(+0.340)#552 | 6.2%(+0.332)#11,756 |
| 20. | 60657 | 6.5% | 6.2%(+0.286)#562 | 6.2%(+0.278)#11,943 |
| 21. | 60618 | 6.5% | 6.2%(+0.246)#565 | 6.2%(+0.237)#12,088 |
| 22. | 60614 | 6.3% | 6.2%(+0.030)#600 | 6.2%(+0.021)#12,883 |
| 23. | 60653 | 6.2% | 6.2%(+0.006)#605 | 6.2%(-0.002)#12,983 |
| 24. | 60634 | 5.5% | 6.2%(-0.706)#728 | 6.2%(-0.714)#15,673 |
| 25. | 60633 | 5.5% | 6.2%(-0.740)#733 | 6.2%(-0.749)#15,805 |
| 26. | 60643 | 5.4% | 6.2%(-0.835)#761 | 6.2%(-0.843)#16,170 |
| 27. | 60637 | 5.4% | 6.2%(-0.839)#762 | 6.2%(-0.848)#16,186 |
| 28. | 60661 | 5.3% | 6.2%(-0.947)#779 | 6.2%(-0.956)#16,600 |
| 29. | 60615 | 5.3% | 6.2%(-0.971)#784 | 6.2%(-0.980)#16,681 |
| 30. | 60625 | 5.3% | 6.2%(-0.972)#785 | 6.2%(-0.981)#16,683 |
| 31. | 60626 | 5.2% | 6.2%(-0.994)#791 | 6.2%(-1.00)#16,777 |
| 32. | 60608 | 5.2% | 6.2%(-1.06)#800 | 6.2%(-1.07)#17,019 |
| 33. | 60647 | 5.2% | 6.2%(-1.06)#801 | 6.2%(-1.07)#17,027 |
| 34. | 60638 | 5.0% | 6.2%(-1.19)#829 | 6.2%(-1.20)#17,505 |
| 35. | 60649 | 5.0% | 6.2%(-1.23)#839 | 6.2%(-1.24)#17,677 |
| 36. | 60660 | 5.0% | 6.2%(-1.28)#852 | 6.2%(-1.29)#17,891 |
| 37. | 60641 | 4.9% | 6.2%(-1.31)#857 | 6.2%(-1.32)#17,994 |
| 38. | 60640 | 4.9% | 6.2%(-1.34)#863 | 6.2%(-1.35)#18,137 |
| 39. | 60630 | 4.8% | 6.2%(-1.39)#875 | 6.2%(-1.40)#18,306 |
| 40. | 60619 | 4.7% | 6.2%(-1.51)#901 | 6.2%(-1.51)#18,751 |
| 41. | 60620 | 4.7% | 6.2%(-1.56)#912 | 6.2%(-1.57)#18,939 |
| 42. | 60652 | 4.3% | 6.2%(-1.96)#970 | 6.2%(-1.96)#20,410 |
| 43. | 60628 | 4.0% | 6.2%(-2.24)#1,013 | 6.2%(-2.25)#21,386 |
| 44. | 60609 | 3.6% | 6.2%(-2.65)#1,064 | 6.2%(-2.66)#22,658 |
| 45. | 60624 | 3.4% | 6.2%(-2.80)#1,072 | 6.2%(-2.80)#23,081 |
| 46. | 60617 | 3.4% | 6.2%(-2.84)#1,078 | 6.2%(-2.85)#23,207 |
| 47. | 60623 | 3.3% | 6.2%(-2.92)#1,089 | 6.2%(-2.93)#23,421 |
| 48. | 60644 | 3.0% | 6.2%(-3.25)#1,132 | 6.2%(-3.26)#24,362 |
| 49. | 60639 | 2.9% | 6.2%(-3.36)#1,143 | 6.2%(-3.37)#24,653 |
| 50. | 60651 | 2.8% | 6.2%(-3.39)#1,144 | 6.2%(-3.40)#24,703 |
| 51. | 60604 | 2.7% | 6.2%(-3.56)#1,154 | 6.2%(-3.57)#25,102 |
| 52. | 60621 | 2.6% | 6.2%(-3.61)#1,160 | 6.2%(-3.62)#25,205 |
| 53. | 60629 | 2.1% | 6.2%(-4.18)#1,212 | 6.2%(-4.19)#26,369 |
| 54. | 60632 | 1.9% | 6.2%(-4.38)#1,226 | 6.2%(-4.39)#26,712 |
| 55. | 60636 | 1.1% | 6.2%(-5.16)#1,266 | 6.2%(-5.17)#27,749 |
1
Common Questions
What are the Top 10 Zip Codes with the Highest Percentage of Population Employed in Health Diagnosing & Treating in Chicago, IL?
Top 10 Zip Codes with the Highest Percentage of Population Employed in Health Diagnosing & Treating in Chicago, IL are:
What zip code has the Highest Percentage of Population Employed in Health Diagnosing & Treating in Chicago, IL?
60606 has the Highest Percentage of Population Employed in Health Diagnosing & Treating in Chicago, IL with 15.7%.
What is the Percentage of Population Employed in Health Diagnosing & Treating in Chicago, IL?
Percentage of Population Employed in Health Diagnosing & Treating in Chicago is 5.7%.
What is the Percentage of Population Employed in Health Diagnosing & Treating in Illinois?
Percentage of Population Employed in Health Diagnosing & Treating in Illinois is 6.2%.
What is the Percentage of Population Employed in Health Diagnosing & Treating in the United States?
Percentage of Population Employed in Health Diagnosing & Treating in the United States is 6.2%.