Zip Codes with the Highest Percentage of Hawaiian / Pacific Population in Chicago, IL
RELATED REPORTS & OPTIONS
Hawaiian / Pacific
Chicago
Compare Zip Codes
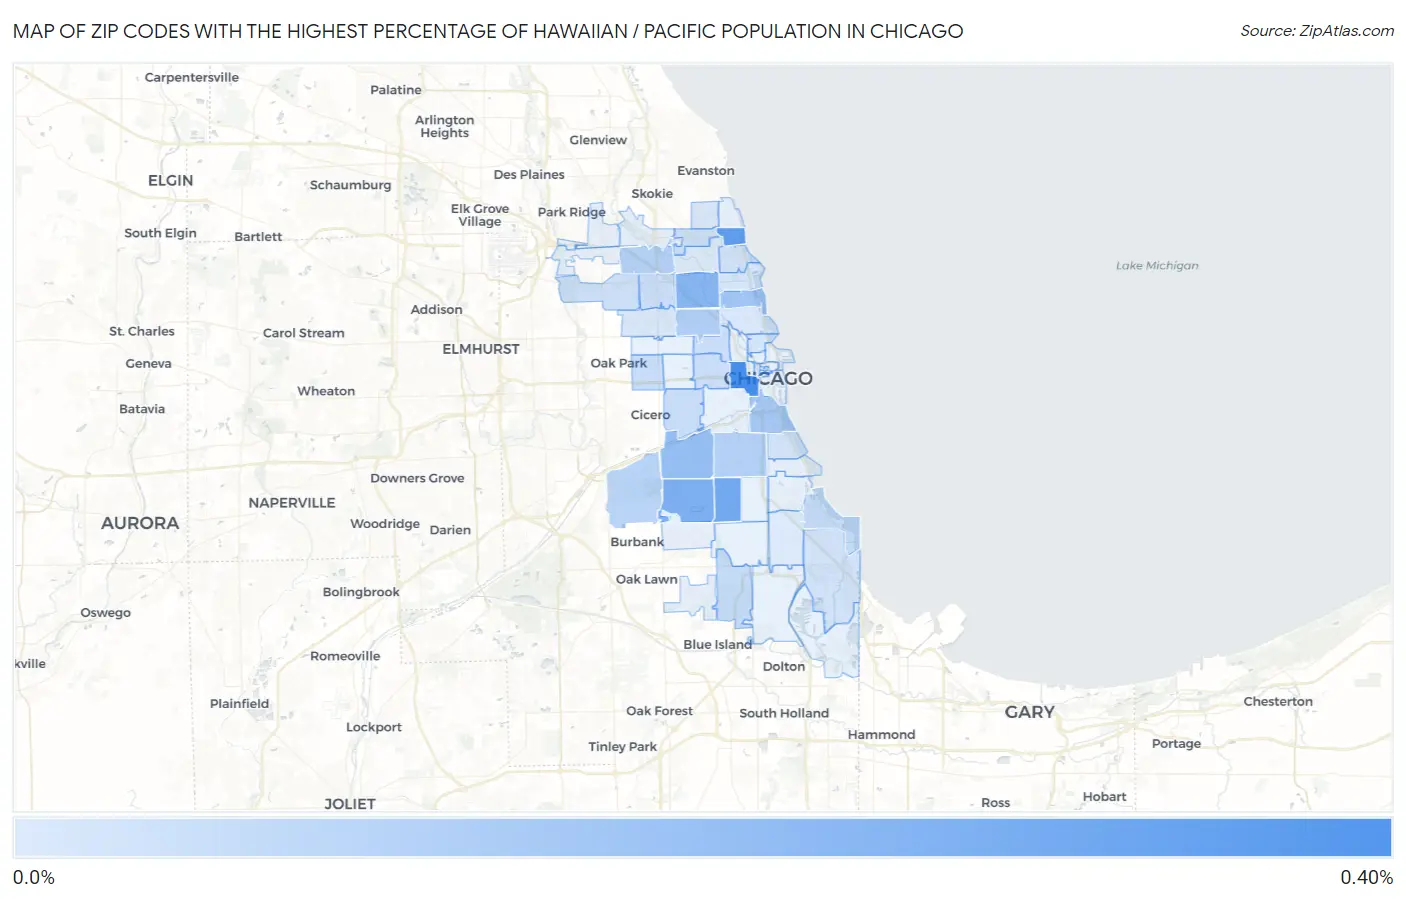
Map of Zip Codes with the Highest Percentage of Hawaiian / Pacific Population in Chicago
0.0%
0.40%
Zip Codes with the Highest Percentage of Hawaiian / Pacific Population in Chicago, IL
| Zip Code | Hawaiian / Pacific | vs State | vs National | |
| 1. | 60607 | 0.31% | 0.043%(+0.263)#29 | 0.19%(+0.117)#2,093 |
| 2. | 60660 | 0.25% | 0.043%(+0.209)#36 | 0.19%(+0.063)#2,421 |
| 3. | 60636 | 0.22% | 0.043%(+0.175)#45 | 0.19%(+0.029)#2,662 |
| 4. | 60629 | 0.19% | 0.043%(+0.148)#53 | 0.19%(+0.002)#2,890 |
| 5. | 60618 | 0.17% | 0.043%(+0.129)#59 | 0.19%(-0.016)#3,083 |
| 6. | 60632 | 0.15% | 0.043%(+0.105)#67 | 0.19%(-0.041)#3,369 |
| 7. | 60657 | 0.12% | 0.043%(+0.081)#76 | 0.19%(-0.065)#3,681 |
| 8. | 60616 | 0.12% | 0.043%(+0.073)#77 | 0.19%(-0.073)#3,791 |
| 9. | 60647 | 0.091% | 0.043%(+0.048)#85 | 0.19%(-0.098)#4,206 |
| 10. | 60609 | 0.085% | 0.043%(+0.042)#91 | 0.19%(-0.103)#4,305 |
| 11. | 60630 | 0.080% | 0.043%(+0.037)#94 | 0.19%(-0.109)#4,425 |
| 12. | 60638 | 0.071% | 0.043%(+0.028)#97 | 0.19%(-0.118)#4,610 |
| 13. | 60649 | 0.054% | 0.043%(+0.011)#109 | 0.19%(-0.135)#4,992 |
| 14. | 60643 | 0.048% | 0.043%(+0.005)#112 | 0.19%(-0.141)#5,145 |
| 15. | 60644 | 0.042% | 0.043%(-0.000)#114 | 0.19%(-0.146)#5,275 |
| 16. | 60623 | 0.042% | 0.043%(-0.001)#115 | 0.19%(-0.147)#5,297 |
| 17. | 60641 | 0.039% | 0.043%(-0.004)#123 | 0.19%(-0.150)#5,377 |
| 18. | 60622 | 0.039% | 0.043%(-0.004)#124 | 0.19%(-0.150)#5,384 |
| 19. | 60612 | 0.038% | 0.043%(-0.005)#125 | 0.19%(-0.151)#5,411 |
| 20. | 60634 | 0.036% | 0.043%(-0.007)#130 | 0.19%(-0.153)#5,486 |
| 21. | 60659 | 0.035% | 0.043%(-0.008)#131 | 0.19%(-0.154)#5,494 |
| 22. | 60640 | 0.025% | 0.043%(-0.018)#146 | 0.19%(-0.163)#5,817 |
| 23. | 60617 | 0.024% | 0.043%(-0.019)#150 | 0.19%(-0.165)#5,869 |
| 24. | 60653 | 0.020% | 0.043%(-0.023)#156 | 0.19%(-0.168)#5,980 |
| 25. | 60610 | 0.019% | 0.043%(-0.024)#161 | 0.19%(-0.170)#6,022 |
| 26. | 60613 | 0.013% | 0.043%(-0.029)#166 | 0.19%(-0.175)#6,181 |
| 27. | 60639 | 0.013% | 0.043%(-0.030)#167 | 0.19%(-0.176)#6,196 |
| 28. | 60614 | 0.0098% | 0.043%(-0.033)#169 | 0.19%(-0.179)#6,286 |
| 29. | 60645 | 0.0041% | 0.043%(-0.039)#174 | 0.19%(-0.185)#6,413 |
| 30. | 60619 | 0.0017% | 0.043%(-0.041)#176 | 0.19%(-0.187)#6,454 |
| 31. | 60625 | 0.0012% | 0.043%(-0.042)#177 | 0.19%(-0.187)#6,457 |
1
Common Questions
What are the Top 10 Zip Codes with the Highest Percentage of Hawaiian / Pacific Population in Chicago, IL?
Top 10 Zip Codes with the Highest Percentage of Hawaiian / Pacific Population in Chicago, IL are:
What zip code has the Highest Percentage of Hawaiian / Pacific Population in Chicago, IL?
60607 has the Highest Percentage of Hawaiian / Pacific Population in Chicago, IL with 0.31%.
What is the Percentage of Hawaiian / Pacific Population in Chicago, IL?
Percentage of Hawaiian / Pacific Population in Chicago is 0.052%.
What is the Percentage of Hawaiian / Pacific Population in Illinois?
Percentage of Hawaiian / Pacific Population in Illinois is 0.043%.
What is the Percentage of Hawaiian / Pacific Population in the United States?
Percentage of Hawaiian / Pacific Population in the United States is 0.19%.