Zip Codes with the Highest Percentage of Population Employed in Accommodation & Food Services in Chicago, IL

RELATED REPORTS & OPTIONS

Accommodation & Food Services
Population
Families and Households
Female Fertility
Female Fertility (Unmarried)
Race (Community Size)
Race (Percentage)
Ancestry (Community Size)
AfghanAfricanAlbanianAmericanApacheArabArgentineanArmenianAssyrian / Chaldean / SyriacAustralianAustrianBahamianBangladeshiBarbadianBasqueBelgianBelizeanBermudanBhutaneseBlackfeetBolivianBrazilianBritishBritish West IndianBulgarianBurmeseCajunCambodianCanadianCape VerdeanCarpatho RusynCelticCentral AmericanCentral American IndianCherokeeChickasawChileanChippewaChoctawColombianComancheCosta RicanCreeCreekCroatianCubanCypriotCzechCzechoslovakianDanishDominicanDutchEastern EuropeanEcuadorianEgyptianEnglishEstonianEthiopianEuropeanFilipinoFinnishFrenchFrench American IndianFrench CanadianGermanGerman RussianGhanaianGreekGuamanian / ChamorroGuatemalanGuyaneseHaitianHmongHonduranHopiHungarianIcelanderIndian (Asian)IndonesianInupiatIranianIraqiIrishIroquoisIsraeliItalianJamaicanJapaneseJordanianKenyanKiowaKoreanLaotianLatvianLebaneseLiberianLithuanianLumbeeLuxembourgerMacedonianMalaysianMalteseMenomineeMexicanMexican American IndianMongolianMoroccanNative HawaiianNavajoNew ZealanderNicaraguanNigerianNorthern EuropeanNorwegianOkinawanOsageOttawaPaiutePakistaniPalestinianPanamanianParaguayanPennsylvania GermanPeruvianPolishPortuguesePotawatomiPuebloPuerto RicanPuget Sound SalishRomanianRussianSalvadoranSamoanScandinavianScotch-IrishScottishSeminoleSenegaleseSerbianShoshoneSierra LeoneanSiouxSlavicSlovakSloveneSomaliSouth AfricanSouth AmericanSouth American IndianSoviet UnionSpaniardSpanishSpanish AmericanSri LankanSubsaharan AfricanSudaneseSwedishSwissSyrianTaiwaneseThaiTonganTrinidadian and TobagonianTurkishU.S. Virgin IslanderUgandanUkrainianUruguayanVenezuelanVietnameseWelshWest IndianYaquiYugoslavianZimbabwean
Ancestry (Percentage)
AfghanAfricanAlbanianAmericanApacheArabArgentineanArmenianAssyrian / Chaldean / SyriacAustralianAustrianBahamianBangladeshiBarbadianBasqueBelgianBelizeanBermudanBhutaneseBlackfeetBolivianBrazilianBritishBritish West IndianBulgarianBurmeseCajunCambodianCanadianCape VerdeanCarpatho RusynCelticCentral AmericanCentral American IndianCherokeeChickasawChileanChippewaChoctawColombianComancheCosta RicanCreeCreekCroatianCubanCypriotCzechCzechoslovakianDanishDominicanDutchEastern EuropeanEcuadorianEgyptianEnglishEstonianEthiopianEuropeanFilipinoFinnishFrenchFrench American IndianFrench CanadianGermanGerman RussianGhanaianGreekGuamanian / ChamorroGuatemalanGuyaneseHaitianHmongHonduranHopiHungarianIcelanderIndian (Asian)IndonesianInupiatIranianIraqiIrishIroquoisIsraeliItalianJamaicanJapaneseJordanianKenyanKiowaKoreanLaotianLatvianLebaneseLiberianLithuanianLumbeeLuxembourgerMacedonianMalaysianMalteseMenomineeMexicanMexican American IndianMongolianMoroccanNative HawaiianNavajoNew ZealanderNicaraguanNigerianNorthern EuropeanNorwegianOkinawanOsageOttawaPaiutePakistaniPalestinianPanamanianParaguayanPennsylvania GermanPeruvianPolishPortuguesePotawatomiPuebloPuerto RicanPuget Sound SalishRomanianRussianSalvadoranSamoanScandinavianScotch-IrishScottishSeminoleSenegaleseSerbianShoshoneSierra LeoneanSiouxSlavicSlovakSloveneSomaliSouth AfricanSouth AmericanSouth American IndianSoviet UnionSpaniardSpanishSpanish AmericanSri LankanSubsaharan AfricanSudaneseSwedishSwissSyrianTaiwaneseThaiTonganTrinidadian and TobagonianTurkishU.S. Virgin IslanderUgandanUkrainianUruguayanVenezuelanVietnameseWelshWest IndianYaquiYugoslavianZimbabwean
Immigrant Origin (Total)
AfghanistanAfricaAlbaniaArgentinaArmeniaAsiaAustraliaAustriaBahamasBangladeshBarbadosBelarusBelgiumBelizeBoliviaBosnia and HerzegovinaBrazilBulgariaBurma / MyanmarCambodiaCameroonCanadaCaribbeanCentral AmericaChileChinaColombiaCongoCosta RicaCroatiaCubaCzechoslovakiaDenmarkDominicaDominican RepublicEastern AfricaEastern AsiaEastern EuropeEcuadorEgyptEl SalvadorEnglandEritreaEthiopiaEuropeFijiFranceGermanyGhanaGreeceGuatemalaGuyanaHaitiHondurasHong KongHungaryIndiaIndonesiaIranIraqIrelandIsraelItalyJamaicaJapanJordanKazakhstanKenyaKoreaKuwaitLaosLatin AmericaLatviaLebanonLiberiaLithuaniaMalaysiaMexicoMiddle AfricaMoldovaMoroccoNepalNetherlandsNicaraguaNigeriaNorth MacedoniaNorthern AfricaNorthern EuropeNorwayOceaniaPakistanPanamaPeruPhilippinesPolandPortugalRomaniaRussiaSaudi ArabiaScotlandSenegalSerbiaSierra LeoneSingaporeSomaliaSouth AfricaSouth AmericaSouth Central AsiaSouth Eastern AsiaSouthern EuropeSpainSri LankaSudanSwedenSwitzerlandSyriaTaiwanThailandTrinidad and TobagoTurkeyUgandaUkraineUruguayUzbekistanVenezuelaVietnamWest IndiesWestern AfricaWestern AsiaWestern EuropeYemenZaireZimbabwe
Immigrant Origin (Percentage)
AfghanistanAfricaAlbaniaArgentinaArmeniaAsiaAustraliaAustriaBahamasBangladeshBarbadosBelarusBelgiumBelizeBoliviaBosnia and HerzegovinaBrazilBulgariaBurma / MyanmarCambodiaCameroonCanadaCaribbeanCentral AmericaChileChinaColombiaCongoCosta RicaCroatiaCubaCzechoslovakiaDenmarkDominicaDominican RepublicEastern AfricaEastern AsiaEastern EuropeEcuadorEgyptEl SalvadorEnglandEritreaEthiopiaEuropeFijiFranceGermanyGhanaGreeceGuatemalaGuyanaHaitiHondurasHong KongHungaryIndiaIndonesiaIranIraqIrelandIsraelItalyJamaicaJapanJordanKazakhstanKenyaKoreaKuwaitLaosLatin AmericaLatviaLebanonLiberiaLithuaniaMalaysiaMexicoMiddle AfricaMoldovaMoroccoNepalNetherlandsNicaraguaNigeriaNorth MacedoniaNorthern AfricaNorthern EuropeNorwayOceaniaPakistanPanamaPeruPhilippinesPolandPortugalRomaniaRussiaSaudi ArabiaScotlandSenegalSerbiaSierra LeoneSingaporeSomaliaSouth AfricaSouth AmericaSouth Central AsiaSouth Eastern AsiaSouthern EuropeSpainSri LankaSudanSwedenSwitzerlandSyriaTaiwanThailandTrinidad and TobagoTurkeyUgandaUkraineUruguayUzbekistanVenezuelaVietnamWest IndiesWestern AfricaWestern AsiaWestern EuropeYemenZaireZimbabwe
Income
Income (Families)
Income (Households)
Poverty
Poverty (Families)
Unemployment
Employment Occupations
Employment Industries
Employer Class
Commute Time
Commute Means
School Enrollment
Education by Degree Field
Occupancy
Finances
Physical Characteristics
Chicago
Compare Zip Codes
Comparison Subject

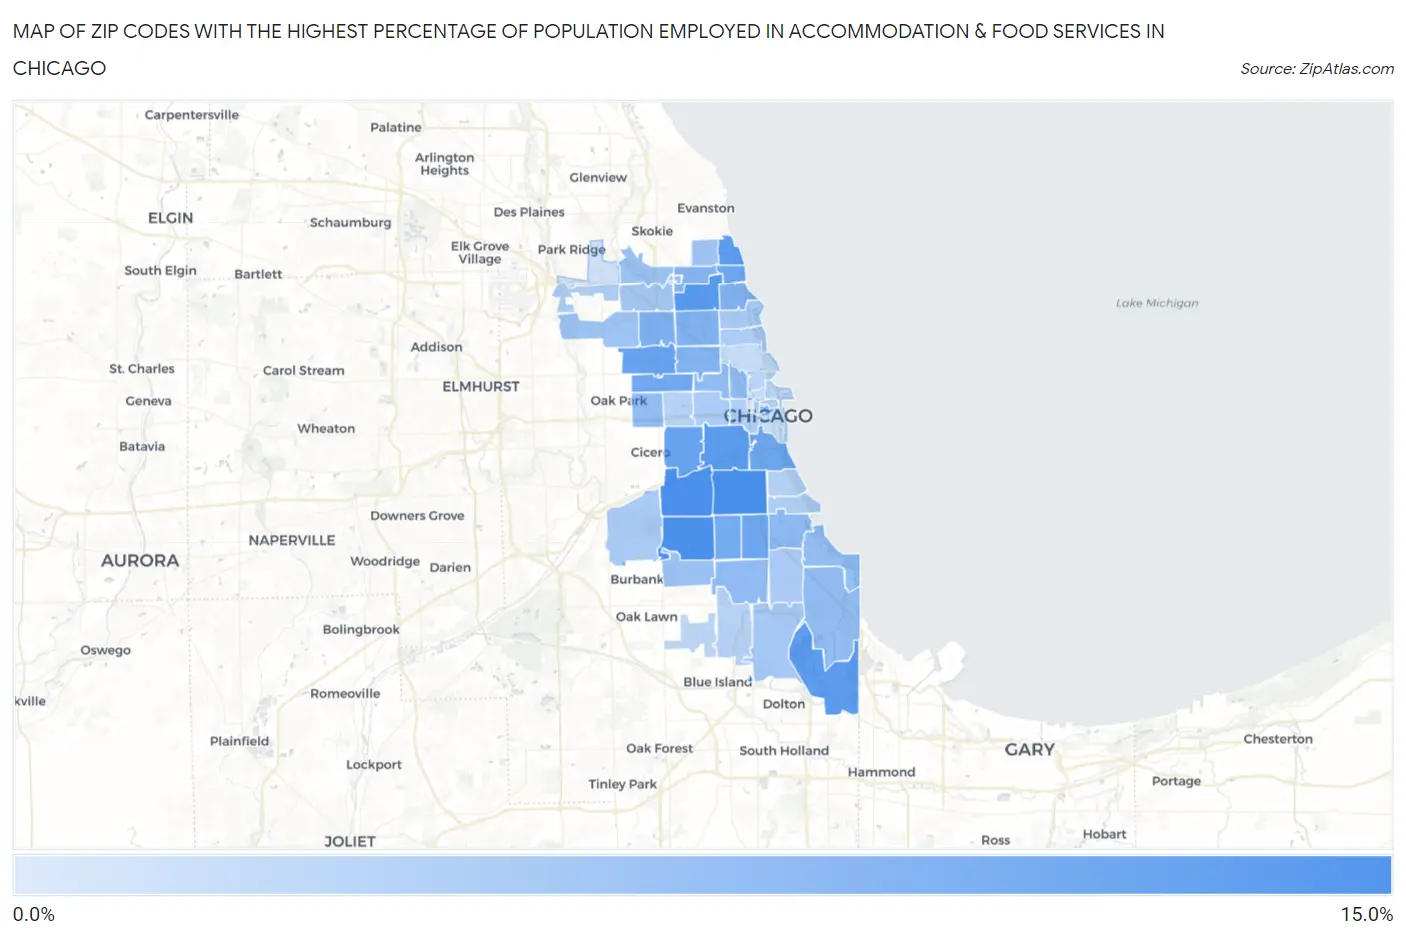
Map of Zip Codes with the Highest Percentage of Population Employed in Accommodation & Food Services in Chicago

0.0%
15.0%
Zip Codes with the Highest Percentage of Population Employed in Accommodation & Food Services in Chicago Map

Zip Codes with the Highest Percentage of Population Employed in Accommodation & Food Services in Chicago, IL

Zip Code % Employed vs State vs National
1.6060912.2%6.5%(+5.71)#716.9%(+5.30)#2,733
2.6063212.0%6.5%(+5.50)#746.9%(+5.09)#2,851
3.6062911.9%6.5%(+5.43)#776.9%(+5.02)#2,907
4.6062510.9%6.5%(+4.48)#956.9%(+4.07)#3,595
5.6060810.6%6.5%(+4.15)#1116.9%(+3.74)#3,865
6.6062610.6%6.5%(+4.11)#1136.9%(+3.70)#3,903
7.6063310.5%6.5%(+4.05)#1166.9%(+3.64)#3,977
8.606239.8%6.5%(+3.35)#1396.9%(+2.93)#4,773
9.606399.8%6.5%(+3.31)#1426.9%(+2.89)#4,822
10.606609.4%6.5%(+2.92)#1586.9%(+2.51)#5,370
11.606219.4%6.5%(+2.91)#1596.9%(+2.50)#5,379
12.606169.3%6.5%(+2.83)#1646.9%(+2.42)#5,503
13.606519.2%6.5%(+2.71)#1716.9%(+2.30)#5,687
14.606368.9%6.5%(+2.42)#1916.9%(+2.01)#6,132
15.606418.2%6.5%(+1.71)#2566.9%(+1.30)#7,458
16.606188.0%6.5%(+1.55)#2696.9%(+1.14)#7,774
17.606408.0%6.5%(+1.50)#2746.9%(+1.08)#7,889
18.606477.9%6.5%(+1.40)#2846.9%(+0.993)#8,090
19.606597.7%6.5%(+1.21)#3116.9%(+0.795)#8,560
20.606377.1%6.5%(+0.592)#3676.9%(+0.180)#10,149
21.606427.0%6.5%(+0.481)#3786.9%(+0.070)#10,467
22.606206.9%6.5%(+0.417)#3896.9%(+0.006)#10,624
23.606226.8%6.5%(+0.339)#3966.9%(-0.073)#10,859
24.606446.8%6.5%(+0.303)#4026.9%(-0.108)#10,976
25.606176.8%6.5%(+0.294)#4046.9%(-0.118)#11,005
26.606496.6%6.5%(+0.111)#4286.9%(-0.300)#11,575
27.606526.3%6.5%(-0.184)#4576.9%(-0.595)#12,533
28.606465.9%6.5%(-0.538)#5076.9%(-0.949)#13,668
29.606345.9%6.5%(-0.579)#5136.9%(-0.990)#13,800
30.606455.7%6.5%(-0.756)#5376.9%(-1.17)#14,350
31.606305.5%6.5%(-0.963)#5736.9%(-1.37)#15,031
32.606285.5%6.5%(-0.977)#5766.9%(-1.39)#15,075
33.606135.3%6.5%(-1.15)#6006.9%(-1.56)#15,698
34.606195.1%6.5%(-1.35)#6376.9%(-1.76)#16,392
35.606385.1%6.5%(-1.39)#6466.9%(-1.80)#16,528
36.606125.0%6.5%(-1.44)#6576.9%(-1.85)#16,731
37.606575.0%6.5%(-1.47)#6636.9%(-1.88)#16,842
38.606564.8%6.5%(-1.64)#6946.9%(-2.05)#17,372
39.606014.6%6.5%(-1.83)#7216.9%(-2.24)#18,029
40.606074.6%6.5%(-1.85)#7236.9%(-2.26)#18,094
41.606154.6%6.5%(-1.87)#7276.9%(-2.28)#18,170
42.606534.3%6.5%(-2.18)#7756.9%(-2.59)#19,217
43.606244.3%6.5%(-2.19)#7776.9%(-2.60)#19,253
44.606114.2%6.5%(-2.30)#7986.9%(-2.71)#19,599
45.606434.1%6.5%(-2.34)#8076.9%(-2.75)#19,736
46.606104.0%6.5%(-2.44)#8286.9%(-2.85)#20,051
47.606553.8%6.5%(-2.69)#8666.9%(-3.10)#20,847
48.606063.7%6.5%(-2.75)#8806.9%(-3.16)#21,051
49.606143.2%6.5%(-3.25)#9636.9%(-3.66)#22,652
50.606053.1%6.5%(-3.34)#9726.9%(-3.75)#22,870
51.606542.9%6.5%(-3.57)#1,0016.9%(-3.99)#23,509
52.606312.4%6.5%(-4.03)#1,0586.9%(-4.44)#24,623
53.606032.2%6.5%(-4.24)#1,0876.9%(-4.65)#25,079
54.606611.7%6.5%(-4.78)#1,1426.9%(-5.19)#26,136

Common Questions

What are the Top 10 Zip Codes with the Highest Percentage of Population Employed in Accommodation & Food Services in Chicago, IL?
Top 10 Zip Codes with the Highest Percentage of Population Employed in Accommodation & Food Services in Chicago, IL are:
#1
12.2%
#2
12.0%
#3
11.9%
#4
10.9%
#5
10.6%
#6
10.6%
#7
10.5%
#8
9.8%
#9
9.8%
#10
9.4%
What zip code has the Highest Percentage of Population Employed in Accommodation & Food Services in Chicago, IL?
60609 has the Highest Percentage of Population Employed in Accommodation & Food Services in Chicago, IL with 12.2%.
What is the Percentage of Population Employed in Accommodation & Food Services in Chicago, IL?
Percentage of Population Employed in Accommodation & Food Services in Chicago is 7.1%.
What is the Percentage of Population Employed in Accommodation & Food Services in Illinois?
Percentage of Population Employed in Accommodation & Food Services in Illinois is 6.5%.
What is the Percentage of Population Employed in Accommodation & Food Services in the United States?
Percentage of Population Employed in Accommodation & Food Services in the United States is 6.9%.