Zip Codes with the Highest Percentage of Population Employed in Food Preparation & Serving in Chicago, IL
RELATED REPORTS & OPTIONS
Food Preparation & Serving
Chicago
Compare Zip Codes
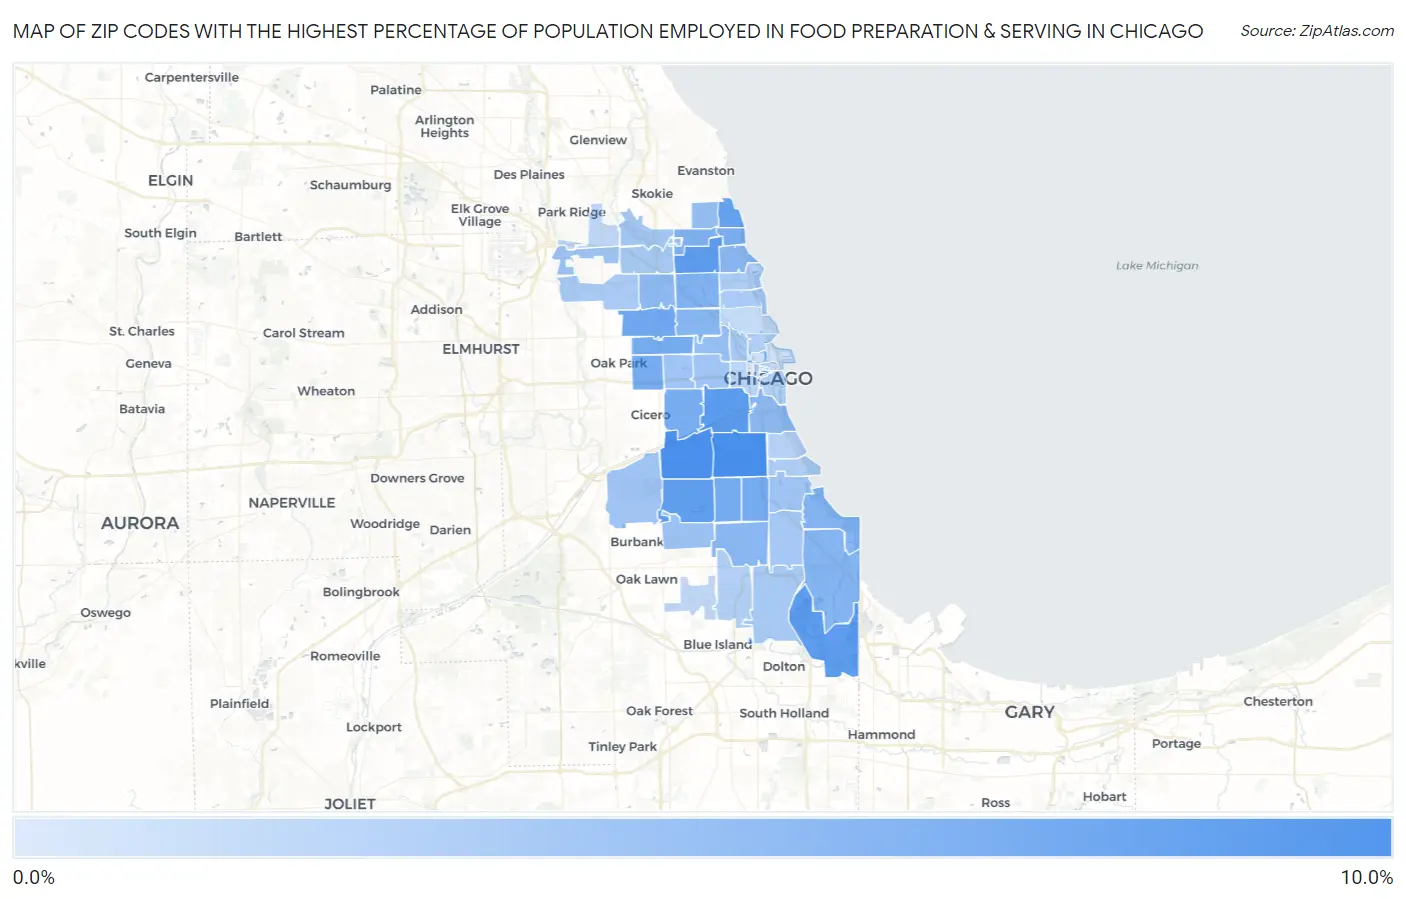
Map of Zip Codes with the Highest Percentage of Population Employed in Food Preparation & Serving in Chicago
0.0%
10.0%
Zip Codes with the Highest Percentage of Population Employed in Food Preparation & Serving in Chicago, IL
| Zip Code | % Employed | vs State | vs National | |
| 1. | 60609 | 10.0% | 5.0%(+4.93)#103 | 5.3%(+4.68)#2,661 |
| 2. | 60632 | 9.7% | 5.0%(+4.71)#112 | 5.3%(+4.46)#2,848 |
| 3. | 60608 | 8.6% | 5.0%(+3.61)#160 | 5.3%(+3.36)#3,917 |
| 4. | 60625 | 8.4% | 5.0%(+3.38)#171 | 5.3%(+3.13)#4,152 |
| 5. | 60633 | 8.4% | 5.0%(+3.33)#174 | 5.3%(+3.08)#4,224 |
| 6. | 60629 | 8.3% | 5.0%(+3.30)#175 | 5.3%(+3.05)#4,249 |
| 7. | 60626 | 8.0% | 5.0%(+2.92)#192 | 5.3%(+2.67)#4,794 |
| 8. | 60639 | 7.2% | 5.0%(+2.14)#248 | 5.3%(+1.89)#6,178 |
| 9. | 60636 | 7.0% | 5.0%(+1.95)#269 | 5.3%(+1.70)#6,599 |
| 10. | 60651 | 7.0% | 5.0%(+1.92)#274 | 5.3%(+1.67)#6,667 |
| 11. | 60621 | 6.9% | 5.0%(+1.91)#275 | 5.3%(+1.66)#6,691 |
| 12. | 60644 | 6.7% | 5.0%(+1.72)#298 | 5.3%(+1.46)#7,200 |
| 13. | 60623 | 6.7% | 5.0%(+1.67)#309 | 5.3%(+1.41)#7,341 |
| 14. | 60660 | 6.4% | 5.0%(+1.37)#347 | 5.3%(+1.12)#8,129 |
| 15. | 60618 | 6.2% | 5.0%(+1.13)#369 | 5.3%(+0.881)#8,828 |
| 16. | 60659 | 6.1% | 5.0%(+1.10)#373 | 5.3%(+0.848)#8,920 |
| 17. | 60617 | 5.9% | 5.0%(+0.881)#405 | 5.3%(+0.630)#9,619 |
| 18. | 60649 | 5.9% | 5.0%(+0.864)#407 | 5.3%(+0.612)#9,691 |
| 19. | 60647 | 5.7% | 5.0%(+0.618)#448 | 5.3%(+0.366)#10,510 |
| 20. | 60640 | 5.6% | 5.0%(+0.519)#464 | 5.3%(+0.267)#10,881 |
| 21. | 60620 | 5.5% | 5.0%(+0.500)#468 | 5.3%(+0.249)#10,943 |
| 22. | 60616 | 5.4% | 5.0%(+0.386)#487 | 5.3%(+0.135)#11,336 |
| 23. | 60641 | 5.3% | 5.0%(+0.230)#510 | 5.3%(-0.021)#11,880 |
| 24. | 60622 | 4.9% | 5.0%(-0.161)#585 | 5.3%(-0.413)#13,469 |
| 25. | 60645 | 4.8% | 5.0%(-0.232)#597 | 5.3%(-0.484)#13,759 |
| 26. | 60652 | 4.5% | 5.0%(-0.563)#652 | 5.3%(-0.814)#15,139 |
| 27. | 60612 | 4.2% | 5.0%(-0.863)#696 | 5.3%(-1.11)#16,428 |
| 28. | 60624 | 4.2% | 5.0%(-0.877)#702 | 5.3%(-1.13)#16,484 |
| 29. | 60656 | 4.1% | 5.0%(-0.889)#703 | 5.3%(-1.14)#16,514 |
| 30. | 60638 | 4.1% | 5.0%(-0.950)#714 | 5.3%(-1.20)#16,772 |
| 31. | 60637 | 4.0% | 5.0%(-0.985)#724 | 5.3%(-1.24)#16,939 |
| 32. | 60646 | 3.9% | 5.0%(-1.17)#756 | 5.3%(-1.42)#17,669 |
| 33. | 60619 | 3.8% | 5.0%(-1.19)#759 | 5.3%(-1.44)#17,746 |
| 34. | 60642 | 3.8% | 5.0%(-1.27)#772 | 5.3%(-1.52)#18,063 |
| 35. | 60628 | 3.7% | 5.0%(-1.34)#787 | 5.3%(-1.59)#18,385 |
| 36. | 60630 | 3.6% | 5.0%(-1.41)#802 | 5.3%(-1.66)#18,688 |
| 37. | 60634 | 3.5% | 5.0%(-1.52)#820 | 5.3%(-1.77)#19,151 |
| 38. | 60657 | 3.5% | 5.0%(-1.53)#823 | 5.3%(-1.78)#19,162 |
| 39. | 60613 | 3.4% | 5.0%(-1.68)#856 | 5.3%(-1.93)#19,788 |
| 40. | 60615 | 3.2% | 5.0%(-1.79)#877 | 5.3%(-2.04)#20,315 |
| 41. | 60610 | 3.0% | 5.0%(-1.99)#920 | 5.3%(-2.24)#21,084 |
| 42. | 60605 | 3.0% | 5.0%(-2.07)#935 | 5.3%(-2.32)#21,409 |
| 43. | 60643 | 2.9% | 5.0%(-2.16)#953 | 5.3%(-2.41)#21,760 |
| 44. | 60653 | 2.7% | 5.0%(-2.36)#993 | 5.3%(-2.62)#22,532 |
| 45. | 60607 | 2.5% | 5.0%(-2.50)#1,020 | 5.3%(-2.75)#23,056 |
| 46. | 60606 | 2.5% | 5.0%(-2.56)#1,027 | 5.3%(-2.81)#23,226 |
| 47. | 60603 | 2.2% | 5.0%(-2.80)#1,062 | 5.3%(-3.05)#24,001 |
| 48. | 60631 | 2.1% | 5.0%(-2.89)#1,075 | 5.3%(-3.14)#24,280 |
| 49. | 60655 | 2.1% | 5.0%(-2.94)#1,084 | 5.3%(-3.19)#24,395 |
| 50. | 60601 | 2.1% | 5.0%(-2.96)#1,086 | 5.3%(-3.21)#24,482 |
| 51. | 60614 | 1.8% | 5.0%(-3.22)#1,119 | 5.3%(-3.47)#25,227 |
| 52. | 60611 | 1.3% | 5.0%(-3.69)#1,178 | 5.3%(-3.94)#26,313 |
| 53. | 60654 | 1.2% | 5.0%(-3.86)#1,200 | 5.3%(-4.11)#26,642 |
| 54. | 60661 | 0.37% | 5.0%(-4.66)#1,248 | 5.3%(-4.92)#27,800 |
1
Common Questions
What are the Top 10 Zip Codes with the Highest Percentage of Population Employed in Food Preparation & Serving in Chicago, IL?
Top 10 Zip Codes with the Highest Percentage of Population Employed in Food Preparation & Serving in Chicago, IL are:
What zip code has the Highest Percentage of Population Employed in Food Preparation & Serving in Chicago, IL?
60609 has the Highest Percentage of Population Employed in Food Preparation & Serving in Chicago, IL with 10.0%.
What is the Percentage of Population Employed in Food Preparation & Serving in Chicago, IL?
Percentage of Population Employed in Food Preparation & Serving in Chicago is 5.1%.
What is the Percentage of Population Employed in Food Preparation & Serving in Illinois?
Percentage of Population Employed in Food Preparation & Serving in Illinois is 5.0%.
What is the Percentage of Population Employed in Food Preparation & Serving in the United States?
Percentage of Population Employed in Food Preparation & Serving in the United States is 5.3%.