Zip Codes with the Highest Percentage of Households Without a Vehicle in Chicago, IL
RELATED REPORTS & OPTIONS
Households without a Cars
Chicago
Compare Zip Codes
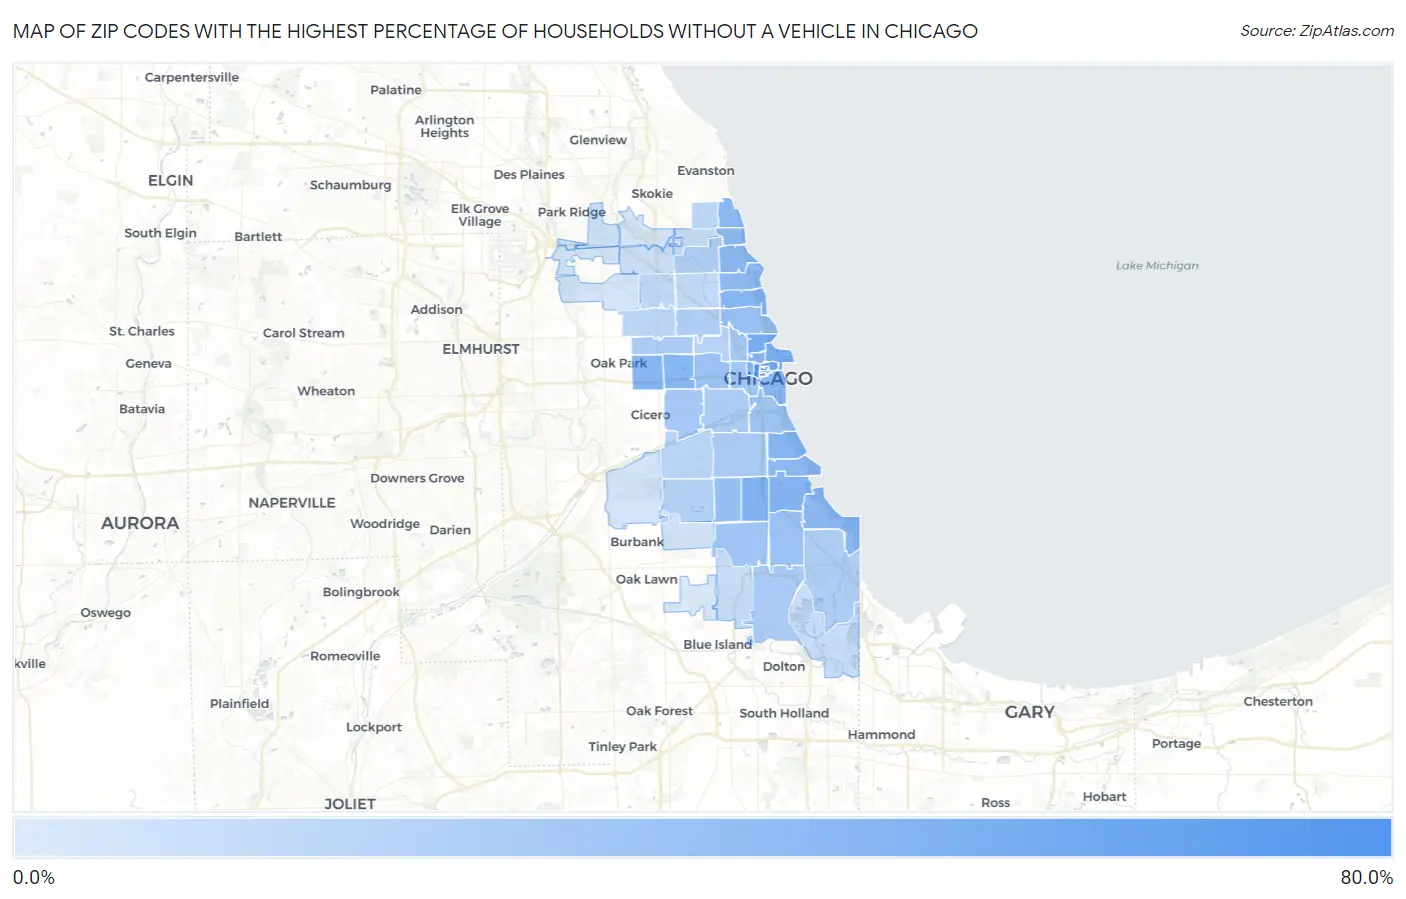
Map of Zip Codes with the Highest Percentage of Households Without a Vehicle in Chicago
0.0%
80.0%
Zip Codes with the Highest Percentage of Households Without a Vehicle in Chicago, IL
| Zip Code | Housholds Without a Car | vs State | vs National | |
| 1. | 60602 | 75.0% | 10.8%(+64.2)#3 | 8.3%(+66.7)#161 |
| 2. | 60606 | 64.6% | 10.8%(+53.8)#5 | 8.3%(+56.3)#239 |
| 3. | 60601 | 50.1% | 10.8%(+39.3)#7 | 8.3%(+41.8)#342 |
| 4. | 60610 | 48.1% | 10.8%(+37.3)#9 | 8.3%(+39.8)#362 |
| 5. | 60611 | 44.4% | 10.8%(+33.6)#12 | 8.3%(+36.1)#413 |
| 6. | 60654 | 43.6% | 10.8%(+32.8)#13 | 8.3%(+35.3)#433 |
| 7. | 60621 | 43.2% | 10.8%(+32.4)#14 | 8.3%(+34.9)#444 |
| 8. | 60637 | 41.2% | 10.8%(+30.4)#15 | 8.3%(+32.9)#489 |
| 9. | 60657 | 40.3% | 10.8%(+29.5)#16 | 8.3%(+32.0)#504 |
| 10. | 60644 | 39.9% | 10.8%(+29.1)#18 | 8.3%(+31.6)#516 |
| 11. | 60624 | 39.5% | 10.8%(+28.7)#19 | 8.3%(+31.2)#520 |
| 12. | 60653 | 39.5% | 10.8%(+28.7)#20 | 8.3%(+31.2)#521 |
| 13. | 60661 | 39.5% | 10.8%(+28.7)#21 | 8.3%(+31.2)#522 |
| 14. | 60605 | 39.0% | 10.8%(+28.2)#23 | 8.3%(+30.7)#536 |
| 15. | 60640 | 38.3% | 10.8%(+27.5)#24 | 8.3%(+30.0)#555 |
| 16. | 60626 | 38.2% | 10.8%(+27.4)#25 | 8.3%(+29.9)#557 |
| 17. | 60649 | 37.9% | 10.8%(+27.1)#26 | 8.3%(+29.6)#562 |
| 18. | 60603 | 37.7% | 10.8%(+26.9)#27 | 8.3%(+29.4)#570 |
| 19. | 60660 | 37.5% | 10.8%(+26.7)#28 | 8.3%(+29.2)#576 |
| 20. | 60613 | 36.9% | 10.8%(+26.1)#29 | 8.3%(+28.6)#594 |
| 21. | 60615 | 36.2% | 10.8%(+25.4)#30 | 8.3%(+27.9)#612 |
| 22. | 60604 | 35.6% | 10.8%(+24.8)#31 | 8.3%(+27.3)#624 |
| 23. | 60636 | 32.0% | 10.8%(+21.2)#34 | 8.3%(+23.7)#726 |
| 24. | 60614 | 31.8% | 10.8%(+21.0)#35 | 8.3%(+23.5)#732 |
| 25. | 60612 | 31.5% | 10.8%(+20.7)#36 | 8.3%(+23.2)#745 |
| 26. | 60619 | 31.4% | 10.8%(+20.6)#37 | 8.3%(+23.1)#751 |
| 27. | 60616 | 29.1% | 10.8%(+18.3)#41 | 8.3%(+20.8)#838 |
| 28. | 60620 | 27.9% | 10.8%(+17.1)#42 | 8.3%(+19.6)#890 |
| 29. | 60607 | 26.9% | 10.8%(+16.1)#44 | 8.3%(+18.6)#943 |
| 30. | 60623 | 26.4% | 10.8%(+15.6)#45 | 8.3%(+18.1)#973 |
| 31. | 60642 | 26.2% | 10.8%(+15.4)#46 | 8.3%(+17.9)#982 |
| 32. | 60651 | 24.2% | 10.8%(+13.4)#50 | 8.3%(+15.9)#1,115 |
| 33. | 60628 | 24.1% | 10.8%(+13.3)#51 | 8.3%(+15.8)#1,125 |
| 34. | 60609 | 24.0% | 10.8%(+13.2)#52 | 8.3%(+15.7)#1,135 |
| 35. | 60608 | 23.0% | 10.8%(+12.2)#53 | 8.3%(+14.7)#1,213 |
| 36. | 60617 | 21.9% | 10.8%(+11.1)#59 | 8.3%(+13.6)#1,303 |
| 37. | 60647 | 21.0% | 10.8%(+10.2)#62 | 8.3%(+12.7)#1,392 |
| 38. | 60625 | 20.6% | 10.8%(+9.80)#63 | 8.3%(+12.3)#1,425 |
| 39. | 60629 | 19.5% | 10.8%(+8.70)#70 | 8.3%(+11.2)#1,562 |
| 40. | 60622 | 19.2% | 10.8%(+8.40)#72 | 8.3%(+10.9)#1,602 |
| 41. | 60632 | 17.0% | 10.8%(+6.20)#78 | 8.3%(+8.70)#1,952 |
| 42. | 60639 | 16.2% | 10.8%(+5.40)#82 | 8.3%(+7.90)#2,100 |
| 43. | 60645 | 15.1% | 10.8%(+4.30)#92 | 8.3%(+6.80)#2,352 |
| 44. | 60641 | 14.3% | 10.8%(+3.50)#98 | 8.3%(+6.00)#2,582 |
| 45. | 60618 | 13.8% | 10.8%(+3.00)#104 | 8.3%(+5.50)#2,761 |
| 46. | 60659 | 12.0% | 10.8%(+1.20)#131 | 8.3%(+3.70)#3,546 |
| 47. | 60643 | 11.4% | 10.8%(+0.600)#138 | 8.3%(+3.10)#3,875 |
| 48. | 60633 | 11.4% | 10.8%(+0.600)#140 | 8.3%(+3.10)#3,897 |
| 49. | 60631 | 9.6% | 10.8%(-1.20)#191 | 8.3%(+1.30)#5,192 |
| 50. | 60630 | 9.5% | 10.8%(-1.30)#194 | 8.3%(+1.20)#5,248 |
| 51. | 60652 | 7.8% | 10.8%(-3.00)#272 | 8.3%(-0.500)#7,212 |
| 52. | 60634 | 7.5% | 10.8%(-3.30)#290 | 8.3%(-0.800)#7,672 |
| 53. | 60638 | 7.4% | 10.8%(-3.40)#295 | 8.3%(-0.900)#7,840 |
| 54. | 60656 | 7.0% | 10.8%(-3.80)#326 | 8.3%(-1.30)#8,551 |
| 55. | 60646 | 5.7% | 10.8%(-5.10)#449 | 8.3%(-2.60)#11,132 |
| 56. | 60655 | 3.9% | 10.8%(-6.90)#661 | 8.3%(-4.40)#16,017 |
1
Common Questions
What are the Top 10 Zip Codes with the Highest Percentage of Households Without a Vehicle in Chicago, IL?
Top 10 Zip Codes with the Highest Percentage of Households Without a Vehicle in Chicago, IL are:
What zip code has the Highest Percentage of Households Without a Vehicle in Chicago, IL?
60602 has the Highest Percentage of Households Without a Vehicle in Chicago, IL with 75.0%.
What is the Percentage of Households Without a Vehicle in Chicago, IL?
Percentage of Households Without a Vehicle in Chicago is 26.7%.
What is the Percentage of Households Without a Vehicle in Illinois?
Percentage of Households Without a Vehicle in Illinois is 10.8%.
What is the Percentage of Households Without a Vehicle in the United States?
Percentage of Households Without a Vehicle in the United States is 8.3%.