Zip Codes with the Highest Percentage of Population Employed in Health Diagnosing & Treating in Naperville, IL
RELATED REPORTS & OPTIONS
Health Diagnosing & Treating
Naperville
Compare Zip Codes
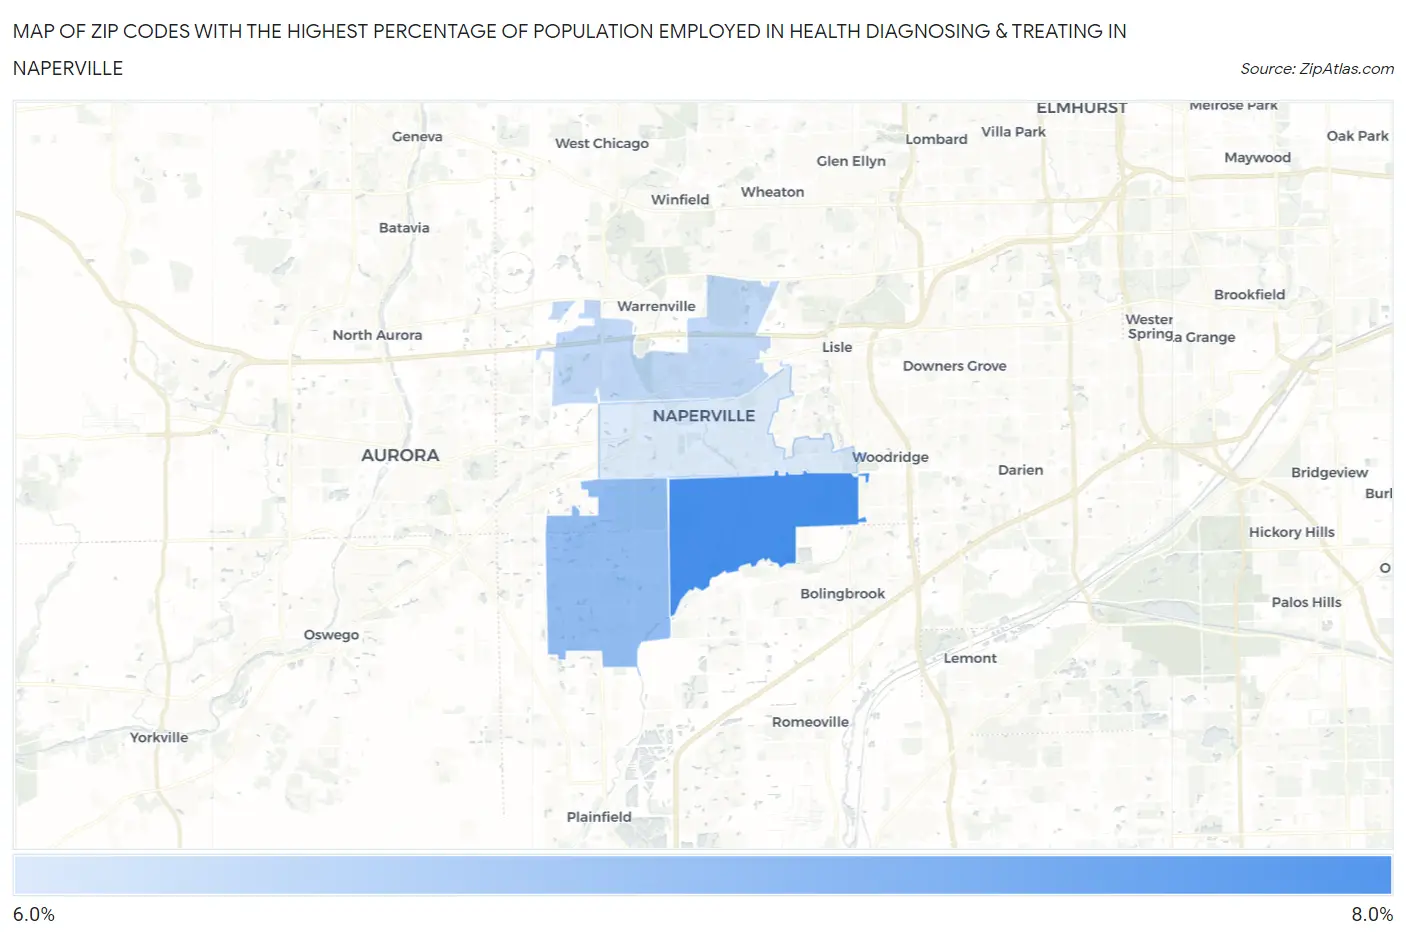
Map of Zip Codes with the Highest Percentage of Population Employed in Health Diagnosing & Treating in Naperville
0.0%
8.0%
Zip Codes with the Highest Percentage of Population Employed in Health Diagnosing & Treating in Naperville, IL
| Zip Code | % Employed | vs State | vs National | |
| 1. | 60565 | 7.7% | 6.2%(+1.46)#409 | 6.2%(+1.45)#8,248 |
| 2. | 60564 | 7.3% | 6.2%(+1.03)#455 | 6.2%(+1.03)#9,500 |
| 3. | 60563 | 7.0% | 6.2%(+0.782)#485 | 6.2%(+0.774)#10,307 |
| 4. | 60540 | 6.9% | 6.2%(+0.629)#508 | 6.2%(+0.620)#10,793 |
1
Common Questions
What are the Top 3 Zip Codes with the Highest Percentage of Population Employed in Health Diagnosing & Treating in Naperville, IL?
Top 3 Zip Codes with the Highest Percentage of Population Employed in Health Diagnosing & Treating in Naperville, IL are:
What zip code has the Highest Percentage of Population Employed in Health Diagnosing & Treating in Naperville, IL?
60565 has the Highest Percentage of Population Employed in Health Diagnosing & Treating in Naperville, IL with 7.7%.
What is the Percentage of Population Employed in Health Diagnosing & Treating in Naperville, IL?
Percentage of Population Employed in Health Diagnosing & Treating in Naperville is 7.1%.
What is the Percentage of Population Employed in Health Diagnosing & Treating in Illinois?
Percentage of Population Employed in Health Diagnosing & Treating in Illinois is 6.2%.
What is the Percentage of Population Employed in Health Diagnosing & Treating in the United States?
Percentage of Population Employed in Health Diagnosing & Treating in the United States is 6.2%.