Zip Codes with the Highest Percentage of Population Employed in Health Diagnosing & Treating in Evanston, IL
RELATED REPORTS & OPTIONS
Health Diagnosing & Treating
Evanston
Compare Zip Codes
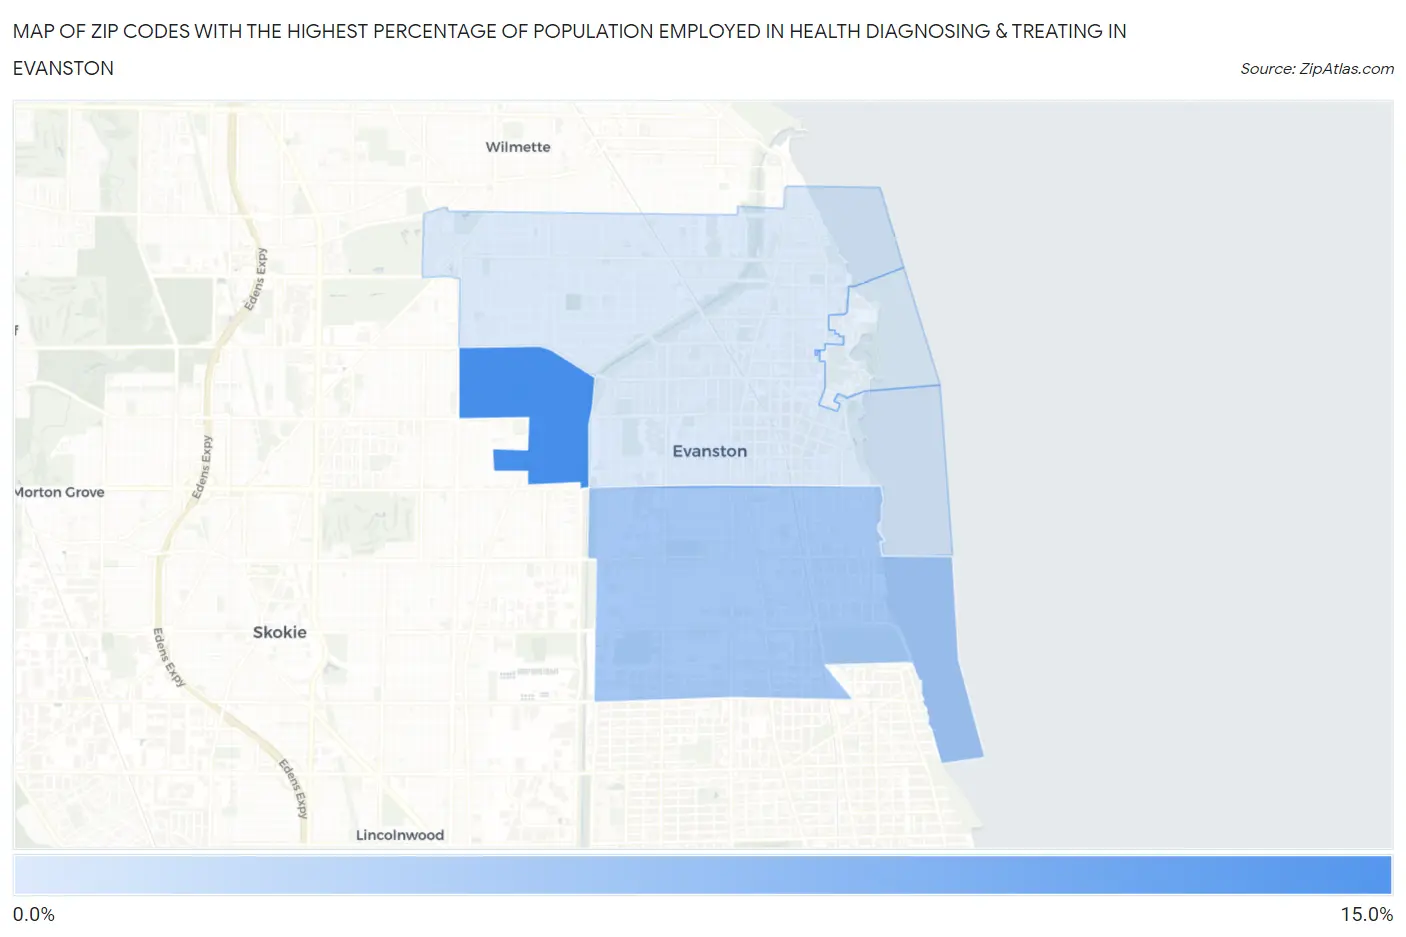
Map of Zip Codes with the Highest Percentage of Population Employed in Health Diagnosing & Treating in Evanston
0.0%
15.0%
Zip Codes with the Highest Percentage of Population Employed in Health Diagnosing & Treating in Evanston, IL
| Zip Code | % Employed | vs State | vs National | |
| 1. | 60203 | 11.0% | 6.2%(+4.78)#140 | 6.2%(+4.77)#2,881 |
| 2. | 60202 | 6.8% | 6.2%(+0.585)#514 | 6.2%(+0.576)#10,933 |
| 3. | 60201 | 4.5% | 6.2%(-1.77)#946 | 6.2%(-1.78)#19,768 |
1
Common Questions
What are the Top 3 Zip Codes with the Highest Percentage of Population Employed in Health Diagnosing & Treating in Evanston, IL?
Top 3 Zip Codes with the Highest Percentage of Population Employed in Health Diagnosing & Treating in Evanston, IL are:
What zip code has the Highest Percentage of Population Employed in Health Diagnosing & Treating in Evanston, IL?
60203 has the Highest Percentage of Population Employed in Health Diagnosing & Treating in Evanston, IL with 11.0%.
What is the Percentage of Population Employed in Health Diagnosing & Treating in Evanston, IL?
Percentage of Population Employed in Health Diagnosing & Treating in Evanston is 5.6%.
What is the Percentage of Population Employed in Health Diagnosing & Treating in Illinois?
Percentage of Population Employed in Health Diagnosing & Treating in Illinois is 6.2%.
What is the Percentage of Population Employed in Health Diagnosing & Treating in the United States?
Percentage of Population Employed in Health Diagnosing & Treating in the United States is 6.2%.