Zip Codes with the Highest Percentage of Population with a Degree in Liberal Arts and History in Chicago, IL
RELATED REPORTS & OPTIONS
Liberal Arts and History
Chicago
Compare Zip Codes
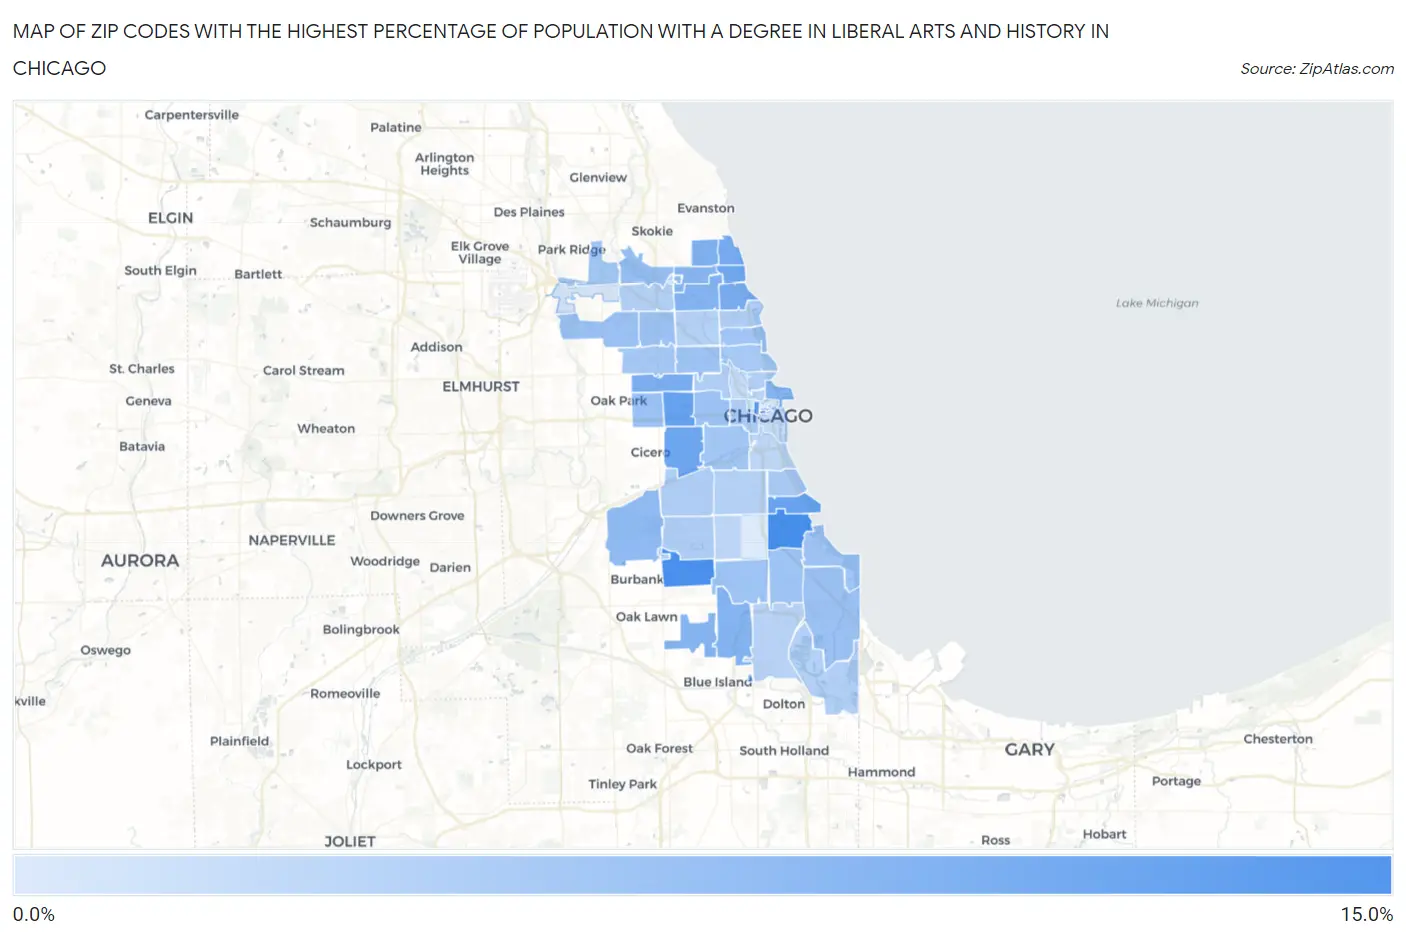
Map of Zip Codes with the Highest Percentage of Population with a Degree in Liberal Arts and History in Chicago
0.0%
15.0%
Zip Codes with the Highest Percentage of Population with a Degree in Liberal Arts and History in Chicago, IL
| Zip Code | % Graduates | vs State | vs National | |
| 1. | 60637 | 10.5% | 4.7%(+5.74)#104 | 4.9%(+5.58)#2,837 |
| 2. | 60652 | 10.3% | 4.7%(+5.61)#108 | 4.9%(+5.45)#2,918 |
| 3. | 60624 | 8.7% | 4.7%(+3.99)#149 | 4.9%(+3.83)#4,122 |
| 4. | 60615 | 8.4% | 4.7%(+3.71)#160 | 4.9%(+3.55)#4,413 |
| 5. | 60606 | 8.4% | 4.7%(+3.69)#161 | 4.9%(+3.53)#4,437 |
| 6. | 60623 | 8.2% | 4.7%(+3.46)#169 | 4.9%(+3.30)#4,689 |
| 7. | 60604 | 7.9% | 4.7%(+3.19)#183 | 4.9%(+3.03)#5,031 |
| 8. | 60660 | 7.8% | 4.7%(+3.09)#187 | 4.9%(+2.93)#5,171 |
| 9. | 60626 | 7.8% | 4.7%(+3.06)#192 | 4.9%(+2.90)#5,208 |
| 10. | 60651 | 7.4% | 4.7%(+2.73)#211 | 4.9%(+2.57)#5,682 |
| 11. | 60640 | 7.4% | 4.7%(+2.69)#216 | 4.9%(+2.53)#5,738 |
| 12. | 60645 | 7.1% | 4.7%(+2.35)#229 | 4.9%(+2.19)#6,283 |
| 13. | 60643 | 6.8% | 4.7%(+2.11)#245 | 4.9%(+1.95)#6,686 |
| 14. | 60625 | 6.8% | 4.7%(+2.08)#250 | 4.9%(+1.92)#6,766 |
| 15. | 60611 | 6.7% | 4.7%(+2.02)#258 | 4.9%(+1.86)#6,866 |
| 16. | 60655 | 6.7% | 4.7%(+1.95)#261 | 4.9%(+1.79)#7,005 |
| 17. | 60659 | 6.6% | 4.7%(+1.87)#270 | 4.9%(+1.71)#7,172 |
| 18. | 60638 | 6.2% | 4.7%(+1.47)#309 | 4.9%(+1.31)#8,065 |
| 19. | 60646 | 5.8% | 4.7%(+1.05)#346 | 4.9%(+0.890)#9,132 |
| 20. | 60617 | 5.6% | 4.7%(+0.900)#366 | 4.9%(+0.741)#9,538 |
| 21. | 60641 | 5.5% | 4.7%(+0.756)#385 | 4.9%(+0.597)#9,954 |
| 22. | 60644 | 5.5% | 4.7%(+0.748)#386 | 4.9%(+0.589)#9,973 |
| 23. | 60634 | 5.5% | 4.7%(+0.740)#388 | 4.9%(+0.581)#9,993 |
| 24. | 60612 | 5.4% | 4.7%(+0.690)#393 | 4.9%(+0.530)#10,129 |
| 25. | 60620 | 5.4% | 4.7%(+0.680)#397 | 4.9%(+0.520)#10,154 |
| 26. | 60619 | 5.4% | 4.7%(+0.652)#398 | 4.9%(+0.493)#10,222 |
| 27. | 60647 | 5.3% | 4.7%(+0.600)#406 | 4.9%(+0.441)#10,402 |
| 28. | 60657 | 5.2% | 4.7%(+0.511)#420 | 4.9%(+0.351)#10,669 |
| 29. | 60649 | 5.2% | 4.7%(+0.470)#422 | 4.9%(+0.310)#10,767 |
| 30. | 60631 | 5.1% | 4.7%(+0.366)#433 | 4.9%(+0.207)#11,103 |
| 31. | 60608 | 5.0% | 4.7%(+0.304)#438 | 4.9%(+0.145)#11,289 |
| 32. | 60639 | 5.0% | 4.7%(+0.286)#443 | 4.9%(+0.127)#11,366 |
| 33. | 60603 | 4.9% | 4.7%(+0.151)#455 | 4.9%(-0.009)#11,774 |
| 34. | 60614 | 4.8% | 4.7%(+0.037)#478 | 4.9%(-0.122)#12,159 |
| 35. | 60653 | 4.6% | 4.7%(-0.072)#487 | 4.9%(-0.232)#12,517 |
| 36. | 60607 | 4.6% | 4.7%(-0.115)#490 | 4.9%(-0.274)#12,651 |
| 37. | 60613 | 4.5% | 4.7%(-0.257)#505 | 4.9%(-0.416)#13,097 |
| 38. | 60629 | 4.4% | 4.7%(-0.320)#513 | 4.9%(-0.479)#13,313 |
| 39. | 60622 | 4.4% | 4.7%(-0.334)#515 | 4.9%(-0.493)#13,359 |
| 40. | 60632 | 4.4% | 4.7%(-0.347)#518 | 4.9%(-0.507)#13,407 |
| 41. | 60602 | 4.3% | 4.7%(-0.385)#524 | 4.9%(-0.544)#13,544 |
| 42. | 60610 | 4.3% | 4.7%(-0.438)#529 | 4.9%(-0.598)#13,727 |
| 43. | 60633 | 4.1% | 4.7%(-0.623)#562 | 4.9%(-0.782)#14,437 |
| 44. | 60609 | 4.0% | 4.7%(-0.666)#572 | 4.9%(-0.825)#14,598 |
| 45. | 60630 | 4.0% | 4.7%(-0.673)#574 | 4.9%(-0.832)#14,615 |
| 46. | 60618 | 4.0% | 4.7%(-0.674)#575 | 4.9%(-0.833)#14,631 |
| 47. | 60654 | 3.9% | 4.7%(-0.766)#588 | 4.9%(-0.925)#14,993 |
| 48. | 60628 | 3.9% | 4.7%(-0.799)#593 | 4.9%(-0.959)#15,128 |
| 49. | 60636 | 3.6% | 4.7%(-1.12)#631 | 4.9%(-1.27)#16,259 |
| 50. | 60616 | 3.5% | 4.7%(-1.19)#640 | 4.9%(-1.35)#16,499 |
| 51. | 60605 | 3.2% | 4.7%(-1.56)#688 | 4.9%(-1.72)#17,813 |
| 52. | 60642 | 3.1% | 4.7%(-1.64)#698 | 4.9%(-1.80)#18,097 |
| 53. | 60661 | 2.9% | 4.7%(-1.80)#733 | 4.9%(-1.96)#18,641 |
| 54. | 60601 | 2.4% | 4.7%(-2.34)#818 | 4.9%(-2.50)#20,342 |
| 55. | 60656 | 2.2% | 4.7%(-2.54)#842 | 4.9%(-2.70)#20,919 |
| 56. | 60621 | 1.8% | 4.7%(-2.88)#887 | 4.9%(-3.04)#21,779 |
1
Common Questions
What are the Top 10 Zip Codes with the Highest Percentage of Population with a Degree in Liberal Arts and History in Chicago, IL?
Top 10 Zip Codes with the Highest Percentage of Population with a Degree in Liberal Arts and History in Chicago, IL are:
What zip code has the Highest Percentage of Population with a Degree in Liberal Arts and History in Chicago, IL?
60637 has the Highest Percentage of Population with a Degree in Liberal Arts and History in Chicago, IL with 10.5%.
What is the Percentage of Population with a Degree in Liberal Arts and History in Chicago, IL?
Percentage of Population with a Degree in Liberal Arts and History in Chicago is 5.4%.
What is the Percentage of Population with a Degree in Liberal Arts and History in Illinois?
Percentage of Population with a Degree in Liberal Arts and History in Illinois is 4.7%.
What is the Percentage of Population with a Degree in Liberal Arts and History in the United States?
Percentage of Population with a Degree in Liberal Arts and History in the United States is 4.9%.