Zip Codes with the Lowest Poverty Level Among Children Under the Age of 5 in Chicago, IL

RELATED REPORTS & OPTIONS

Lowest Poverty | Child 0-5
Population
Families and Households
Female Fertility
Female Fertility (Unmarried)
Race (Community Size)
Race (Percentage)
Ancestry (Community Size)
AfghanAfricanAlbanianAmericanApacheArabArgentineanArmenianAssyrian / Chaldean / SyriacAustralianAustrianBahamianBangladeshiBarbadianBasqueBelgianBelizeanBermudanBhutaneseBlackfeetBolivianBrazilianBritishBritish West IndianBulgarianBurmeseCajunCambodianCanadianCape VerdeanCarpatho RusynCelticCentral AmericanCentral American IndianCherokeeChickasawChileanChippewaChoctawColombianComancheCosta RicanCreeCreekCroatianCubanCypriotCzechCzechoslovakianDanishDominicanDutchEastern EuropeanEcuadorianEgyptianEnglishEstonianEthiopianEuropeanFilipinoFinnishFrenchFrench American IndianFrench CanadianGermanGerman RussianGhanaianGreekGuamanian / ChamorroGuatemalanGuyaneseHaitianHmongHonduranHopiHungarianIcelanderIndian (Asian)IndonesianInupiatIranianIraqiIrishIroquoisIsraeliItalianJamaicanJapaneseJordanianKenyanKiowaKoreanLaotianLatvianLebaneseLiberianLithuanianLumbeeLuxembourgerMacedonianMalaysianMalteseMenomineeMexicanMexican American IndianMongolianMoroccanNative HawaiianNavajoNew ZealanderNicaraguanNigerianNorthern EuropeanNorwegianOkinawanOsageOttawaPaiutePakistaniPalestinianPanamanianParaguayanPennsylvania GermanPeruvianPolishPortuguesePotawatomiPuebloPuerto RicanPuget Sound SalishRomanianRussianSalvadoranSamoanScandinavianScotch-IrishScottishSeminoleSenegaleseSerbianShoshoneSierra LeoneanSiouxSlavicSlovakSloveneSomaliSouth AfricanSouth AmericanSouth American IndianSoviet UnionSpaniardSpanishSpanish AmericanSri LankanSubsaharan AfricanSudaneseSwedishSwissSyrianTaiwaneseThaiTonganTrinidadian and TobagonianTurkishU.S. Virgin IslanderUgandanUkrainianUruguayanVenezuelanVietnameseWelshWest IndianYaquiYugoslavianZimbabwean
Ancestry (Percentage)
AfghanAfricanAlbanianAmericanApacheArabArgentineanArmenianAssyrian / Chaldean / SyriacAustralianAustrianBahamianBangladeshiBarbadianBasqueBelgianBelizeanBermudanBhutaneseBlackfeetBolivianBrazilianBritishBritish West IndianBulgarianBurmeseCajunCambodianCanadianCape VerdeanCarpatho RusynCelticCentral AmericanCentral American IndianCherokeeChickasawChileanChippewaChoctawColombianComancheCosta RicanCreeCreekCroatianCubanCypriotCzechCzechoslovakianDanishDominicanDutchEastern EuropeanEcuadorianEgyptianEnglishEstonianEthiopianEuropeanFilipinoFinnishFrenchFrench American IndianFrench CanadianGermanGerman RussianGhanaianGreekGuamanian / ChamorroGuatemalanGuyaneseHaitianHmongHonduranHopiHungarianIcelanderIndian (Asian)IndonesianInupiatIranianIraqiIrishIroquoisIsraeliItalianJamaicanJapaneseJordanianKenyanKiowaKoreanLaotianLatvianLebaneseLiberianLithuanianLumbeeLuxembourgerMacedonianMalaysianMalteseMenomineeMexicanMexican American IndianMongolianMoroccanNative HawaiianNavajoNew ZealanderNicaraguanNigerianNorthern EuropeanNorwegianOkinawanOsageOttawaPaiutePakistaniPalestinianPanamanianParaguayanPennsylvania GermanPeruvianPolishPortuguesePotawatomiPuebloPuerto RicanPuget Sound SalishRomanianRussianSalvadoranSamoanScandinavianScotch-IrishScottishSeminoleSenegaleseSerbianShoshoneSierra LeoneanSiouxSlavicSlovakSloveneSomaliSouth AfricanSouth AmericanSouth American IndianSoviet UnionSpaniardSpanishSpanish AmericanSri LankanSubsaharan AfricanSudaneseSwedishSwissSyrianTaiwaneseThaiTonganTrinidadian and TobagonianTurkishU.S. Virgin IslanderUgandanUkrainianUruguayanVenezuelanVietnameseWelshWest IndianYaquiYugoslavianZimbabwean
Immigrant Origin (Total)
AfghanistanAfricaAlbaniaArgentinaArmeniaAsiaAustraliaAustriaBahamasBangladeshBarbadosBelarusBelgiumBelizeBoliviaBosnia and HerzegovinaBrazilBulgariaBurma / MyanmarCambodiaCameroonCanadaCaribbeanCentral AmericaChileChinaColombiaCongoCosta RicaCroatiaCubaCzechoslovakiaDenmarkDominicaDominican RepublicEastern AfricaEastern AsiaEastern EuropeEcuadorEgyptEl SalvadorEnglandEritreaEthiopiaEuropeFijiFranceGermanyGhanaGreeceGuatemalaGuyanaHaitiHondurasHong KongHungaryIndiaIndonesiaIranIraqIrelandIsraelItalyJamaicaJapanJordanKazakhstanKenyaKoreaKuwaitLaosLatin AmericaLatviaLebanonLiberiaLithuaniaMalaysiaMexicoMiddle AfricaMoldovaMoroccoNepalNetherlandsNicaraguaNigeriaNorth MacedoniaNorthern AfricaNorthern EuropeNorwayOceaniaPakistanPanamaPeruPhilippinesPolandPortugalRomaniaRussiaSaudi ArabiaScotlandSenegalSerbiaSierra LeoneSingaporeSomaliaSouth AfricaSouth AmericaSouth Central AsiaSouth Eastern AsiaSouthern EuropeSpainSri LankaSudanSwedenSwitzerlandSyriaTaiwanThailandTrinidad and TobagoTurkeyUgandaUkraineUruguayUzbekistanVenezuelaVietnamWest IndiesWestern AfricaWestern AsiaWestern EuropeYemenZaireZimbabwe
Immigrant Origin (Percentage)
AfghanistanAfricaAlbaniaArgentinaArmeniaAsiaAustraliaAustriaBahamasBangladeshBarbadosBelarusBelgiumBelizeBoliviaBosnia and HerzegovinaBrazilBulgariaBurma / MyanmarCambodiaCameroonCanadaCaribbeanCentral AmericaChileChinaColombiaCongoCosta RicaCroatiaCubaCzechoslovakiaDenmarkDominicaDominican RepublicEastern AfricaEastern AsiaEastern EuropeEcuadorEgyptEl SalvadorEnglandEritreaEthiopiaEuropeFijiFranceGermanyGhanaGreeceGuatemalaGuyanaHaitiHondurasHong KongHungaryIndiaIndonesiaIranIraqIrelandIsraelItalyJamaicaJapanJordanKazakhstanKenyaKoreaKuwaitLaosLatin AmericaLatviaLebanonLiberiaLithuaniaMalaysiaMexicoMiddle AfricaMoldovaMoroccoNepalNetherlandsNicaraguaNigeriaNorth MacedoniaNorthern AfricaNorthern EuropeNorwayOceaniaPakistanPanamaPeruPhilippinesPolandPortugalRomaniaRussiaSaudi ArabiaScotlandSenegalSerbiaSierra LeoneSingaporeSomaliaSouth AfricaSouth AmericaSouth Central AsiaSouth Eastern AsiaSouthern EuropeSpainSri LankaSudanSwedenSwitzerlandSyriaTaiwanThailandTrinidad and TobagoTurkeyUgandaUkraineUruguayUzbekistanVenezuelaVietnamWest IndiesWestern AfricaWestern AsiaWestern EuropeYemenZaireZimbabwe
Income
Income (Families)
Income (Households)
Poverty
Poverty (Families)
Unemployment
Employment Occupations
Employment Industries
Employer Class
Commute Time
Commute Means
School Enrollment
Education by Degree Field
Occupancy
Finances
Physical Characteristics
Chicago
Compare Zip Codes
Comparison Subject

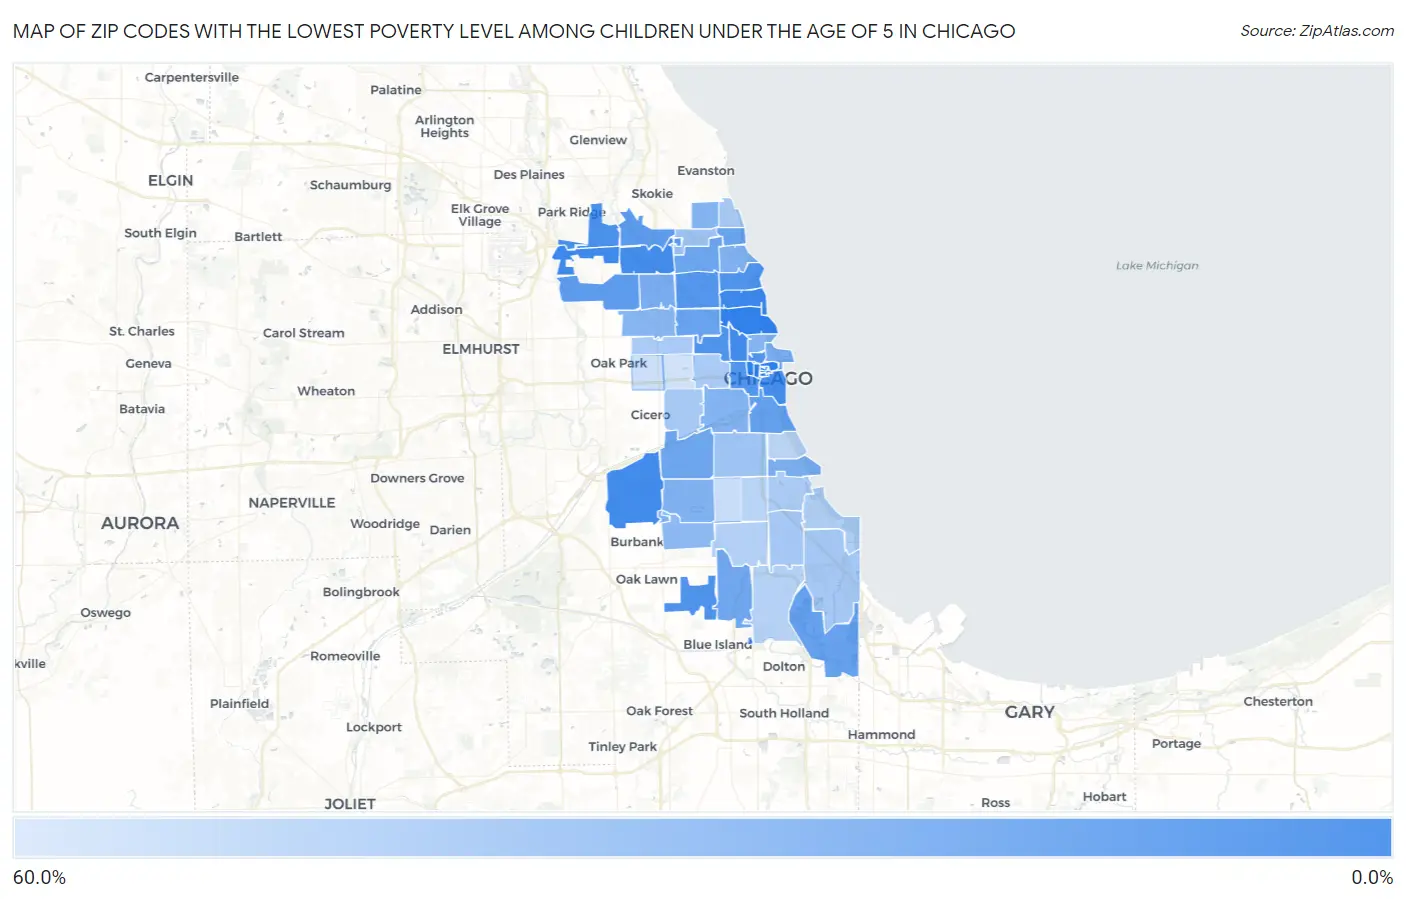
Map of Zip Codes with the Lowest Poverty Level Among Children Under the Age of 5 in Chicago

60.0%
0.0%
Zip Codes with the Lowest Poverty Level Among Children Under the Age of 5 in Chicago Map

Zip Codes with the Lowest Poverty Level Among Children Under the Age of 5 in Chicago, IL

Zip Code Child Poverty vs State vs National
1.606570.16%16.9%(-16.8)#218.1%(-17.9)#3
2.606561.8%16.9%(-15.1)#3918.1%(-16.2)#726
3.606382.3%16.9%(-14.6)#5518.1%(-15.8)#1,033
4.606422.4%16.9%(-14.5)#5818.1%(-15.7)#1,087
5.606303.0%16.9%(-13.9)#8518.1%(-15.0)#1,513
6.606053.7%16.9%(-13.2)#11318.1%(-14.3)#1,977
7.606314.9%16.9%(-12.0)#15018.1%(-13.1)#2,849
8.606555.6%16.9%(-11.3)#17018.1%(-12.4)#3,332
9.606545.8%16.9%(-11.1)#17718.1%(-12.3)#3,442
10.606226.0%16.9%(-10.9)#18118.1%(-12.1)#3,596
11.606136.4%16.9%(-10.5)#19918.1%(-11.6)#3,894
12.606077.3%16.9%(-9.67)#23418.1%(-10.8)#4,450
13.606187.8%16.9%(-9.09)#25018.1%(-10.2)#4,814
14.6064610.4%16.9%(-6.48)#34318.1%(-7.62)#6,516
15.6063410.5%16.9%(-6.42)#34618.1%(-7.56)#6,552
16.6061612.8%16.9%(-4.12)#40818.1%(-5.26)#7,930
17.6063314.0%16.9%(-2.88)#43618.1%(-4.02)#8,659
18.6064714.2%16.9%(-2.68)#43918.1%(-3.82)#8,759
19.6066014.4%16.9%(-2.57)#44418.1%(-3.71)#8,872
20.6062515.7%16.9%(-1.20)#48518.1%(-2.34)#9,608
21.6063216.4%16.9%(-0.520)#49818.1%(-1.66)#9,978
22.6064316.6%16.9%(-0.287)#50418.1%(-1.43)#10,086
23.6064119.9%16.9%(+2.96)#56118.1%(+1.82)#11,565
24.6061120.3%16.9%(+3.41)#56918.1%(+2.27)#11,793
25.6061520.7%16.9%(+3.79)#57418.1%(+2.65)#11,956
26.6062922.1%16.9%(+5.18)#59718.1%(+4.04)#12,525
27.6064022.6%16.9%(+5.69)#60718.1%(+4.55)#12,755
28.6060823.4%16.9%(+6.46)#62018.1%(+5.32)#13,055
29.6064523.8%16.9%(+6.87)#62818.1%(+5.73)#13,222
30.6061024.3%16.9%(+7.39)#63718.1%(+6.25)#13,431
31.6063924.8%16.9%(+7.89)#64318.1%(+6.75)#13,592
32.6065227.0%16.9%(+10.1)#68118.1%(+8.95)#14,367
33.6065933.4%16.9%(+16.5)#75518.1%(+15.4)#16,253
34.6060933.7%16.9%(+16.8)#75818.1%(+15.7)#16,312
35.6062635.9%16.9%(+19.0)#78118.1%(+17.9)#16,835
36.6061936.1%16.9%(+19.2)#78418.1%(+18.0)#16,865
37.6061736.2%16.9%(+19.3)#78718.1%(+18.1)#16,889
38.6062336.9%16.9%(+19.9)#79718.1%(+18.8)#17,053
39.6065137.8%16.9%(+20.9)#80218.1%(+19.7)#17,226
40.6061238.5%16.9%(+21.5)#80518.1%(+20.4)#17,364
41.6063739.1%16.9%(+22.2)#81018.1%(+21.1)#17,491
42.6064941.2%16.9%(+24.3)#82318.1%(+23.2)#17,879
43.6062041.7%16.9%(+24.8)#82818.1%(+23.6)#17,971
44.6062842.6%16.9%(+25.7)#83418.1%(+24.5)#18,121
45.6062144.3%16.9%(+27.4)#84918.1%(+26.3)#18,377
46.6065346.5%16.9%(+29.5)#86318.1%(+28.4)#18,690
47.6063650.2%16.9%(+33.3)#88018.1%(+32.1)#19,164
48.6064452.4%16.9%(+35.5)#88718.1%(+34.4)#19,366
49.6062454.7%16.9%(+37.8)#89318.1%(+36.6)#19,581

Common Questions

What are the Top 10 Zip Codes with the Lowest Poverty Level Among Children Under the Age of 5 in Chicago, IL?
Top 10 Zip Codes with the Lowest Poverty Level Among Children Under the Age of 5 in Chicago, IL are:
#1
0.0%
#2
0.0%
#3
0.0%
#4
0.0%
#5
0.0%
#6
0.0%
#7
0.0%
#8
0.16%
#9
1.8%
#10
2.3%
What zip code has the Lowest Poverty Level Among Children Under the Age of 5 in Chicago, IL?
60657 has the Lowest Poverty Level Among Children Under the Age of 5 in Chicago, IL with 0.16%.
What is the Poverty Level Among Children Under the Age of 5 in Chicago, IL?
Poverty Level Among Children Under the Age of 5 in Chicago is 22.9%.
What is the Poverty Level Among Children Under the Age of 5 in Illinois?
Poverty Level Among Children Under the Age of 5 in Illinois is 16.9%.
What is the Poverty Level Among Children Under the Age of 5 in the United States?
Poverty Level Among Children Under the Age of 5 in the United States is 18.1%.