Zip Codes with the Highest Percentage of Population Employed in Farming, Fishing & Forestry in Chicago, IL
RELATED REPORTS & OPTIONS
Farming, Fishing & Forestry
Chicago
Compare Zip Codes
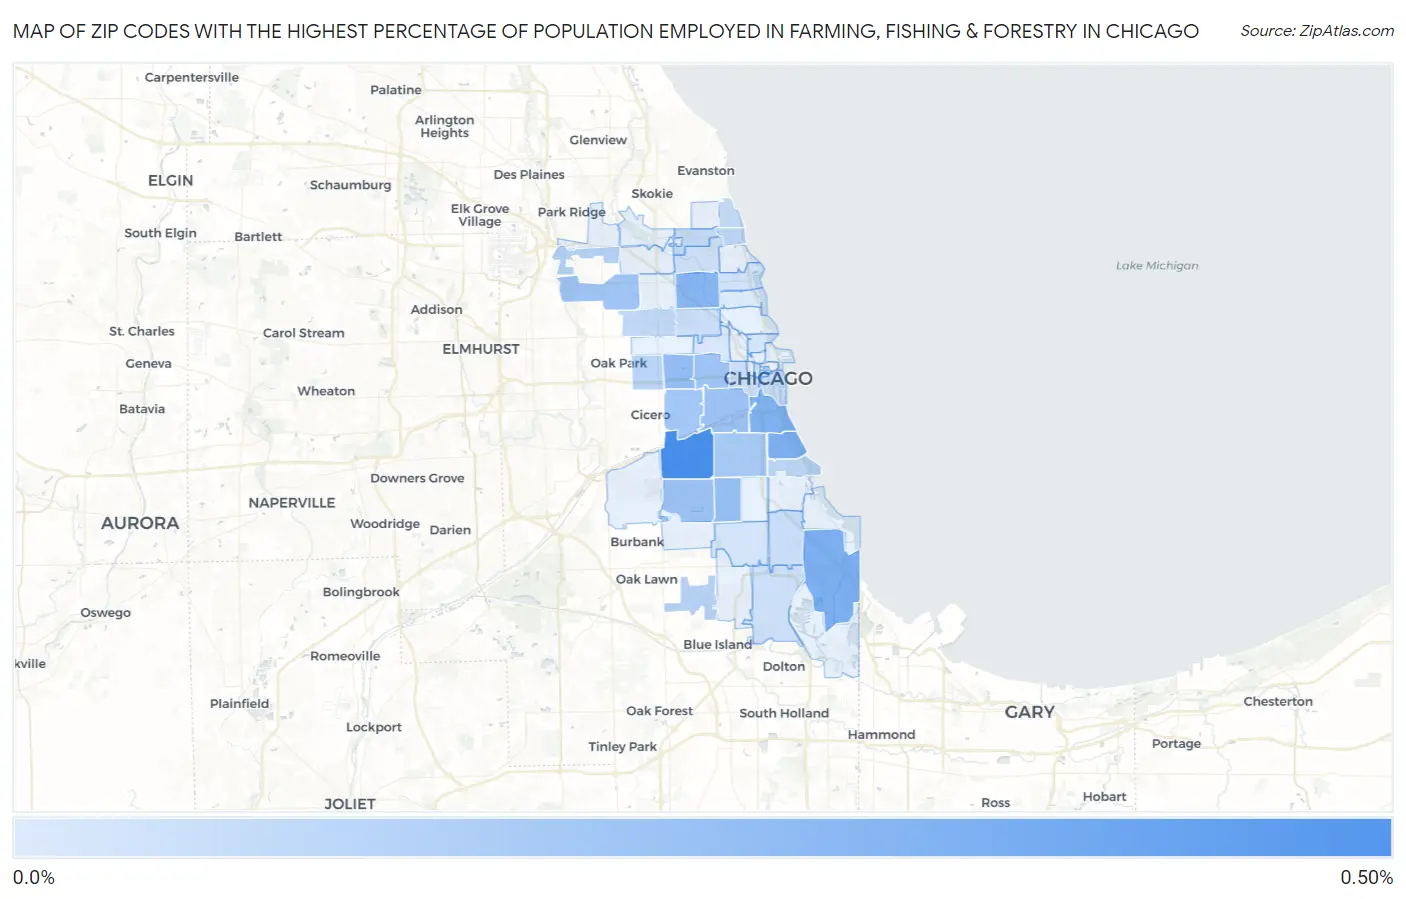
Map of Zip Codes with the Highest Percentage of Population Employed in Farming, Fishing & Forestry in Chicago
0.0%
0.50%
Zip Codes with the Highest Percentage of Population Employed in Farming, Fishing & Forestry in Chicago, IL
| Zip Code | % Employed | vs State | vs National | |
| 1. | 60632 | 0.49% | 0.31%(+0.181)#572 | 0.61%(-0.114)#12,927 |
| 2. | 60617 | 0.32% | 0.31%(+0.008)#635 | 0.61%(-0.287)#14,612 |
| 3. | 60653 | 0.32% | 0.31%(+0.005)#636 | 0.61%(-0.290)#14,648 |
| 4. | 60616 | 0.31% | 0.31%(-0.002)#639 | 0.61%(-0.297)#14,732 |
| 5. | 60618 | 0.28% | 0.31%(-0.028)#659 | 0.61%(-0.323)#15,042 |
| 6. | 60624 | 0.25% | 0.31%(-0.064)#686 | 0.61%(-0.359)#15,460 |
| 7. | 60636 | 0.24% | 0.31%(-0.072)#690 | 0.61%(-0.367)#15,578 |
| 8. | 60629 | 0.23% | 0.31%(-0.085)#698 | 0.61%(-0.380)#15,759 |
| 9. | 60608 | 0.21% | 0.31%(-0.096)#707 | 0.61%(-0.391)#15,921 |
| 10. | 60612 | 0.21% | 0.31%(-0.100)#709 | 0.61%(-0.395)#15,979 |
| 11. | 60634 | 0.20% | 0.31%(-0.110)#717 | 0.61%(-0.405)#16,130 |
| 12. | 60623 | 0.19% | 0.31%(-0.118)#719 | 0.61%(-0.413)#16,243 |
| 13. | 60609 | 0.18% | 0.31%(-0.126)#728 | 0.61%(-0.421)#16,357 |
| 14. | 60656 | 0.14% | 0.31%(-0.170)#748 | 0.61%(-0.465)#17,106 |
| 15. | 60655 | 0.13% | 0.31%(-0.179)#753 | 0.61%(-0.474)#17,249 |
| 16. | 60644 | 0.12% | 0.31%(-0.190)#761 | 0.61%(-0.485)#17,422 |
| 17. | 60615 | 0.11% | 0.31%(-0.199)#769 | 0.61%(-0.494)#17,569 |
| 18. | 60660 | 0.11% | 0.31%(-0.201)#770 | 0.61%(-0.496)#17,595 |
| 19. | 60639 | 0.10% | 0.31%(-0.208)#774 | 0.61%(-0.503)#17,714 |
| 20. | 60626 | 0.094% | 0.31%(-0.217)#779 | 0.61%(-0.512)#17,865 |
| 21. | 60659 | 0.088% | 0.31%(-0.222)#781 | 0.61%(-0.517)#17,966 |
| 22. | 60605 | 0.083% | 0.31%(-0.228)#786 | 0.61%(-0.523)#18,056 |
| 23. | 60619 | 0.079% | 0.31%(-0.232)#790 | 0.61%(-0.527)#18,146 |
| 24. | 60647 | 0.074% | 0.31%(-0.237)#793 | 0.61%(-0.532)#18,237 |
| 25. | 60607 | 0.072% | 0.31%(-0.238)#794 | 0.61%(-0.533)#18,263 |
| 26. | 60628 | 0.060% | 0.31%(-0.250)#803 | 0.61%(-0.545)#18,473 |
| 27. | 60625 | 0.054% | 0.31%(-0.257)#810 | 0.61%(-0.552)#18,595 |
| 28. | 60613 | 0.052% | 0.31%(-0.259)#814 | 0.61%(-0.554)#18,626 |
| 29. | 60620 | 0.039% | 0.31%(-0.272)#821 | 0.61%(-0.567)#18,823 |
| 30. | 60610 | 0.031% | 0.31%(-0.279)#824 | 0.61%(-0.574)#18,940 |
| 31. | 60622 | 0.030% | 0.31%(-0.281)#826 | 0.61%(-0.576)#18,967 |
| 32. | 60657 | 0.012% | 0.31%(-0.299)#830 | 0.61%(-0.594)#19,146 |
1
Common Questions
What are the Top 10 Zip Codes with the Highest Percentage of Population Employed in Farming, Fishing & Forestry in Chicago, IL?
Top 10 Zip Codes with the Highest Percentage of Population Employed in Farming, Fishing & Forestry in Chicago, IL are:
What zip code has the Highest Percentage of Population Employed in Farming, Fishing & Forestry in Chicago, IL?
60632 has the Highest Percentage of Population Employed in Farming, Fishing & Forestry in Chicago, IL with 0.49%.
What is the Percentage of Population Employed in Farming, Fishing & Forestry in Chicago, IL?
Percentage of Population Employed in Farming, Fishing & Forestry in Chicago is 0.10%.
What is the Percentage of Population Employed in Farming, Fishing & Forestry in Illinois?
Percentage of Population Employed in Farming, Fishing & Forestry in Illinois is 0.31%.
What is the Percentage of Population Employed in Farming, Fishing & Forestry in the United States?
Percentage of Population Employed in Farming, Fishing & Forestry in the United States is 0.61%.