Zip Codes with the Highest Percentage of Population Employed in Health Diagnosing & Treating in Aurora, IL
RELATED REPORTS & OPTIONS
Health Diagnosing & Treating
Aurora
Compare Zip Codes
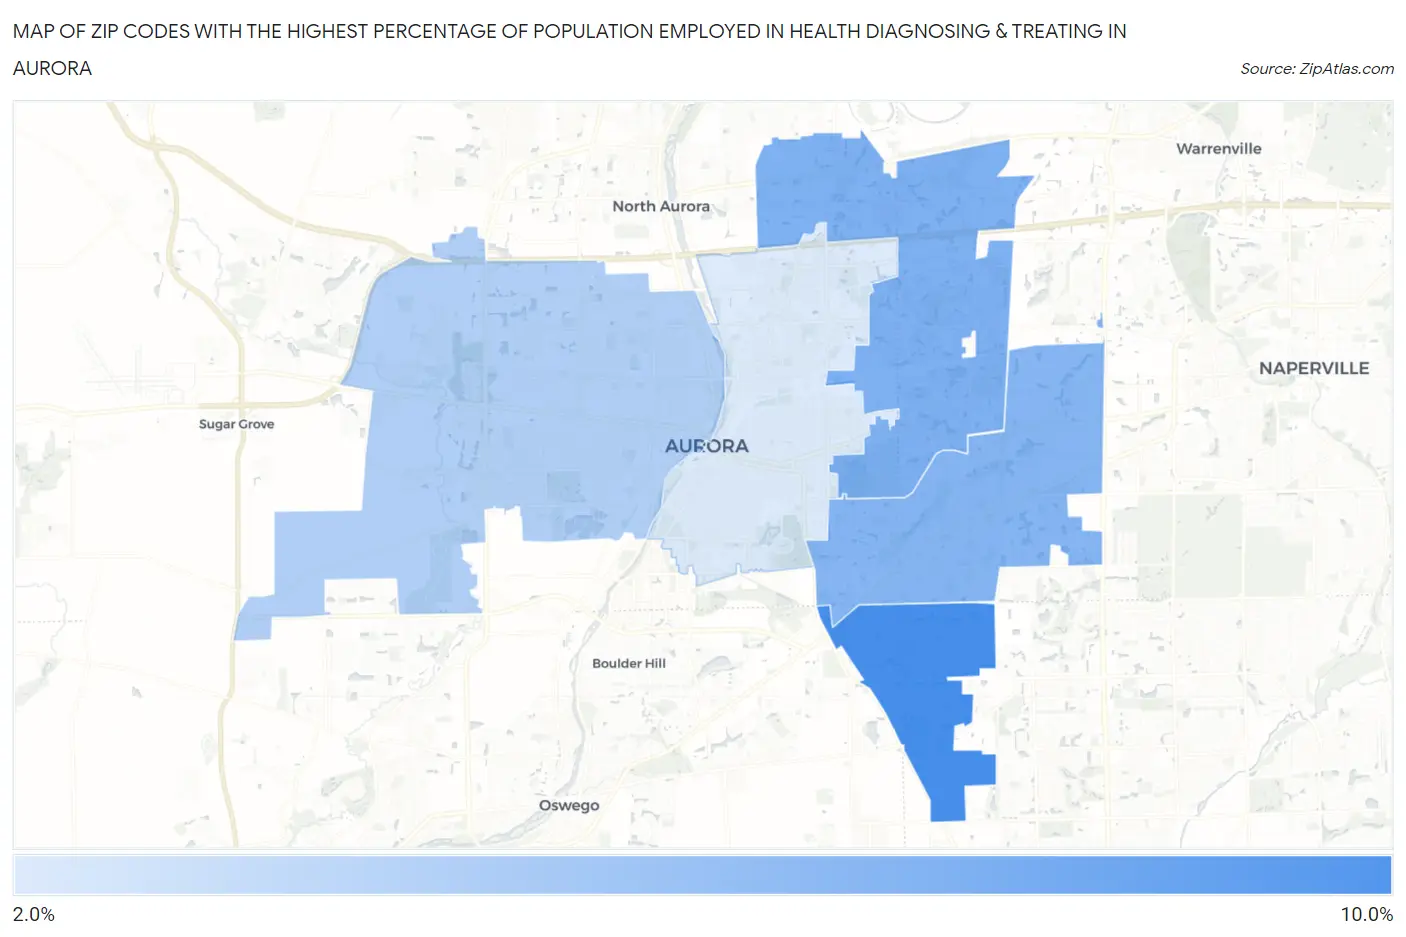
Map of Zip Codes with the Highest Percentage of Population Employed in Health Diagnosing & Treating in Aurora
0.0%
10.0%
Zip Codes with the Highest Percentage of Population Employed in Health Diagnosing & Treating in Aurora, IL
| Zip Code | % Employed | vs State | vs National | |
| 1. | 60503 | 8.1% | 6.2%(+1.86)#364 | 6.2%(+1.85)#7,263 |
| 2. | 60502 | 5.9% | 6.2%(-0.320)#659 | 6.2%(-0.329)#14,164 |
| 3. | 60504 | 5.7% | 6.2%(-0.547)#702 | 6.2%(-0.555)#15,029 |
| 4. | 60506 | 4.0% | 6.2%(-2.21)#1,012 | 6.2%(-2.22)#21,303 |
| 5. | 60505 | 2.4% | 6.2%(-3.88)#1,182 | 6.2%(-3.89)#25,813 |
1
Common Questions
What are the Top 3 Zip Codes with the Highest Percentage of Population Employed in Health Diagnosing & Treating in Aurora, IL?
Top 3 Zip Codes with the Highest Percentage of Population Employed in Health Diagnosing & Treating in Aurora, IL are:
What zip code has the Highest Percentage of Population Employed in Health Diagnosing & Treating in Aurora, IL?
60503 has the Highest Percentage of Population Employed in Health Diagnosing & Treating in Aurora, IL with 8.1%.
What is the Percentage of Population Employed in Health Diagnosing & Treating in Aurora, IL?
Percentage of Population Employed in Health Diagnosing & Treating in Aurora is 4.7%.
What is the Percentage of Population Employed in Health Diagnosing & Treating in Illinois?
Percentage of Population Employed in Health Diagnosing & Treating in Illinois is 6.2%.
What is the Percentage of Population Employed in Health Diagnosing & Treating in the United States?
Percentage of Population Employed in Health Diagnosing & Treating in the United States is 6.2%.