Zip Codes with the Highest Poverty Level Among Children Under the Age of 5 in Chicago, IL

RELATED REPORTS & OPTIONS

Highest Poverty | Child 0-5
Population
Families and Households
Female Fertility
Female Fertility (Unmarried)
Race (Community Size)
Race (Percentage)
Ancestry (Community Size)
AfghanAfricanAlbanianAmericanApacheArabArgentineanArmenianAssyrian / Chaldean / SyriacAustralianAustrianBahamianBangladeshiBarbadianBasqueBelgianBelizeanBermudanBhutaneseBlackfeetBolivianBrazilianBritishBritish West IndianBulgarianBurmeseCajunCambodianCanadianCape VerdeanCarpatho RusynCelticCentral AmericanCentral American IndianCherokeeChickasawChileanChippewaChoctawColombianComancheCosta RicanCreeCreekCroatianCubanCypriotCzechCzechoslovakianDanishDominicanDutchEastern EuropeanEcuadorianEgyptianEnglishEstonianEthiopianEuropeanFilipinoFinnishFrenchFrench American IndianFrench CanadianGermanGerman RussianGhanaianGreekGuamanian / ChamorroGuatemalanGuyaneseHaitianHmongHonduranHopiHungarianIcelanderIndian (Asian)IndonesianInupiatIranianIraqiIrishIroquoisIsraeliItalianJamaicanJapaneseJordanianKenyanKiowaKoreanLaotianLatvianLebaneseLiberianLithuanianLumbeeLuxembourgerMacedonianMalaysianMalteseMenomineeMexicanMexican American IndianMongolianMoroccanNative HawaiianNavajoNew ZealanderNicaraguanNigerianNorthern EuropeanNorwegianOkinawanOsageOttawaPaiutePakistaniPalestinianPanamanianParaguayanPennsylvania GermanPeruvianPolishPortuguesePotawatomiPuebloPuerto RicanPuget Sound SalishRomanianRussianSalvadoranSamoanScandinavianScotch-IrishScottishSeminoleSenegaleseSerbianShoshoneSierra LeoneanSiouxSlavicSlovakSloveneSomaliSouth AfricanSouth AmericanSouth American IndianSoviet UnionSpaniardSpanishSpanish AmericanSri LankanSubsaharan AfricanSudaneseSwedishSwissSyrianTaiwaneseThaiTonganTrinidadian and TobagonianTurkishU.S. Virgin IslanderUgandanUkrainianUruguayanVenezuelanVietnameseWelshWest IndianYaquiYugoslavianZimbabwean
Ancestry (Percentage)
AfghanAfricanAlbanianAmericanApacheArabArgentineanArmenianAssyrian / Chaldean / SyriacAustralianAustrianBahamianBangladeshiBarbadianBasqueBelgianBelizeanBermudanBhutaneseBlackfeetBolivianBrazilianBritishBritish West IndianBulgarianBurmeseCajunCambodianCanadianCape VerdeanCarpatho RusynCelticCentral AmericanCentral American IndianCherokeeChickasawChileanChippewaChoctawColombianComancheCosta RicanCreeCreekCroatianCubanCypriotCzechCzechoslovakianDanishDominicanDutchEastern EuropeanEcuadorianEgyptianEnglishEstonianEthiopianEuropeanFilipinoFinnishFrenchFrench American IndianFrench CanadianGermanGerman RussianGhanaianGreekGuamanian / ChamorroGuatemalanGuyaneseHaitianHmongHonduranHopiHungarianIcelanderIndian (Asian)IndonesianInupiatIranianIraqiIrishIroquoisIsraeliItalianJamaicanJapaneseJordanianKenyanKiowaKoreanLaotianLatvianLebaneseLiberianLithuanianLumbeeLuxembourgerMacedonianMalaysianMalteseMenomineeMexicanMexican American IndianMongolianMoroccanNative HawaiianNavajoNew ZealanderNicaraguanNigerianNorthern EuropeanNorwegianOkinawanOsageOttawaPaiutePakistaniPalestinianPanamanianParaguayanPennsylvania GermanPeruvianPolishPortuguesePotawatomiPuebloPuerto RicanPuget Sound SalishRomanianRussianSalvadoranSamoanScandinavianScotch-IrishScottishSeminoleSenegaleseSerbianShoshoneSierra LeoneanSiouxSlavicSlovakSloveneSomaliSouth AfricanSouth AmericanSouth American IndianSoviet UnionSpaniardSpanishSpanish AmericanSri LankanSubsaharan AfricanSudaneseSwedishSwissSyrianTaiwaneseThaiTonganTrinidadian and TobagonianTurkishU.S. Virgin IslanderUgandanUkrainianUruguayanVenezuelanVietnameseWelshWest IndianYaquiYugoslavianZimbabwean
Immigrant Origin (Total)
AfghanistanAfricaAlbaniaArgentinaArmeniaAsiaAustraliaAustriaBahamasBangladeshBarbadosBelarusBelgiumBelizeBoliviaBosnia and HerzegovinaBrazilBulgariaBurma / MyanmarCambodiaCameroonCanadaCaribbeanCentral AmericaChileChinaColombiaCongoCosta RicaCroatiaCubaCzechoslovakiaDenmarkDominicaDominican RepublicEastern AfricaEastern AsiaEastern EuropeEcuadorEgyptEl SalvadorEnglandEritreaEthiopiaEuropeFijiFranceGermanyGhanaGreeceGuatemalaGuyanaHaitiHondurasHong KongHungaryIndiaIndonesiaIranIraqIrelandIsraelItalyJamaicaJapanJordanKazakhstanKenyaKoreaKuwaitLaosLatin AmericaLatviaLebanonLiberiaLithuaniaMalaysiaMexicoMiddle AfricaMoldovaMoroccoNepalNetherlandsNicaraguaNigeriaNorth MacedoniaNorthern AfricaNorthern EuropeNorwayOceaniaPakistanPanamaPeruPhilippinesPolandPortugalRomaniaRussiaSaudi ArabiaScotlandSenegalSerbiaSierra LeoneSingaporeSomaliaSouth AfricaSouth AmericaSouth Central AsiaSouth Eastern AsiaSouthern EuropeSpainSri LankaSudanSwedenSwitzerlandSyriaTaiwanThailandTrinidad and TobagoTurkeyUgandaUkraineUruguayUzbekistanVenezuelaVietnamWest IndiesWestern AfricaWestern AsiaWestern EuropeYemenZaireZimbabwe
Immigrant Origin (Percentage)
AfghanistanAfricaAlbaniaArgentinaArmeniaAsiaAustraliaAustriaBahamasBangladeshBarbadosBelarusBelgiumBelizeBoliviaBosnia and HerzegovinaBrazilBulgariaBurma / MyanmarCambodiaCameroonCanadaCaribbeanCentral AmericaChileChinaColombiaCongoCosta RicaCroatiaCubaCzechoslovakiaDenmarkDominicaDominican RepublicEastern AfricaEastern AsiaEastern EuropeEcuadorEgyptEl SalvadorEnglandEritreaEthiopiaEuropeFijiFranceGermanyGhanaGreeceGuatemalaGuyanaHaitiHondurasHong KongHungaryIndiaIndonesiaIranIraqIrelandIsraelItalyJamaicaJapanJordanKazakhstanKenyaKoreaKuwaitLaosLatin AmericaLatviaLebanonLiberiaLithuaniaMalaysiaMexicoMiddle AfricaMoldovaMoroccoNepalNetherlandsNicaraguaNigeriaNorth MacedoniaNorthern AfricaNorthern EuropeNorwayOceaniaPakistanPanamaPeruPhilippinesPolandPortugalRomaniaRussiaSaudi ArabiaScotlandSenegalSerbiaSierra LeoneSingaporeSomaliaSouth AfricaSouth AmericaSouth Central AsiaSouth Eastern AsiaSouthern EuropeSpainSri LankaSudanSwedenSwitzerlandSyriaTaiwanThailandTrinidad and TobagoTurkeyUgandaUkraineUruguayUzbekistanVenezuelaVietnamWest IndiesWestern AfricaWestern AsiaWestern EuropeYemenZaireZimbabwe
Income
Income (Families)
Income (Households)
Poverty
Poverty (Families)
Unemployment
Employment Occupations
Employment Industries
Employer Class
Commute Time
Commute Means
School Enrollment
Education by Degree Field
Occupancy
Finances
Physical Characteristics
Chicago
Compare Zip Codes
Comparison Subject

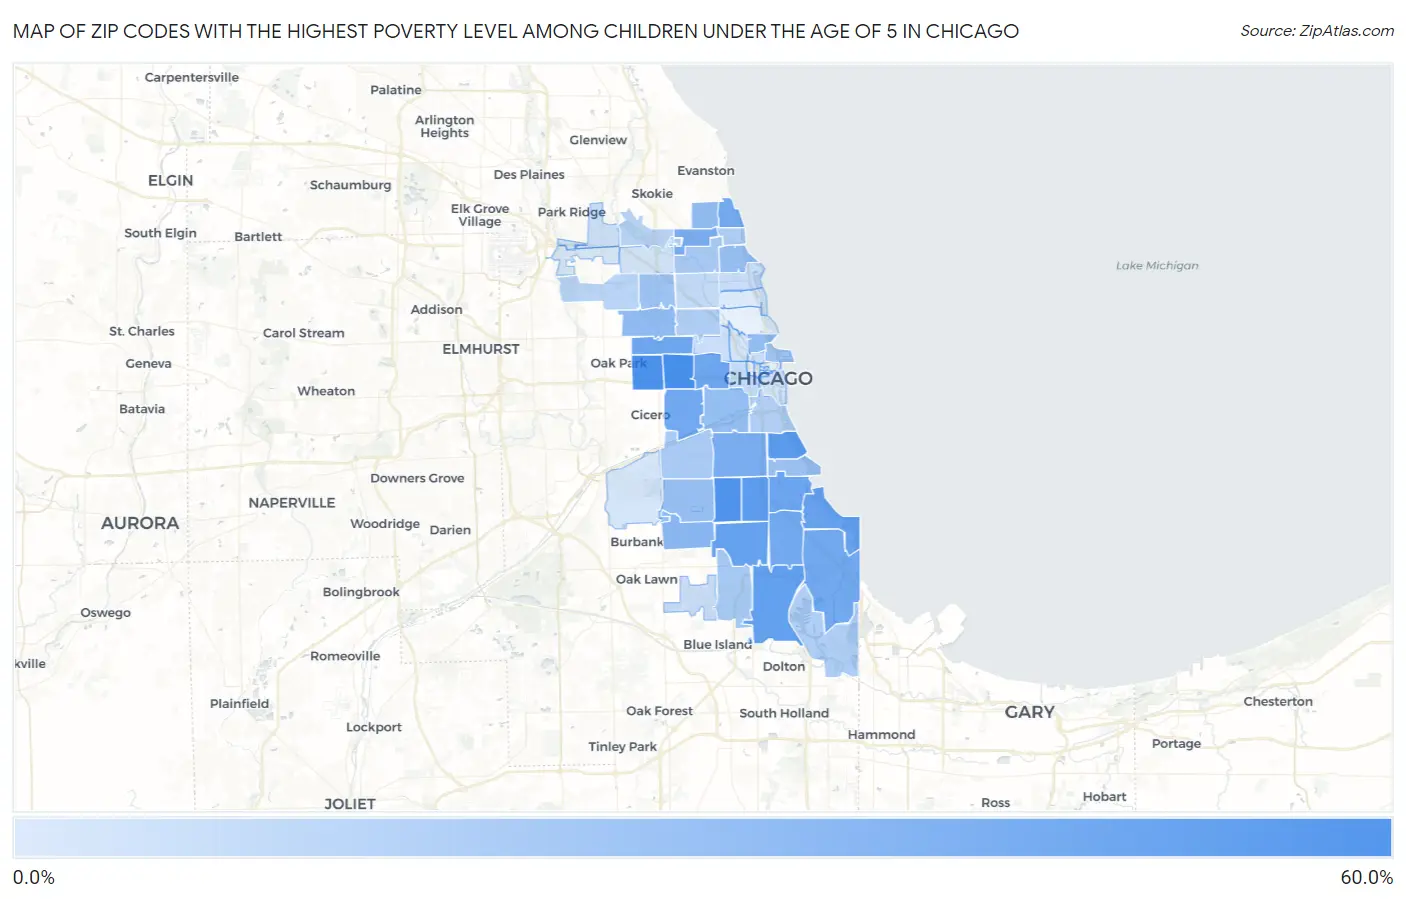
Map of Zip Codes with the Highest Poverty Level Among Children Under the Age of 5 in Chicago

0.0%
60.0%
Zip Codes with the Highest Poverty Level Among Children Under the Age of 5 in Chicago Map

Zip Codes with the Highest Poverty Level Among Children Under the Age of 5 in Chicago, IL

Zip Code Child Poverty vs State vs National
1.6062454.7%16.9%(+37.8)#7818.1%(+36.6)#2,091
2.6064452.4%16.9%(+35.5)#8418.1%(+34.4)#2,306
3.6063650.2%16.9%(+33.3)#9118.1%(+32.1)#2,508
4.6065346.5%16.9%(+29.5)#10818.1%(+28.4)#2,982
5.6062144.3%16.9%(+27.4)#12218.1%(+26.3)#3,295
6.6062842.6%16.9%(+25.7)#13718.1%(+24.5)#3,551
7.6062041.7%16.9%(+24.8)#14318.1%(+23.6)#3,701
8.6064941.2%16.9%(+24.3)#14818.1%(+23.2)#3,793
9.6063739.1%16.9%(+22.2)#16118.1%(+21.1)#4,181
10.6061238.5%16.9%(+21.5)#16618.1%(+20.4)#4,308
11.6065137.8%16.9%(+20.9)#16918.1%(+19.7)#4,446
12.6062336.9%16.9%(+19.9)#17418.1%(+18.8)#4,619
13.6061736.2%16.9%(+19.3)#18418.1%(+18.1)#4,783
14.6061936.1%16.9%(+19.2)#18718.1%(+18.0)#4,807
15.6062635.9%16.9%(+19.0)#19018.1%(+17.9)#4,837
16.6060933.7%16.9%(+16.8)#21318.1%(+15.7)#5,360
17.6065933.4%16.9%(+16.5)#21618.1%(+15.4)#5,419
18.6065227.0%16.9%(+10.1)#29018.1%(+8.95)#7,305
19.6063924.8%16.9%(+7.89)#32818.1%(+6.75)#8,080
20.6061024.3%16.9%(+7.39)#33418.1%(+6.25)#8,241
21.6064523.8%16.9%(+6.87)#34318.1%(+5.73)#8,450
22.6060823.4%16.9%(+6.46)#35118.1%(+5.32)#8,617
23.6064022.6%16.9%(+5.69)#36418.1%(+4.55)#8,917
24.6062922.1%16.9%(+5.18)#37418.1%(+4.04)#9,147
25.6061520.7%16.9%(+3.79)#39718.1%(+2.65)#9,715
26.6061120.3%16.9%(+3.41)#40218.1%(+2.27)#9,879
27.6064119.9%16.9%(+2.96)#41018.1%(+1.82)#10,107
28.6064316.6%16.9%(-0.287)#46718.1%(-1.43)#11,586
29.6063216.4%16.9%(-0.520)#47318.1%(-1.66)#11,694
30.6062515.7%16.9%(-1.20)#48618.1%(-2.34)#12,064
31.6066014.4%16.9%(-2.57)#52718.1%(-3.71)#12,800
32.6064714.2%16.9%(-2.68)#53218.1%(-3.82)#12,913
33.6063314.0%16.9%(-2.88)#53518.1%(-4.02)#13,013
34.6061612.8%16.9%(-4.12)#56318.1%(-5.26)#13,742
35.6063410.5%16.9%(-6.42)#62518.1%(-7.56)#15,120
36.6064610.4%16.9%(-6.48)#62818.1%(-7.62)#15,156
37.606187.8%16.9%(-9.09)#72118.1%(-10.2)#16,858
38.606077.3%16.9%(-9.67)#73718.1%(-10.8)#17,222
39.606136.4%16.9%(-10.5)#77218.1%(-11.6)#17,776
40.606226.0%16.9%(-10.9)#79018.1%(-12.1)#18,076
41.606545.8%16.9%(-11.1)#79418.1%(-12.3)#18,231
42.606555.6%16.9%(-11.3)#80118.1%(-12.4)#18,340
43.606314.9%16.9%(-12.0)#82118.1%(-13.1)#18,823
44.606053.7%16.9%(-13.2)#85818.1%(-14.3)#19,695
45.606303.0%16.9%(-13.9)#88618.1%(-15.0)#20,159
46.606422.4%16.9%(-14.5)#91318.1%(-15.7)#20,585
47.606382.3%16.9%(-14.6)#91618.1%(-15.8)#20,637
48.606561.8%16.9%(-15.1)#93218.1%(-16.2)#20,946
49.606570.16%16.9%(-16.8)#96918.1%(-17.9)#21,669

Common Questions

What are the Top 10 Zip Codes with the Highest Poverty Level Among Children Under the Age of 5 in Chicago, IL?
Top 10 Zip Codes with the Highest Poverty Level Among Children Under the Age of 5 in Chicago, IL are:
#1
54.7%
#2
52.4%
#3
50.2%
#4
46.5%
#5
44.3%
#6
42.6%
#7
41.7%
#8
41.2%
#9
39.1%
#10
38.5%
What zip code has the Highest Poverty Level Among Children Under the Age of 5 in Chicago, IL?
60624 has the Highest Poverty Level Among Children Under the Age of 5 in Chicago, IL with 54.7%.
What is the Poverty Level Among Children Under the Age of 5 in Chicago, IL?
Poverty Level Among Children Under the Age of 5 in Chicago is 22.9%.
What is the Poverty Level Among Children Under the Age of 5 in Illinois?
Poverty Level Among Children Under the Age of 5 in Illinois is 16.9%.
What is the Poverty Level Among Children Under the Age of 5 in the United States?
Poverty Level Among Children Under the Age of 5 in the United States is 18.1%.