Zip Codes with the Highest Percentage of Population Employed in Health Diagnosing & Treating in Decatur, IL
RELATED REPORTS & OPTIONS
Health Diagnosing & Treating
Decatur
Compare Zip Codes
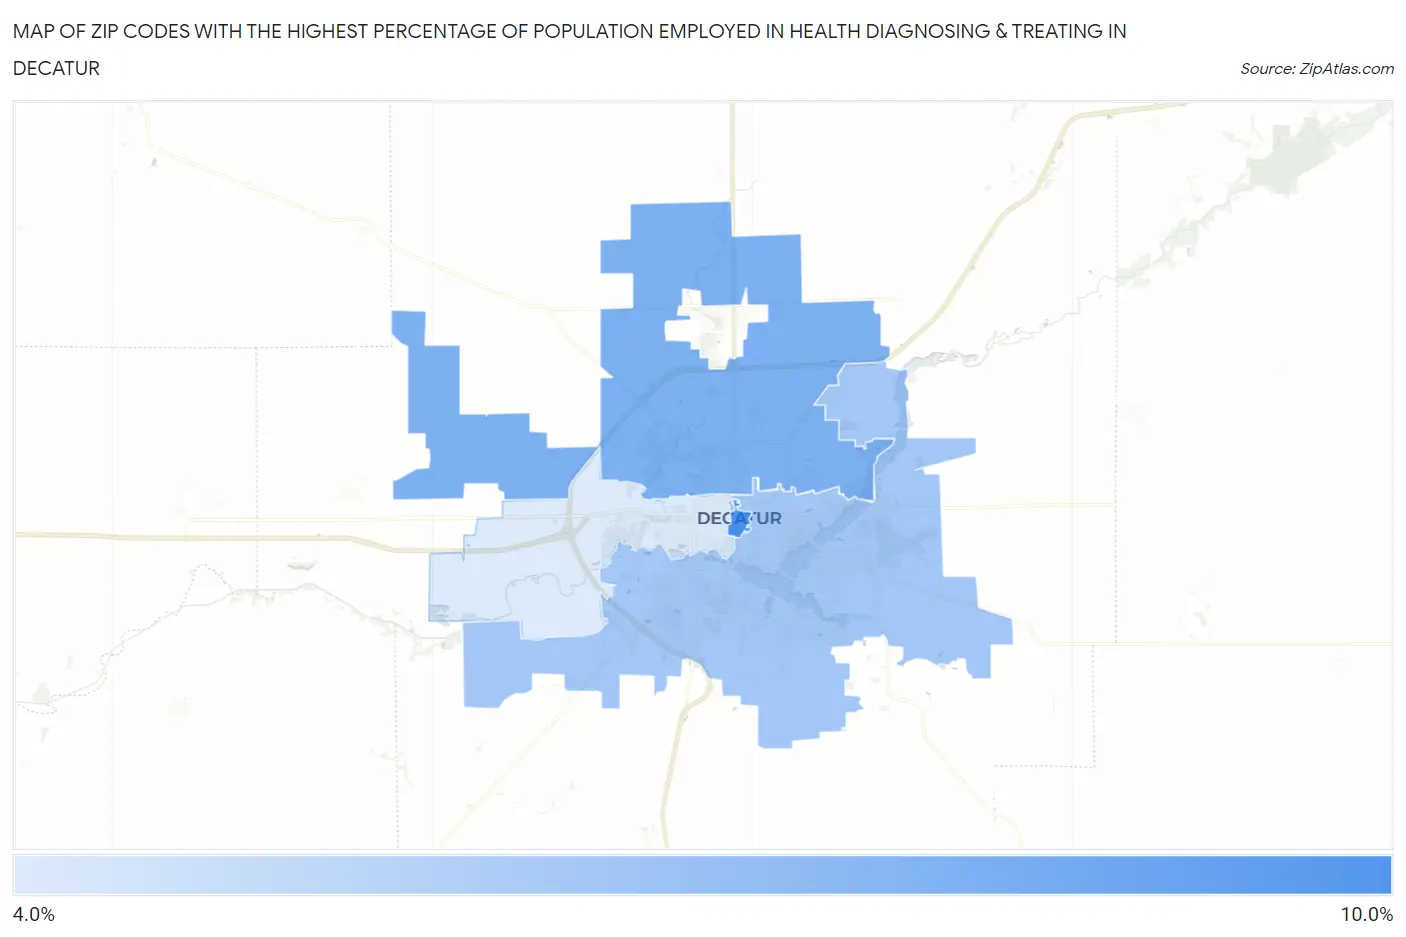
Map of Zip Codes with the Highest Percentage of Population Employed in Health Diagnosing & Treating in Decatur
0.0%
10.0%
Zip Codes with the Highest Percentage of Population Employed in Health Diagnosing & Treating in Decatur, IL
| Zip Code | % Employed | vs State | vs National | |
| 1. | 62523 | 9.9% | 6.2%(+3.65)#190 | 6.2%(+3.65)#4,008 |
| 2. | 62526 | 7.9% | 6.2%(+1.67)#387 | 6.2%(+1.66)#7,750 |
| 3. | 62521 | 6.4% | 6.2%(+0.187)#578 | 6.2%(+0.178)#12,297 |
| 4. | 62522 | 4.3% | 6.2%(-1.92)#962 | 6.2%(-1.93)#20,275 |
1
Common Questions
What are the Top 3 Zip Codes with the Highest Percentage of Population Employed in Health Diagnosing & Treating in Decatur, IL?
Top 3 Zip Codes with the Highest Percentage of Population Employed in Health Diagnosing & Treating in Decatur, IL are:
What zip code has the Highest Percentage of Population Employed in Health Diagnosing & Treating in Decatur, IL?
62523 has the Highest Percentage of Population Employed in Health Diagnosing & Treating in Decatur, IL with 9.9%.
What is the Percentage of Population Employed in Health Diagnosing & Treating in Decatur, IL?
Percentage of Population Employed in Health Diagnosing & Treating in Decatur is 6.5%.
What is the Percentage of Population Employed in Health Diagnosing & Treating in Illinois?
Percentage of Population Employed in Health Diagnosing & Treating in Illinois is 6.2%.
What is the Percentage of Population Employed in Health Diagnosing & Treating in the United States?
Percentage of Population Employed in Health Diagnosing & Treating in the United States is 6.2%.