Zip Codes with the Highest Percentage of Population Employed in Health Diagnosing & Treating in Waukegan, IL
RELATED REPORTS & OPTIONS
Health Diagnosing & Treating
Waukegan
Compare Zip Codes
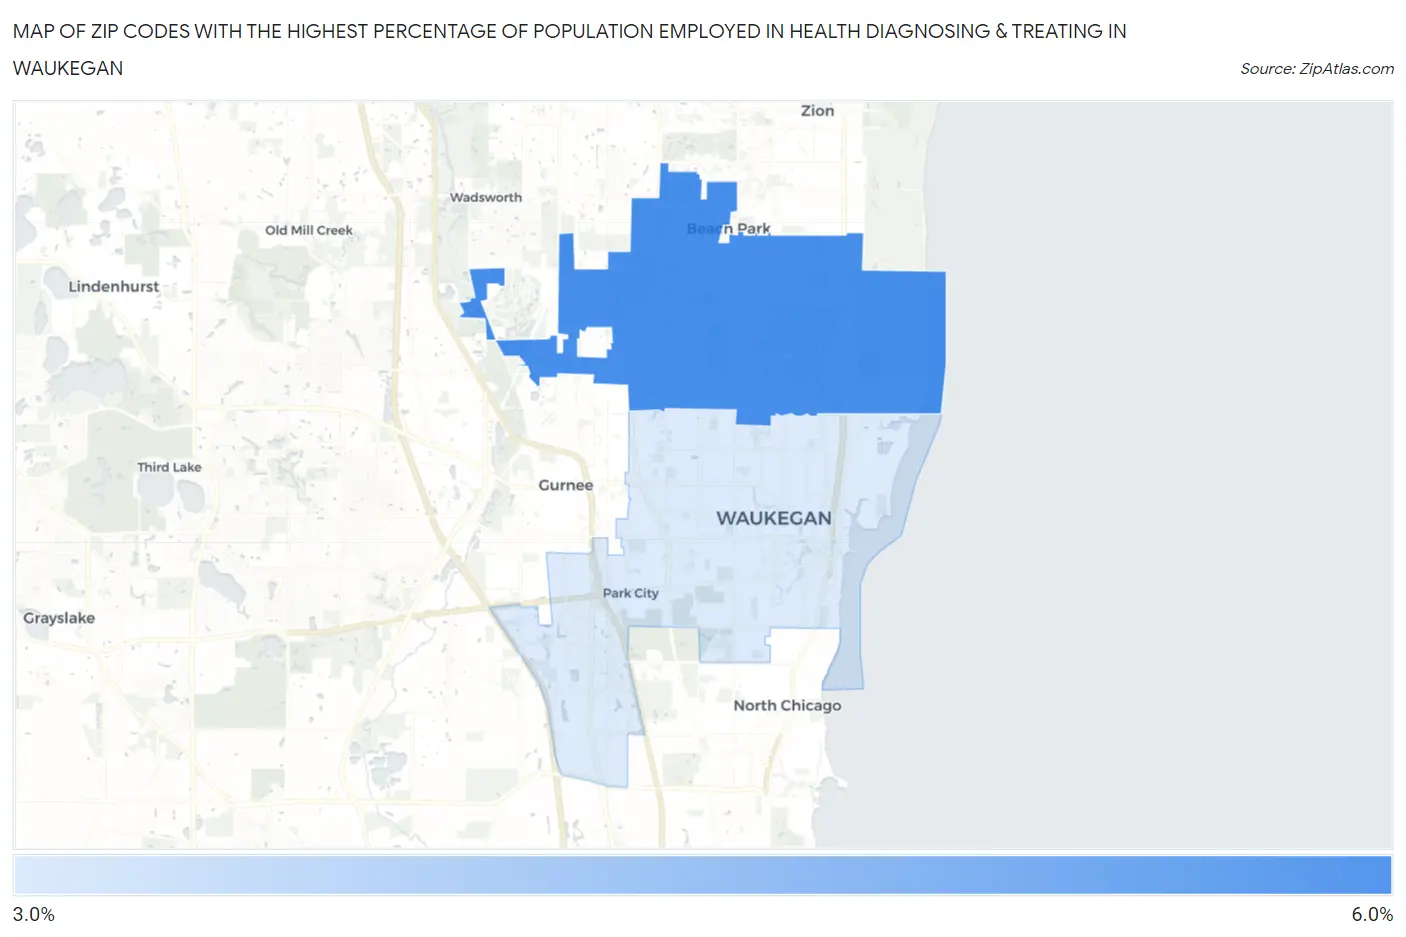
Map of Zip Codes with the Highest Percentage of Population Employed in Health Diagnosing & Treating in Waukegan
0.0%
6.0%
Zip Codes with the Highest Percentage of Population Employed in Health Diagnosing & Treating in Waukegan, IL
| Zip Code | % Employed | vs State | vs National | |
| 1. | 60087 | 5.0% | 6.2%(-1.22)#836 | 6.2%(-1.23)#17,643 |
| 2. | 60085 | 3.3% | 6.2%(-2.94)#1,096 | 6.2%(-2.95)#23,485 |
1
Common Questions
What are the Top Zip Codes with the Highest Percentage of Population Employed in Health Diagnosing & Treating in Waukegan, IL?
Top Zip Codes with the Highest Percentage of Population Employed in Health Diagnosing & Treating in Waukegan, IL are:
What zip code has the Highest Percentage of Population Employed in Health Diagnosing & Treating in Waukegan, IL?
60087 has the Highest Percentage of Population Employed in Health Diagnosing & Treating in Waukegan, IL with 5.0%.
What is the Percentage of Population Employed in Health Diagnosing & Treating in Waukegan, IL?
Percentage of Population Employed in Health Diagnosing & Treating in Waukegan is 4.8%.
What is the Percentage of Population Employed in Health Diagnosing & Treating in Illinois?
Percentage of Population Employed in Health Diagnosing & Treating in Illinois is 6.2%.
What is the Percentage of Population Employed in Health Diagnosing & Treating in the United States?
Percentage of Population Employed in Health Diagnosing & Treating in the United States is 6.2%.