Zip Codes with the Highest Percentage of Population Employed in Architecture & Engineering in Chicago, IL
RELATED REPORTS & OPTIONS
Architecture & Engineering
Chicago
Compare Zip Codes
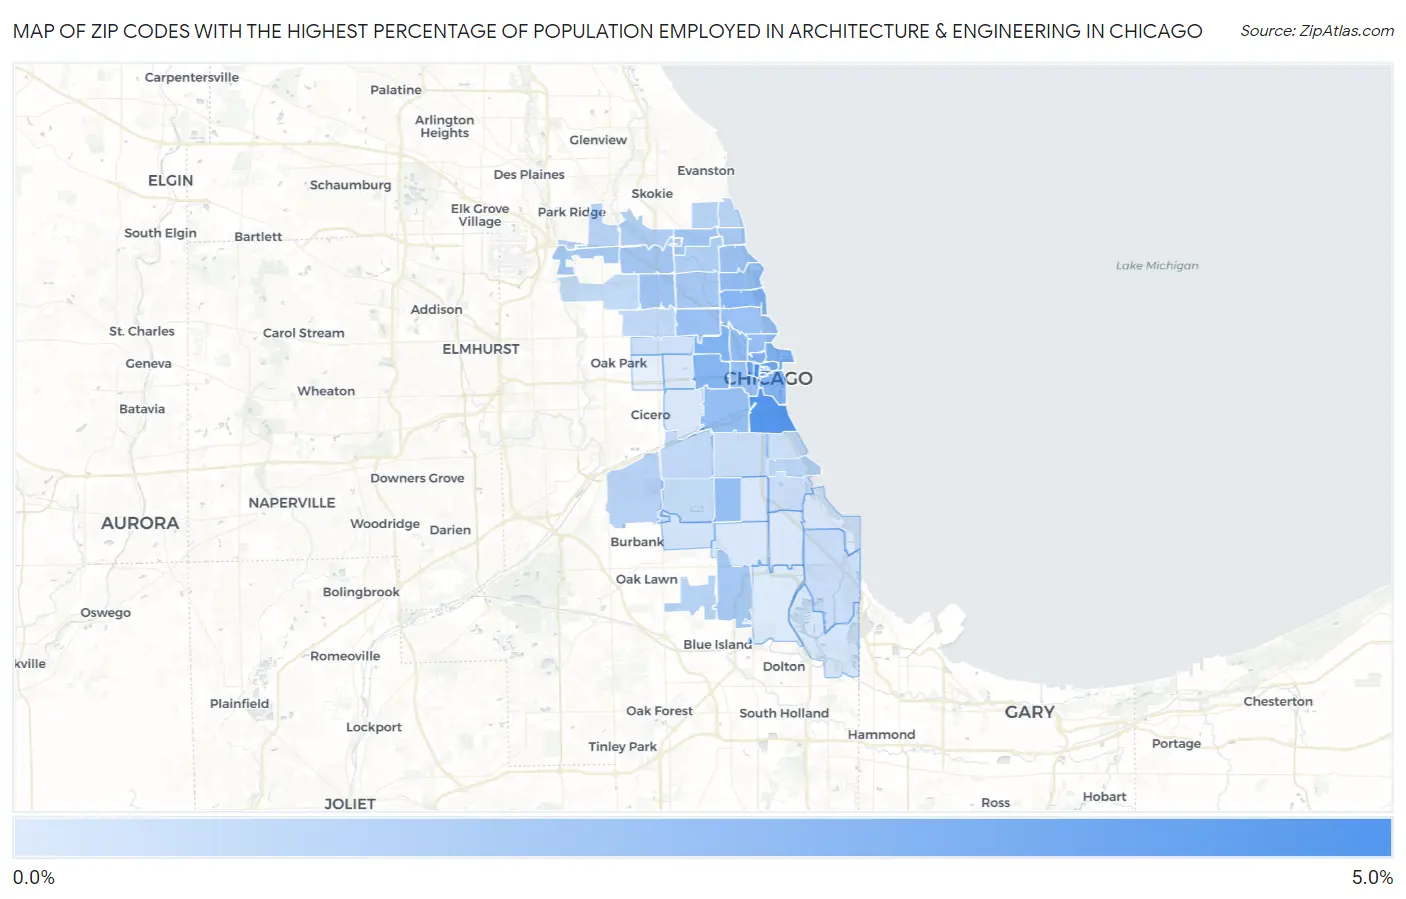
Map of Zip Codes with the Highest Percentage of Population Employed in Architecture & Engineering in Chicago
0.0%
5.0%
Zip Codes with the Highest Percentage of Population Employed in Architecture & Engineering in Chicago, IL
| Zip Code | % Employed | vs State | vs National | |
| 1. | 60603 | 4.6% | 1.9%(+2.71)#66 | 2.1%(+2.45)#2,017 |
| 2. | 60606 | 4.3% | 1.9%(+2.44)#73 | 2.1%(+2.19)#2,330 |
| 3. | 60616 | 4.2% | 1.9%(+2.29)#84 | 2.1%(+2.04)#2,505 |
| 4. | 60661 | 3.4% | 1.9%(+1.46)#146 | 2.1%(+1.20)#4,062 |
| 5. | 60601 | 3.3% | 1.9%(+1.44)#147 | 2.1%(+1.19)#4,094 |
| 6. | 60602 | 3.0% | 1.9%(+1.15)#183 | 2.1%(+0.890)#4,932 |
| 7. | 60654 | 2.9% | 1.9%(+1.05)#194 | 2.1%(+0.794)#5,262 |
| 8. | 60611 | 2.9% | 1.9%(+1.03)#197 | 2.1%(+0.774)#5,343 |
| 9. | 60622 | 2.9% | 1.9%(+1.01)#204 | 2.1%(+0.757)#5,398 |
| 10. | 60612 | 2.8% | 1.9%(+0.899)#220 | 2.1%(+0.644)#5,814 |
| 11. | 60657 | 2.7% | 1.9%(+0.842)#225 | 2.1%(+0.587)#6,016 |
| 12. | 60605 | 2.7% | 1.9%(+0.837)#228 | 2.1%(+0.582)#6,035 |
| 13. | 60604 | 2.7% | 1.9%(+0.784)#244 | 2.1%(+0.529)#6,249 |
| 14. | 60642 | 2.4% | 1.9%(+0.515)#286 | 2.1%(+0.261)#7,437 |
| 15. | 60613 | 2.4% | 1.9%(+0.474)#294 | 2.1%(+0.220)#7,626 |
| 16. | 60636 | 2.3% | 1.9%(+0.424)#304 | 2.1%(+0.169)#7,856 |
| 17. | 60608 | 2.3% | 1.9%(+0.389)#311 | 2.1%(+0.134)#8,039 |
| 18. | 60610 | 2.2% | 1.9%(+0.351)#316 | 2.1%(+0.096)#8,218 |
| 19. | 60607 | 2.2% | 1.9%(+0.326)#326 | 2.1%(+0.071)#8,376 |
| 20. | 60640 | 2.2% | 1.9%(+0.282)#337 | 2.1%(+0.027)#8,620 |
| 21. | 60647 | 2.1% | 1.9%(+0.211)#360 | 2.1%(-0.043)#9,015 |
| 22. | 60614 | 2.1% | 1.9%(+0.165)#374 | 2.1%(-0.089)#9,261 |
| 23. | 60641 | 2.0% | 1.9%(+0.096)#388 | 2.1%(-0.159)#9,667 |
| 24. | 60659 | 1.9% | 1.9%(+0.001)#421 | 2.1%(-0.254)#10,277 |
| 25. | 60630 | 1.8% | 1.9%(-0.056)#441 | 2.1%(-0.311)#10,620 |
| 26. | 60618 | 1.8% | 1.9%(-0.071)#446 | 2.1%(-0.326)#10,700 |
| 27. | 60656 | 1.8% | 1.9%(-0.130)#468 | 2.1%(-0.385)#11,046 |
| 28. | 60643 | 1.8% | 1.9%(-0.131)#469 | 2.1%(-0.386)#11,049 |
| 29. | 60660 | 1.7% | 1.9%(-0.167)#480 | 2.1%(-0.422)#11,313 |
| 30. | 60625 | 1.4% | 1.9%(-0.457)#561 | 2.1%(-0.712)#13,307 |
| 31. | 60646 | 1.4% | 1.9%(-0.463)#566 | 2.1%(-0.718)#13,348 |
| 32. | 60626 | 1.3% | 1.9%(-0.602)#599 | 2.1%(-0.856)#14,353 |
| 33. | 60631 | 1.3% | 1.9%(-0.620)#607 | 2.1%(-0.875)#14,494 |
| 34. | 60638 | 1.3% | 1.9%(-0.620)#608 | 2.1%(-0.875)#14,497 |
| 35. | 60645 | 1.3% | 1.9%(-0.624)#613 | 2.1%(-0.879)#14,525 |
| 36. | 60655 | 1.2% | 1.9%(-0.695)#633 | 2.1%(-0.950)#15,072 |
| 37. | 60615 | 1.2% | 1.9%(-0.727)#643 | 2.1%(-0.982)#15,347 |
| 38. | 60632 | 1.0% | 1.9%(-0.857)#690 | 2.1%(-1.11)#16,339 |
| 39. | 60639 | 1.0% | 1.9%(-0.869)#695 | 2.1%(-1.12)#16,431 |
| 40. | 60634 | 0.99% | 1.9%(-0.909)#705 | 2.1%(-1.16)#16,713 |
| 41. | 60629 | 0.88% | 1.9%(-1.02)#747 | 2.1%(-1.27)#17,563 |
| 42. | 60609 | 0.84% | 1.9%(-1.05)#767 | 2.1%(-1.31)#17,847 |
| 43. | 60617 | 0.75% | 1.9%(-1.14)#799 | 2.1%(-1.40)#18,508 |
| 44. | 60637 | 0.73% | 1.9%(-1.16)#807 | 2.1%(-1.42)#18,683 |
| 45. | 60653 | 0.67% | 1.9%(-1.23)#826 | 2.1%(-1.48)#19,119 |
| 46. | 60651 | 0.64% | 1.9%(-1.25)#839 | 2.1%(-1.51)#19,321 |
| 47. | 60652 | 0.51% | 1.9%(-1.39)#881 | 2.1%(-1.64)#20,228 |
| 48. | 60633 | 0.42% | 1.9%(-1.48)#907 | 2.1%(-1.73)#20,838 |
| 49. | 60623 | 0.34% | 1.9%(-1.55)#931 | 2.1%(-1.81)#21,335 |
| 50. | 60620 | 0.32% | 1.9%(-1.58)#937 | 2.1%(-1.83)#21,460 |
| 51. | 60649 | 0.31% | 1.9%(-1.58)#939 | 2.1%(-1.84)#21,484 |
| 52. | 60621 | 0.30% | 1.9%(-1.60)#945 | 2.1%(-1.85)#21,574 |
| 53. | 60624 | 0.30% | 1.9%(-1.60)#948 | 2.1%(-1.85)#21,581 |
| 54. | 60619 | 0.27% | 1.9%(-1.63)#956 | 2.1%(-1.88)#21,729 |
| 55. | 60628 | 0.23% | 1.9%(-1.66)#965 | 2.1%(-1.92)#21,895 |
1
Common Questions
What are the Top 10 Zip Codes with the Highest Percentage of Population Employed in Architecture & Engineering in Chicago, IL?
Top 10 Zip Codes with the Highest Percentage of Population Employed in Architecture & Engineering in Chicago, IL are:
What zip code has the Highest Percentage of Population Employed in Architecture & Engineering in Chicago, IL?
60603 has the Highest Percentage of Population Employed in Architecture & Engineering in Chicago, IL with 4.6%.
What is the Percentage of Population Employed in Architecture & Engineering in Chicago, IL?
Percentage of Population Employed in Architecture & Engineering in Chicago is 1.6%.
What is the Percentage of Population Employed in Architecture & Engineering in Illinois?
Percentage of Population Employed in Architecture & Engineering in Illinois is 1.9%.
What is the Percentage of Population Employed in Architecture & Engineering in the United States?
Percentage of Population Employed in Architecture & Engineering in the United States is 2.1%.