Zip Codes with the Highest Percentage of Population Employed in Life, Physical & Social Science in Chicago, IL
RELATED REPORTS & OPTIONS
Life, Physical & Social Science
Chicago
Compare Zip Codes
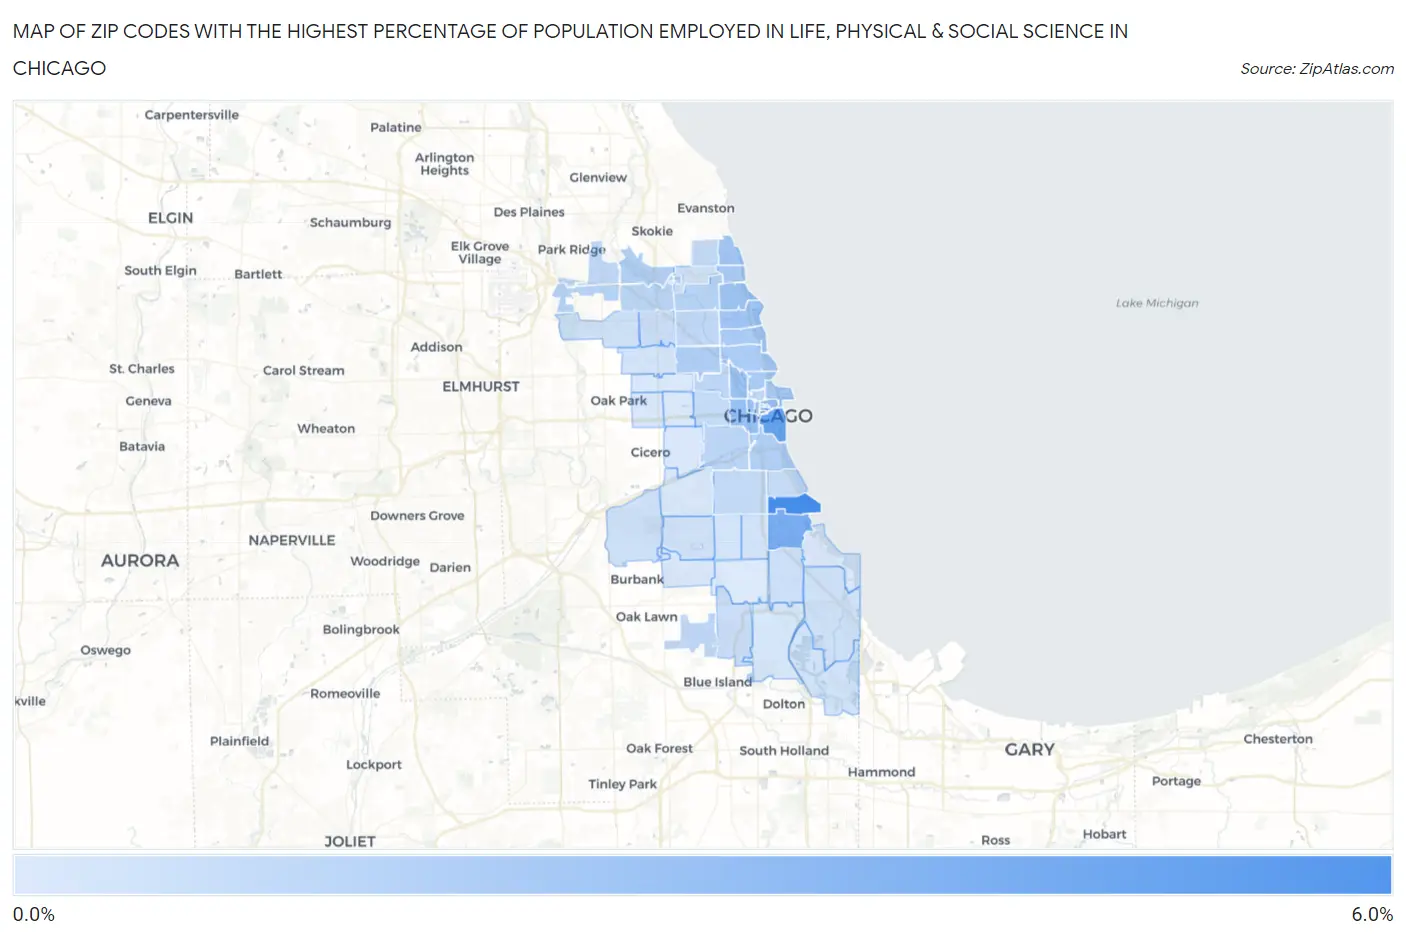
Map of Zip Codes with the Highest Percentage of Population Employed in Life, Physical & Social Science in Chicago
0.0%
6.0%
Zip Codes with the Highest Percentage of Population Employed in Life, Physical & Social Science in Chicago, IL
| Zip Code | % Employed | vs State | vs National | |
| 1. | 60615 | 5.2% | 0.98%(+4.22)#11 | 1.1%(+4.11)#712 |
| 2. | 60605 | 4.1% | 0.98%(+3.09)#23 | 1.1%(+2.97)#1,116 |
| 3. | 60603 | 3.9% | 0.98%(+2.93)#27 | 1.1%(+2.81)#1,214 |
| 4. | 60637 | 3.5% | 0.98%(+2.48)#31 | 1.1%(+2.37)#1,451 |
| 5. | 60601 | 2.5% | 0.98%(+1.50)#69 | 1.1%(+1.38)#2,615 |
| 6. | 60607 | 2.4% | 0.98%(+1.44)#73 | 1.1%(+1.32)#2,729 |
| 7. | 60642 | 2.3% | 0.98%(+1.33)#82 | 1.1%(+1.22)#2,934 |
| 8. | 60661 | 2.2% | 0.98%(+1.24)#87 | 1.1%(+1.13)#3,128 |
| 9. | 60640 | 2.2% | 0.98%(+1.17)#90 | 1.1%(+1.06)#3,294 |
| 10. | 60626 | 2.1% | 0.98%(+1.12)#98 | 1.1%(+1.01)#3,422 |
| 11. | 60613 | 2.1% | 0.98%(+1.11)#100 | 1.1%(+1.00)#3,443 |
| 12. | 60611 | 1.8% | 0.98%(+0.857)#131 | 1.1%(+0.745)#4,190 |
| 13. | 60610 | 1.8% | 0.98%(+0.802)#144 | 1.1%(+0.689)#4,396 |
| 14. | 60657 | 1.7% | 0.98%(+0.753)#150 | 1.1%(+0.641)#4,581 |
| 15. | 60614 | 1.7% | 0.98%(+0.720)#156 | 1.1%(+0.608)#4,735 |
| 16. | 60660 | 1.7% | 0.98%(+0.684)#158 | 1.1%(+0.571)#4,889 |
| 17. | 60647 | 1.6% | 0.98%(+0.666)#163 | 1.1%(+0.554)#4,973 |
| 18. | 60606 | 1.6% | 0.98%(+0.586)#173 | 1.1%(+0.474)#5,318 |
| 19. | 60616 | 1.4% | 0.98%(+0.443)#202 | 1.1%(+0.331)#6,077 |
| 20. | 60646 | 1.4% | 0.98%(+0.410)#214 | 1.1%(+0.298)#6,258 |
| 21. | 60625 | 1.3% | 0.98%(+0.275)#251 | 1.1%(+0.163)#7,101 |
| 22. | 60656 | 1.2% | 0.98%(+0.257)#257 | 1.1%(+0.145)#7,227 |
| 23. | 60630 | 1.1% | 0.98%(+0.164)#276 | 1.1%(+0.052)#7,908 |
| 24. | 60622 | 1.1% | 0.98%(+0.159)#279 | 1.1%(+0.047)#7,951 |
| 25. | 60608 | 1.1% | 0.98%(+0.142)#284 | 1.1%(+0.030)#8,066 |
| 26. | 60654 | 0.99% | 0.98%(+0.013)#325 | 1.1%(-0.099)#9,113 |
| 27. | 60618 | 0.97% | 0.98%(-0.013)#338 | 1.1%(-0.125)#9,360 |
| 28. | 60655 | 0.97% | 0.98%(-0.013)#339 | 1.1%(-0.125)#9,361 |
| 29. | 60631 | 0.95% | 0.98%(-0.026)#344 | 1.1%(-0.138)#9,473 |
| 30. | 60609 | 0.92% | 0.98%(-0.059)#368 | 1.1%(-0.171)#9,766 |
| 31. | 60604 | 0.89% | 0.98%(-0.086)#382 | 1.1%(-0.198)#10,027 |
| 32. | 60645 | 0.89% | 0.98%(-0.090)#387 | 1.1%(-0.202)#10,066 |
| 33. | 60612 | 0.79% | 0.98%(-0.184)#422 | 1.1%(-0.296)#11,051 |
| 34. | 60653 | 0.76% | 0.98%(-0.216)#430 | 1.1%(-0.328)#11,371 |
| 35. | 60641 | 0.70% | 0.98%(-0.283)#455 | 1.1%(-0.395)#12,080 |
| 36. | 60643 | 0.64% | 0.98%(-0.336)#489 | 1.1%(-0.448)#12,741 |
| 37. | 60619 | 0.62% | 0.98%(-0.357)#507 | 1.1%(-0.470)#13,028 |
| 38. | 60634 | 0.52% | 0.98%(-0.456)#558 | 1.1%(-0.568)#14,234 |
| 39. | 60638 | 0.50% | 0.98%(-0.476)#574 | 1.1%(-0.588)#14,465 |
| 40. | 60617 | 0.50% | 0.98%(-0.482)#577 | 1.1%(-0.594)#14,546 |
| 41. | 60633 | 0.45% | 0.98%(-0.525)#601 | 1.1%(-0.637)#15,104 |
| 42. | 60621 | 0.45% | 0.98%(-0.533)#607 | 1.1%(-0.645)#15,184 |
| 43. | 60629 | 0.41% | 0.98%(-0.565)#623 | 1.1%(-0.678)#15,583 |
| 44. | 60659 | 0.41% | 0.98%(-0.568)#627 | 1.1%(-0.681)#15,612 |
| 45. | 60639 | 0.36% | 0.98%(-0.617)#664 | 1.1%(-0.730)#16,264 |
| 46. | 60636 | 0.35% | 0.98%(-0.627)#677 | 1.1%(-0.739)#16,382 |
| 47. | 60628 | 0.30% | 0.98%(-0.677)#714 | 1.1%(-0.790)#17,044 |
| 48. | 60632 | 0.22% | 0.98%(-0.762)#754 | 1.1%(-0.874)#18,007 |
| 49. | 60644 | 0.21% | 0.98%(-0.767)#756 | 1.1%(-0.879)#18,060 |
| 50. | 60623 | 0.17% | 0.98%(-0.813)#770 | 1.1%(-0.926)#18,544 |
| 51. | 60651 | 0.16% | 0.98%(-0.818)#772 | 1.1%(-0.930)#18,581 |
| 52. | 60649 | 0.15% | 0.98%(-0.828)#775 | 1.1%(-0.940)#18,677 |
| 53. | 60652 | 0.12% | 0.98%(-0.860)#783 | 1.1%(-0.972)#18,950 |
| 54. | 60624 | 0.091% | 0.98%(-0.888)#793 | 1.1%(-1.00)#19,130 |
| 55. | 60620 | 0.051% | 0.98%(-0.928)#804 | 1.1%(-1.04)#19,332 |
1
Common Questions
What are the Top 10 Zip Codes with the Highest Percentage of Population Employed in Life, Physical & Social Science in Chicago, IL?
Top 10 Zip Codes with the Highest Percentage of Population Employed in Life, Physical & Social Science in Chicago, IL are:
What zip code has the Highest Percentage of Population Employed in Life, Physical & Social Science in Chicago, IL?
60615 has the Highest Percentage of Population Employed in Life, Physical & Social Science in Chicago, IL with 5.2%.
What is the Percentage of Population Employed in Life, Physical & Social Science in Chicago, IL?
Percentage of Population Employed in Life, Physical & Social Science in Chicago is 1.2%.
What is the Percentage of Population Employed in Life, Physical & Social Science in Illinois?
Percentage of Population Employed in Life, Physical & Social Science in Illinois is 0.98%.
What is the Percentage of Population Employed in Life, Physical & Social Science in the United States?
Percentage of Population Employed in Life, Physical & Social Science in the United States is 1.1%.