Zip Codes with the Highest Percentage of Population Employed in Health Diagnosing & Treating in Glenview, IL
RELATED REPORTS & OPTIONS
Health Diagnosing & Treating
Glenview
Compare Zip Codes
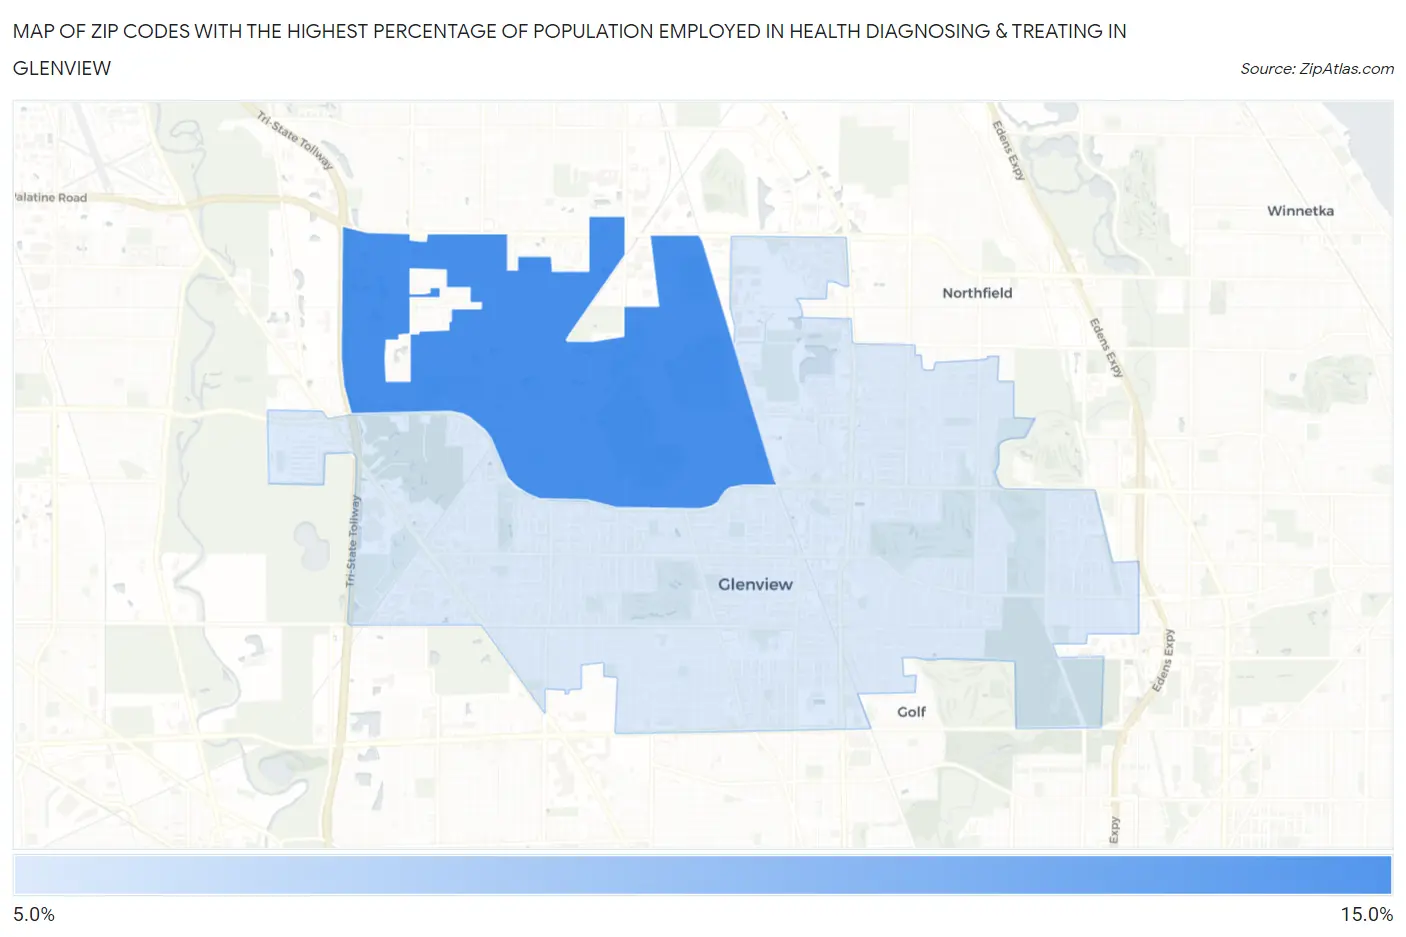
Map of Zip Codes with the Highest Percentage of Population Employed in Health Diagnosing & Treating in Glenview
0.0%
15.0%
Zip Codes with the Highest Percentage of Population Employed in Health Diagnosing & Treating in Glenview, IL
| Zip Code | % Employed | vs State | vs National | |
| 1. | 60026 | 14.5% | 6.2%(+8.25)#64 | 6.2%(+8.24)#1,265 |
| 2. | 60025 | 8.0% | 6.2%(+1.80)#369 | 6.2%(+1.80)#7,388 |
1
Common Questions
What are the Top Zip Codes with the Highest Percentage of Population Employed in Health Diagnosing & Treating in Glenview, IL?
Top Zip Codes with the Highest Percentage of Population Employed in Health Diagnosing & Treating in Glenview, IL are:
What zip code has the Highest Percentage of Population Employed in Health Diagnosing & Treating in Glenview, IL?
60026 has the Highest Percentage of Population Employed in Health Diagnosing & Treating in Glenview, IL with 14.5%.
What is the Percentage of Population Employed in Health Diagnosing & Treating in Glenview, IL?
Percentage of Population Employed in Health Diagnosing & Treating in Glenview is 9.6%.
What is the Percentage of Population Employed in Health Diagnosing & Treating in Illinois?
Percentage of Population Employed in Health Diagnosing & Treating in Illinois is 6.2%.
What is the Percentage of Population Employed in Health Diagnosing & Treating in the United States?
Percentage of Population Employed in Health Diagnosing & Treating in the United States is 6.2%.