Zip Codes with the Highest Percentage of Population Employed in Health Diagnosing & Treating in East Saint Louis, IL
RELATED REPORTS & OPTIONS
Health Diagnosing & Treating
East Saint Louis
Compare Zip Codes
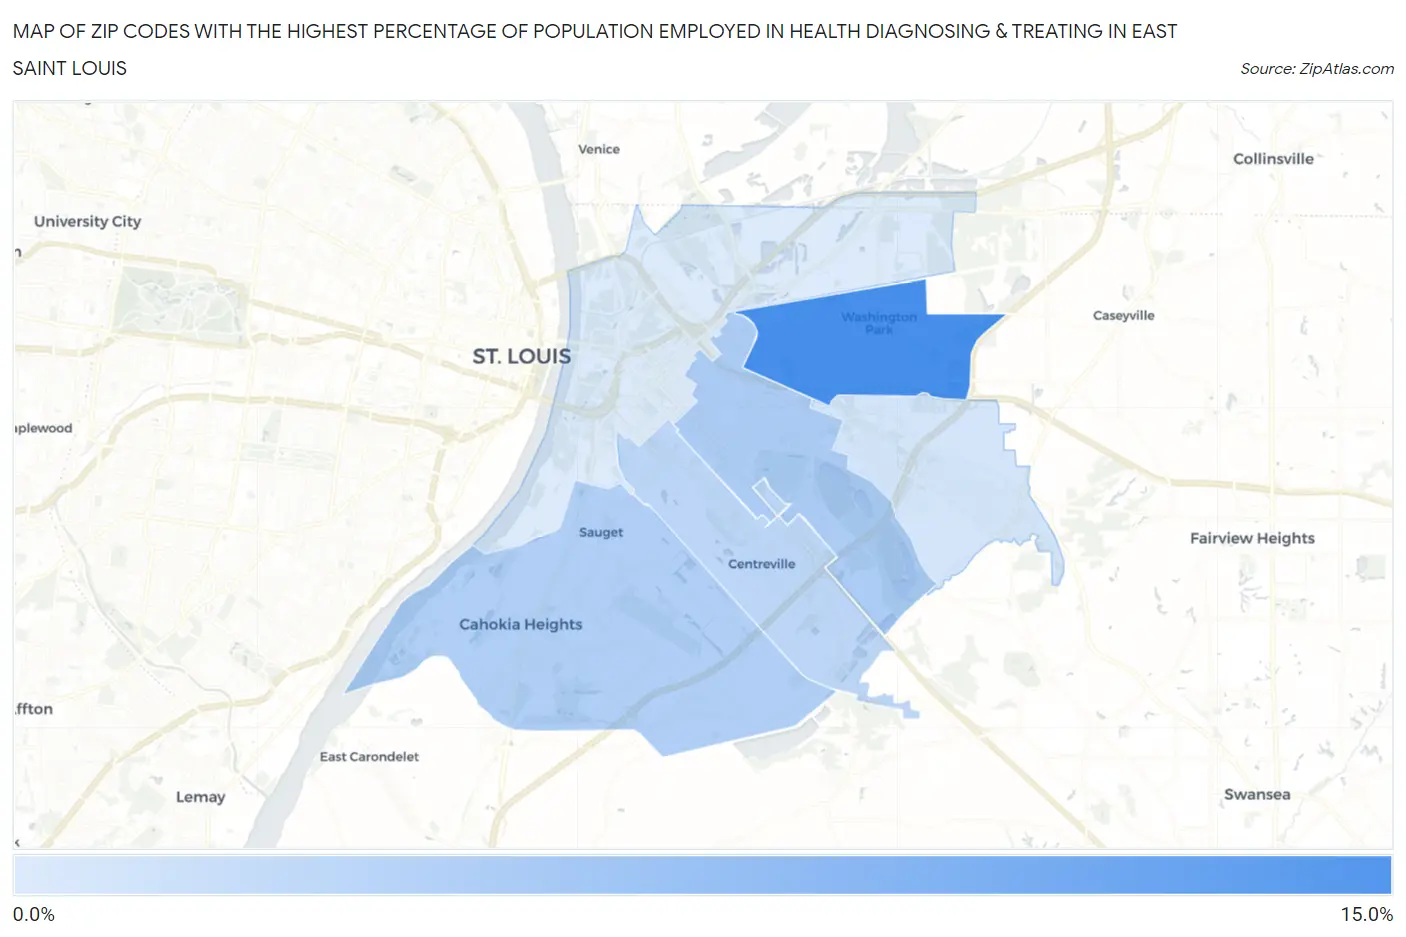
Map of Zip Codes with the Highest Percentage of Population Employed in Health Diagnosing & Treating in East Saint Louis
0.0%
15.0%
Zip Codes with the Highest Percentage of Population Employed in Health Diagnosing & Treating in East Saint Louis, IL
| Zip Code | % Employed | vs State | vs National | |
| 1. | 62204 | 13.4% | 6.2%(+7.17)#83 | 6.2%(+7.16)#1,608 |
| 2. | 62205 | 4.3% | 6.2%(-1.92)#963 | 6.2%(-1.93)#20,277 |
| 3. | 62206 | 4.1% | 6.2%(-2.17)#1,004 | 6.2%(-2.18)#21,167 |
| 4. | 62207 | 3.1% | 6.2%(-3.16)#1,123 | 6.2%(-3.16)#24,125 |
| 5. | 62203 | 1.0% | 6.2%(-5.20)#1,267 | 6.2%(-5.21)#27,802 |
| 6. | 62201 | 0.32% | 6.2%(-5.92)#1,287 | 6.2%(-5.93)#28,404 |
1
Common Questions
What are the Top 5 Zip Codes with the Highest Percentage of Population Employed in Health Diagnosing & Treating in East Saint Louis, IL?
Top 5 Zip Codes with the Highest Percentage of Population Employed in Health Diagnosing & Treating in East Saint Louis, IL are:
What zip code has the Highest Percentage of Population Employed in Health Diagnosing & Treating in East Saint Louis, IL?
62204 has the Highest Percentage of Population Employed in Health Diagnosing & Treating in East Saint Louis, IL with 13.4%.
What is the Percentage of Population Employed in Health Diagnosing & Treating in Illinois?
Percentage of Population Employed in Health Diagnosing & Treating in Illinois is 6.2%.
What is the Percentage of Population Employed in Health Diagnosing & Treating in the United States?
Percentage of Population Employed in Health Diagnosing & Treating in the United States is 6.2%.