Immigrants from Bangladesh vs Laotian Self-Care Disability

COMPARE

Immigrants from Bangladesh
Race
Ancestry
AfghanAfricanAlaska NativeAlaskan AthabascanAlbanianAleutAlsatianAmericanApacheArabArapahoArgentineanArmenianAssyrian/Chaldean/SyriacAustralianAustrianBahamianBangladeshiBarbadianBasqueBelgianBelizeanBermudanBhutaneseBlackfeetBolivianBrazilianBritishBritish West IndianBulgarianBurmeseCajunCambodianCanadianCape VerdeanCarpatho RusynCelticCentral AmericanCentral American IndianCherokeeCheyenneChickasawChileanChineseChippewaChoctawColombianColvilleComancheCosta RicanCreeCreekCroatianCrowCubanCypriotCzechCzechoslovakianDanishDelawareDominicanDutchDutch West IndianEastern EuropeanEcuadorianEgyptianEnglishEstonianEthiopianEuropeanFijianFilipinoFinnishFrenchFrench American IndianFrench CanadianGermanGerman RussianGhanaianGreekGuamanian/ChamorroGuatemalanGuyaneseHaitianHmongHonduranHopiHoumaHungarianIcelanderIndian (Asian)IndonesianInupiatIranianIraqiIrishIroquoisIsraeliItalianJamaicanJapaneseJordanianKenyanKiowaKoreanLatvianLebaneseLiberianLithuanianLumbeeLuxembourgerMacedonianMalaysianMalteseMarshalleseMenomineeMexicanMexican American IndianMongolianMoroccanNative HawaiianNavajoNepaleseNew ZealanderNicaraguanNigerianNorthern EuropeanNorwegianOkinawanOsageOttawaPaiutePakistaniPalestinianPanamanianParaguayanPennsylvania GermanPeruvianPimaPolishPortuguesePotawatomiPuebloPuerto RicanPuget Sound SalishRomanianRussianSalvadoranSamoanScandinavianScotch-IrishScottishSeminoleSenegaleseSerbianShoshoneSierra LeoneanSiouxSlavicSlovakSloveneSomaliSouth AfricanSouth AmericanSouth American IndianSoviet UnionSpaniardSpanishSpanish AmericanSpanish American IndianSri LankanSubsaharan AfricanSudaneseSwedishSwissSyrianTaiwaneseThaiTlingit-HaidaTohono O'OdhamTonganTrinidadian and TobagonianTsimshianTurkishU.S. Virgin IslanderUgandanUkrainianUruguayanUteVenezuelanVietnameseWelshWest IndianYakamaYaquiYugoslavianYumanYup'ikZimbabwean
Immigration
NonimmigrantsImmigrantsAfghanistanAfricaAlbaniaArgentinaArmeniaAsiaAustraliaAustriaBahamasBangladeshBarbadosBelarusBelgiumBelizeBoliviaBosnia and HerzegovinaBrazilBulgariaBurma/MyanmarCabo VerdeCambodiaCameroonCanadaCaribbeanCentral AmericaChileChinaColombiaCongoCosta RicaCroatiaCubaCzechoslovakiaDenmarkDominicaDominican RepublicEastern AfricaEastern AsiaEastern EuropeEcuadorEgyptEl SalvadorEnglandEritreaEthiopiaEuropeFijiFranceGermanyGhanaGreeceGrenadaGuatemalaGuyanaHaitiHondurasHong KongHungaryIndiaIndonesiaIranIraqIrelandIsraelItalyJamaicaJapanJordanKazakhstanKenyaKoreaKuwaitLaosLatin AmericaLatviaLebanonLiberiaLithuaniaMalaysiaMexicoMicronesiaMiddle AfricaMoldovaMoroccoNepalNetherlandsNicaraguaNigeriaNorth AmericaNorth MacedoniaNorthern AfricaNorthern EuropeNorwayOceaniaPakistanPanamaPeruPhilippinesPolandPortugalRomaniaRussiaSaudi ArabiaScotlandSenegalSerbiaSierra LeoneSingaporeSomaliaSouth AfricaSouth AmericaSouth Central AsiaSouth Eastern AsiaSouthern EuropeSpainSri LankaSt. Vincent and the GrenadinesSudanSwedenSwitzerlandSyriaTaiwanThailandTrinidad and TobagoTurkeyUgandaUkraineUruguayUzbekistanVenezuelaVietnamWest IndiesWestern AfricaWestern AsiaWestern EuropeYemenZaireZimbabweAzores
Laotian
Race
Ancestry
AfghanAfricanAlaska NativeAlaskan AthabascanAlbanianAleutAlsatianAmericanApacheArabArapahoArgentineanArmenianAssyrian/Chaldean/SyriacAustralianAustrianBahamianBangladeshiBarbadianBasqueBelgianBelizeanBermudanBhutaneseBlackfeetBolivianBrazilianBritishBritish West IndianBulgarianBurmeseCajunCambodianCanadianCape VerdeanCarpatho RusynCelticCentral AmericanCentral American IndianCherokeeCheyenneChickasawChileanChineseChippewaChoctawColombianColvilleComancheCosta RicanCreeCreekCroatianCrowCubanCypriotCzechCzechoslovakianDanishDelawareDominicanDutchDutch West IndianEastern EuropeanEcuadorianEgyptianEnglishEstonianEthiopianEuropeanFijianFilipinoFinnishFrenchFrench American IndianFrench CanadianGermanGerman RussianGhanaianGreekGuamanian/ChamorroGuatemalanGuyaneseHaitianHmongHonduranHopiHoumaHungarianIcelanderIndian (Asian)IndonesianInupiatIranianIraqiIrishIroquoisIsraeliItalianJamaicanJapaneseJordanianKenyanKiowaKoreanLaotianLatvianLebaneseLiberianLithuanianLumbeeLuxembourgerMacedonianMalaysianMalteseMarshalleseMenomineeMexicanMexican American IndianMongolianMoroccanNative HawaiianNavajoNepaleseNew ZealanderNicaraguanNigerianNorthern EuropeanNorwegianOkinawanOsageOttawaPaiutePakistaniPalestinianPanamanianParaguayanPennsylvania GermanPeruvianPimaPolishPortuguesePotawatomiPuebloPuerto RicanPuget Sound SalishRomanianRussianSalvadoranSamoanScandinavianScotch-IrishScottishSeminoleSenegaleseSerbianShoshoneSierra LeoneanSiouxSlavicSlovakSloveneSomaliSouth AfricanSouth AmericanSouth American IndianSoviet UnionSpaniardSpanishSpanish AmericanSpanish American IndianSri LankanSubsaharan AfricanSudaneseSwedishSwissSyrianTaiwaneseThaiTlingit-HaidaTohono O'OdhamTonganTrinidadian and TobagonianTsimshianTurkishU.S. Virgin IslanderUgandanUkrainianUruguayanUteVenezuelanVietnameseWelshWest IndianYakamaYaquiYugoslavianYumanYup'ikZimbabwean
Immigration
NonimmigrantsImmigrantsAfghanistanAfricaAlbaniaArgentinaArmeniaAsiaAustraliaAustriaBahamasBarbadosBelarusBelgiumBelizeBoliviaBosnia and HerzegovinaBrazilBulgariaBurma/MyanmarCabo VerdeCambodiaCameroonCanadaCaribbeanCentral AmericaChileChinaColombiaCongoCosta RicaCroatiaCubaCzechoslovakiaDenmarkDominicaDominican RepublicEastern AfricaEastern AsiaEastern EuropeEcuadorEgyptEl SalvadorEnglandEritreaEthiopiaEuropeFijiFranceGermanyGhanaGreeceGrenadaGuatemalaGuyanaHaitiHondurasHong KongHungaryIndiaIndonesiaIranIraqIrelandIsraelItalyJamaicaJapanJordanKazakhstanKenyaKoreaKuwaitLaosLatin AmericaLatviaLebanonLiberiaLithuaniaMalaysiaMexicoMicronesiaMiddle AfricaMoldovaMoroccoNepalNetherlandsNicaraguaNigeriaNorth AmericaNorth MacedoniaNorthern AfricaNorthern EuropeNorwayOceaniaPakistanPanamaPeruPhilippinesPolandPortugalRomaniaRussiaSaudi ArabiaScotlandSenegalSerbiaSierra LeoneSingaporeSomaliaSouth AfricaSouth AmericaSouth Central AsiaSouth Eastern AsiaSouthern EuropeSpainSri LankaSt. Vincent and the GrenadinesSudanSwedenSwitzerlandSyriaTaiwanThailandTrinidad and TobagoTurkeyUgandaUkraineUruguayUzbekistanVenezuelaVietnamWest IndiesWestern AfricaWestern AsiaWestern EuropeYemenZaireZimbabweAzores
Self-Care Disability
Income
Poverty
Unemployment
Labor Participation
Family Structure
Vehicle Availability
Education Level
Disability

Self-Care Disability Comparison

Immigrants from Bangladesh

Laotians

Tragic
Excellent
2.6%
SELF-CARE DISABILITY
0.4/ 100
METRIC RATING
252nd/ 347
METRIC RANK
2.4%
SELF-CARE DISABILITY
87.8/ 100
METRIC RATING
135th/ 347
METRIC RANK

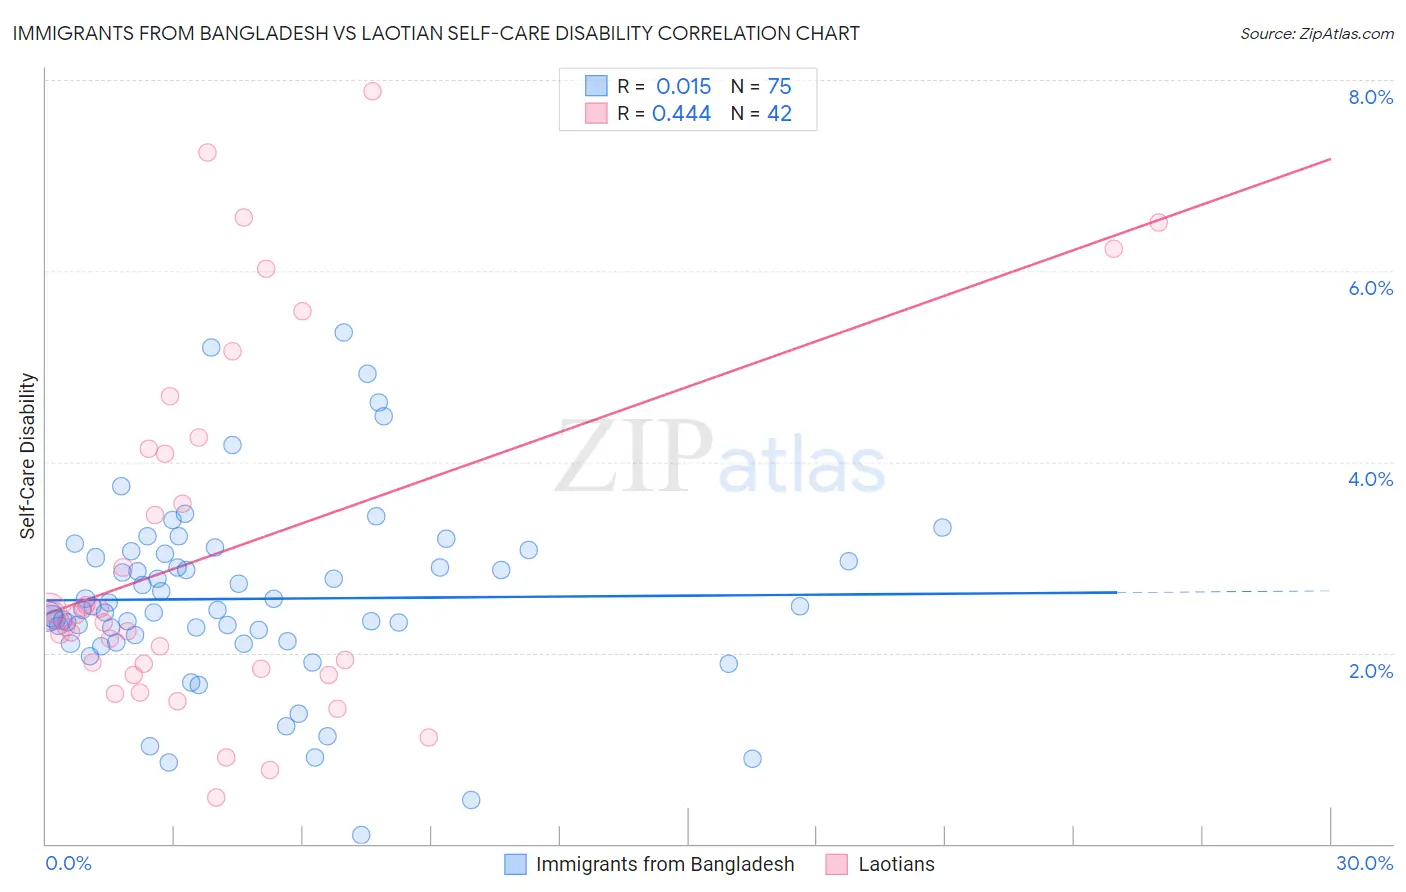
Immigrants from Bangladesh vs Laotian Self-Care Disability Correlation Chart

The statistical analysis conducted on geographies consisting of 203,543,438 people shows no correlation between the proportion of Immigrants from Bangladesh and percentage of population with self-care disability in the United States with a correlation coefficient (R) of 0.015 and weighted average of 2.6%. Similarly, the statistical analysis conducted on geographies consisting of 224,705,626 people shows a moderate positive correlation between the proportion of Laotians and percentage of population with self-care disability in the United States with a correlation coefficient (R) of 0.444 and weighted average of 2.4%, a difference of 9.2%.
Immigrants from Bangladesh vs Laotian Self-Care Disability

Self-Care Disability Correlation Summary

MeasurementImmigrants from BangladeshLaotian
Minimum0.094%0.49%
Maximum5.4%7.9%
Range5.3%7.4%
Mean2.6%3.1%
Median2.4%2.4%
Interquartile 25% (IQ1)2.1%1.8%
Interquartile 75% (IQ3)3.0%4.1%
Interquartile Range (IQR)0.92%2.3%
Standard Deviation (Sample)0.97%1.9%
Standard Deviation (Population)0.97%1.9%

Similar Demographics by Self-Care Disability

Demographics Similar to Immigrants from Bangladesh by Self-Care Disability

In terms of self-care disability, the demographic groups most similar to Immigrants from Bangladesh are Immigrants from Liberia (2.6%, a difference of 0.070%), Immigrants from Haiti (2.6%, a difference of 0.080%), Haitian (2.6%, a difference of 0.10%), Tsimshian (2.6%, a difference of 0.14%), and Portuguese (2.6%, a difference of 0.15%).
DemographicsRating | RankSelf-Care Disability
Immigrants | Western Asia
0.6
/100
|
#245
Tragic
2.6%
Cheyenne
0.6
/100
|
#246
Tragic
2.6%
Immigrants | Albania
0.6
/100
|
#247
Tragic
2.6%
Nicaraguans
0.6
/100
|
#248
Tragic
2.6%
Mexican American Indians
0.5
/100
|
#249
Tragic
2.6%
Portuguese
0.4
/100
|
#250
Tragic
2.6%
Immigrants | Liberia
0.4
/100
|
#251
Tragic
2.6%
Immigrants | Bangladesh
0.4
/100
|
#252
Tragic
2.6%
Immigrants | Haiti
0.3
/100
|
#253
Tragic
2.6%
Haitians
0.3
/100
|
#254
Tragic
2.6%
Tsimshian
0.3
/100
|
#255
Tragic
2.6%
Immigrants | Central America
0.3
/100
|
#256
Tragic
2.6%
Potawatomi
0.3
/100
|
#257
Tragic
2.6%
Immigrants | Nonimmigrants
0.3
/100
|
#258
Tragic
2.6%
Immigrants | Belarus
0.2
/100
|
#259
Tragic
2.6%

Demographics Similar to Laotians by Self-Care Disability

In terms of self-care disability, the demographic groups most similar to Laotians are Russian (2.4%, a difference of 0.050%), South American Indian (2.4%, a difference of 0.070%), Austrian (2.4%, a difference of 0.080%), Immigrants from Colombia (2.4%, a difference of 0.090%), and Immigrants from South America (2.4%, a difference of 0.12%).
DemographicsRating | RankSelf-Care Disability
Immigrants | Hungary
89.6
/100
|
#128
Excellent
2.4%
Immigrants | Romania
89.3
/100
|
#129
Excellent
2.4%
Immigrants | Austria
89.0
/100
|
#130
Excellent
2.4%
Poles
88.9
/100
|
#131
Excellent
2.4%
Immigrants | South America
88.8
/100
|
#132
Excellent
2.4%
Immigrants | Colombia
88.5
/100
|
#133
Excellent
2.4%
Russians
88.2
/100
|
#134
Excellent
2.4%
Laotians
87.8
/100
|
#135
Excellent
2.4%
South American Indians
87.2
/100
|
#136
Excellent
2.4%
Austrians
87.0
/100
|
#137
Excellent
2.4%
Immigrants | Croatia
86.6
/100
|
#138
Excellent
2.4%
Sri Lankans
86.6
/100
|
#139
Excellent
2.4%
Immigrants | Uruguay
85.4
/100
|
#140
Excellent
2.4%
Alaska Natives
84.5
/100
|
#141
Excellent
2.4%
Immigrants | Peru
83.2
/100
|
#142
Excellent
2.4%