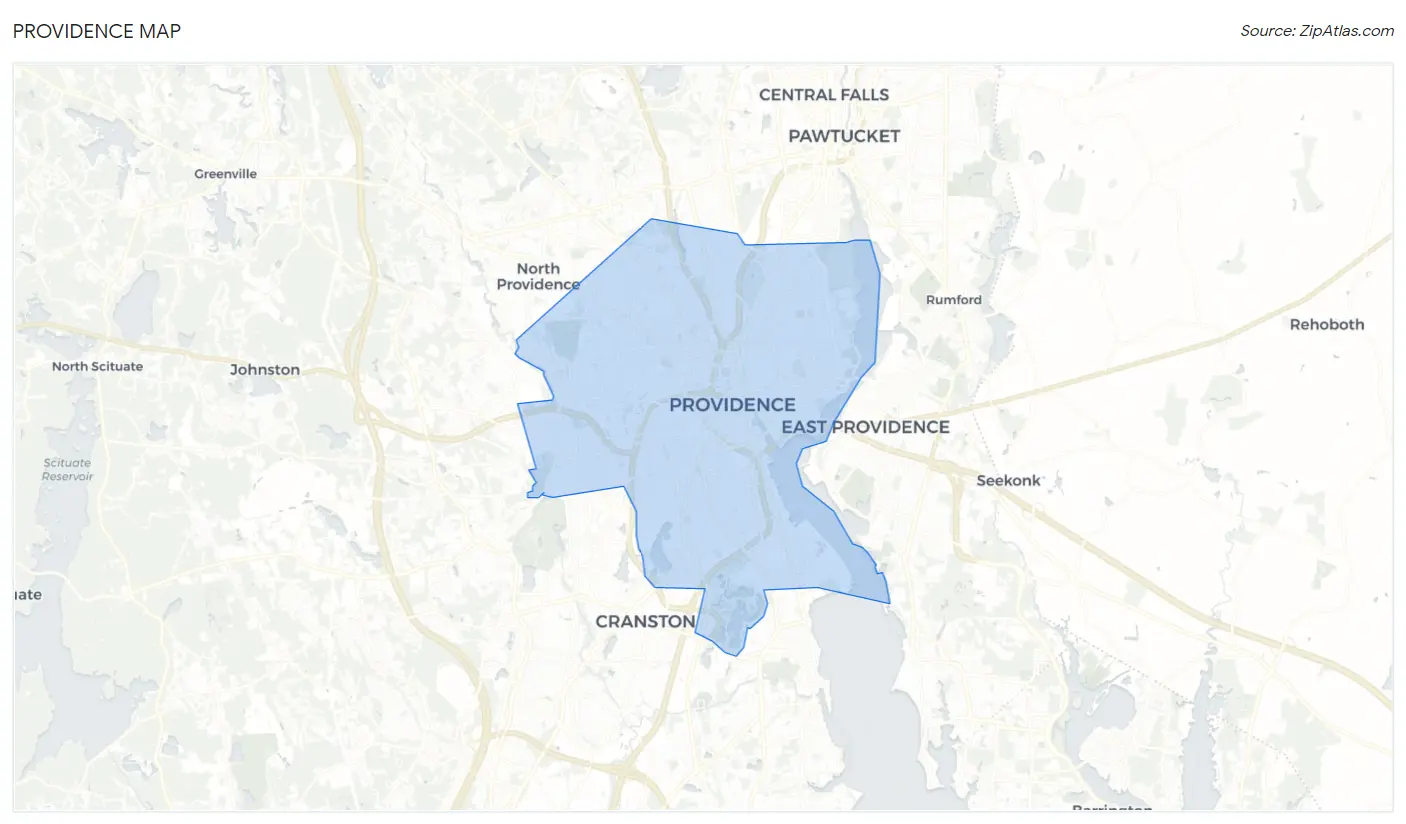
Providence, RI
Providence Map
Providence Overview
189,715
TOTAL POPULATION
91,997
MALE POPULATION
97,718
FEMALE POPULATION
94.15
MALES / 100 FEMALES
106.22
FEMALES / 100 MALES
32.3
MEDIAN AGE
3.3
AVG FAMILY SIZE
2.5
AVG HOUSEHOLD SIZE
$34,521
PER CAPITA INCOME
$71,737
AVG FAMILY INCOME
$61,365
AVG HOUSEHOLD INCOME
22.4%
WAGE / INCOME GAP [ % ]
77.6¢/ $1
WAGE / INCOME GAP [ $ ]
$11,534
FAMILY INCOME DEFICIT
0.51
INEQUALITY / GINI INDEX
97,845
LABOR FORCE [ PEOPLE ]
63.1%
PERCENT IN LABOR FORCE
7.2%
UNEMPLOYMENT RATE
Providence Area Codes
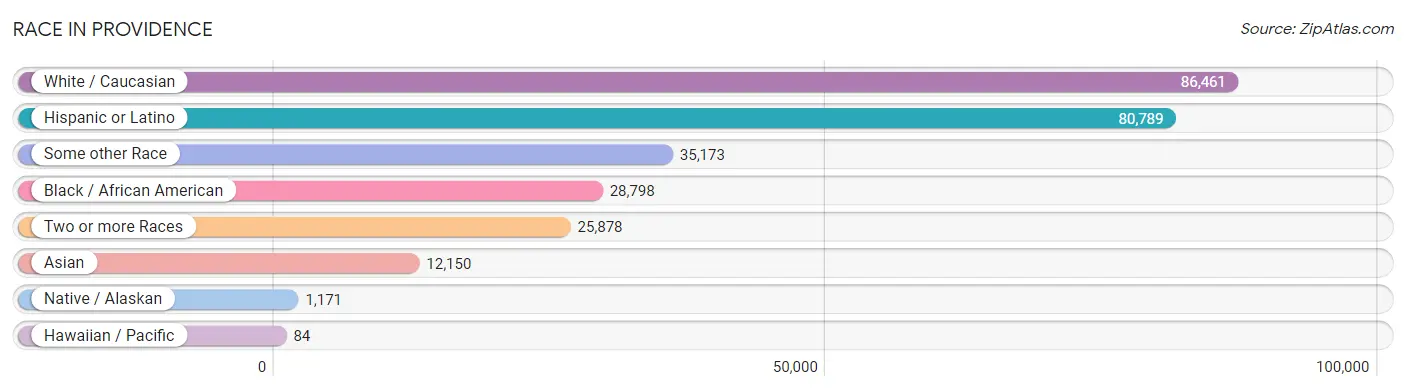
Race in Providence
The most populous races in Providence are White / Caucasian (86,461 | 45.6%), Hispanic or Latino (80,789 | 42.6%), and Some other Race (35,173 | 18.5%).
| Race | # Population | % Population |
| Asian | 12,150 | 6.4% |
| Black / African American | 28,798 | 15.2% |
| Hawaiian / Pacific | 84 | 0.0% |
| Hispanic or Latino | 80,789 | 42.6% |
| Native / Alaskan | 1,171 | 0.6% |
| White / Caucasian | 86,461 | 45.6% |
| Two or more Races | 25,878 | 13.6% |
| Some other Race | 35,173 | 18.5% |
| Total | 189,715 | 100.0% |
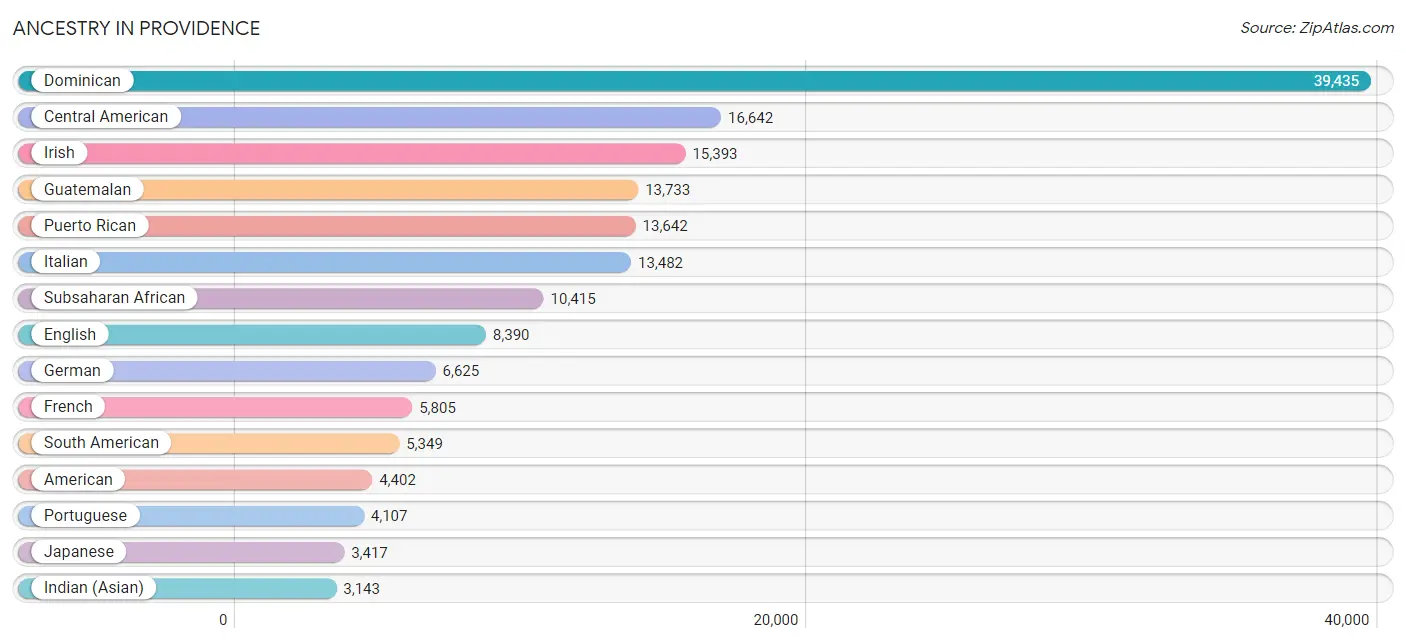
Ancestry in Providence
The most populous ancestries reported in Providence are Dominican (39,435 | 20.8%), Central American (16,642 | 8.8%), Irish (15,393 | 8.1%), Guatemalan (13,733 | 7.2%), and Puerto Rican (13,642 | 7.2%), together accounting for 52.1% of all Providence residents.
| Ancestry | # Population | % Population |
| Afghan | 4 | 0.0% |
| African | 2,641 | 1.4% |
| Albanian | 222 | 0.1% |
| Alsatian | 22 | 0.0% |
| American | 4,402 | 2.3% |
| Apache | 6 | 0.0% |
| Arab | 1,676 | 0.9% |
| Argentinean | 126 | 0.1% |
| Armenian | 718 | 0.4% |
| Assyrian / Chaldean / Syriac | 8 | 0.0% |
| Australian | 31 | 0.0% |
| Austrian | 205 | 0.1% |
| Bangladeshi | 559 | 0.3% |
| Barbadian | 108 | 0.1% |
| Belgian | 116 | 0.1% |
| Belizean | 39 | 0.0% |
| Bhutanese | 410 | 0.2% |
| Blackfeet | 78 | 0.0% |
| Bolivian | 808 | 0.4% |
| Brazilian | 247 | 0.1% |
| British | 539 | 0.3% |
| British West Indian | 53 | 0.0% |
| Burmese | 1,113 | 0.6% |
| Canadian | 305 | 0.2% |
| Cape Verdean | 2,821 | 1.5% |
| Central American | 16,642 | 8.8% |
| Central American Indian | 1,147 | 0.6% |
| Cherokee | 115 | 0.1% |
| Chilean | 110 | 0.1% |
| Chippewa | 5 | 0.0% |
| Choctaw | 64 | 0.0% |
| Colombian | 2,550 | 1.3% |
| Costa Rican | 238 | 0.1% |
| Croatian | 60 | 0.0% |
| Cuban | 391 | 0.2% |
| Czech | 280 | 0.2% |
| Czechoslovakian | 45 | 0.0% |
| Danish | 208 | 0.1% |
| Dominican | 39,435 | 20.8% |
| Dutch | 568 | 0.3% |
| Eastern European | 1,030 | 0.5% |
| Ecuadorian | 1,041 | 0.5% |
| Egyptian | 66 | 0.0% |
| English | 8,390 | 4.4% |
| Ethiopian | 41 | 0.0% |
| European | 1,471 | 0.8% |
| Filipino | 181 | 0.1% |
| Finnish | 95 | 0.1% |
| French | 5,805 | 3.1% |
| French American Indian | 1 | 0.0% |
| French Canadian | 2,569 | 1.3% |
| German | 6,625 | 3.5% |
| Ghanaian | 84 | 0.0% |
| Greek | 593 | 0.3% |
| Guamanian / Chamorro | 43 | 0.0% |
| Guatemalan | 13,733 | 7.2% |
| Guyanese | 114 | 0.1% |
| Haitian | 2,569 | 1.3% |
| Honduran | 1,286 | 0.7% |
| Hungarian | 254 | 0.1% |
| Indian (Asian) | 3,143 | 1.7% |
| Indonesian | 145 | 0.1% |
| Iranian | 80 | 0.0% |
| Iraqi | 8 | 0.0% |
| Irish | 15,393 | 8.1% |
| Israeli | 16 | 0.0% |
| Italian | 13,482 | 7.1% |
| Jamaican | 618 | 0.3% |
| Japanese | 3,417 | 1.8% |
| Kenyan | 78 | 0.0% |
| Korean | 781 | 0.4% |
| Laotian | 58 | 0.0% |
| Latvian | 23 | 0.0% |
| Lebanese | 833 | 0.4% |
| Liberian | 2,178 | 1.1% |
| Lithuanian | 300 | 0.2% |
| Luxembourger | 19 | 0.0% |
| Malaysian | 1,045 | 0.5% |
| Menominee | 9 | 0.0% |
| Mexican | 2,427 | 1.3% |
| Mexican American Indian | 82 | 0.0% |
| Mongolian | 63 | 0.0% |
| Moroccan | 30 | 0.0% |
| Native Hawaiian | 102 | 0.1% |
| New Zealander | 3 | 0.0% |
| Nicaraguan | 91 | 0.1% |
| Nigerian | 2,303 | 1.2% |
| Northern European | 25 | 0.0% |
| Norwegian | 720 | 0.4% |
| Okinawan | 24 | 0.0% |
| Pakistani | 336 | 0.2% |
| Palestinian | 172 | 0.1% |
| Panamanian | 281 | 0.2% |
| Pennsylvania German | 22 | 0.0% |
| Peruvian | 289 | 0.2% |
| Polish | 2,811 | 1.5% |
| Portuguese | 4,107 | 2.2% |
| Pueblo | 22 | 0.0% |
| Puerto Rican | 13,642 | 7.2% |
| Romanian | 132 | 0.1% |
| Russian | 1,864 | 1.0% |
| Salvadoran | 961 | 0.5% |
| Samoan | 30 | 0.0% |
| Scandinavian | 132 | 0.1% |
| Scotch-Irish | 356 | 0.2% |
| Scottish | 1,695 | 0.9% |
| Serbian | 3 | 0.0% |
| Sioux | 38 | 0.0% |
| Slavic | 25 | 0.0% |
| Slovak | 186 | 0.1% |
| Slovene | 16 | 0.0% |
| South African | 15 | 0.0% |
| South American | 5,349 | 2.8% |
| South American Indian | 111 | 0.1% |
| Spaniard | 457 | 0.2% |
| Spanish | 392 | 0.2% |
| Spanish American Indian | 8 | 0.0% |
| Sri Lankan | 192 | 0.1% |
| Subsaharan African | 10,415 | 5.5% |
| Swedish | 1,133 | 0.6% |
| Swiss | 192 | 0.1% |
| Syrian | 305 | 0.2% |
| Thai | 2,361 | 1.2% |
| Trinidadian and Tobagonian | 57 | 0.0% |
| Turkish | 56 | 0.0% |
| Ukrainian | 477 | 0.3% |
| Uruguayan | 88 | 0.1% |
| Venezuelan | 336 | 0.2% |
| Vietnamese | 126 | 0.1% |
| Welsh | 532 | 0.3% |
| West Indian | 391 | 0.2% |
| Yugoslavian | 13 | 0.0% | View All 132 Rows |
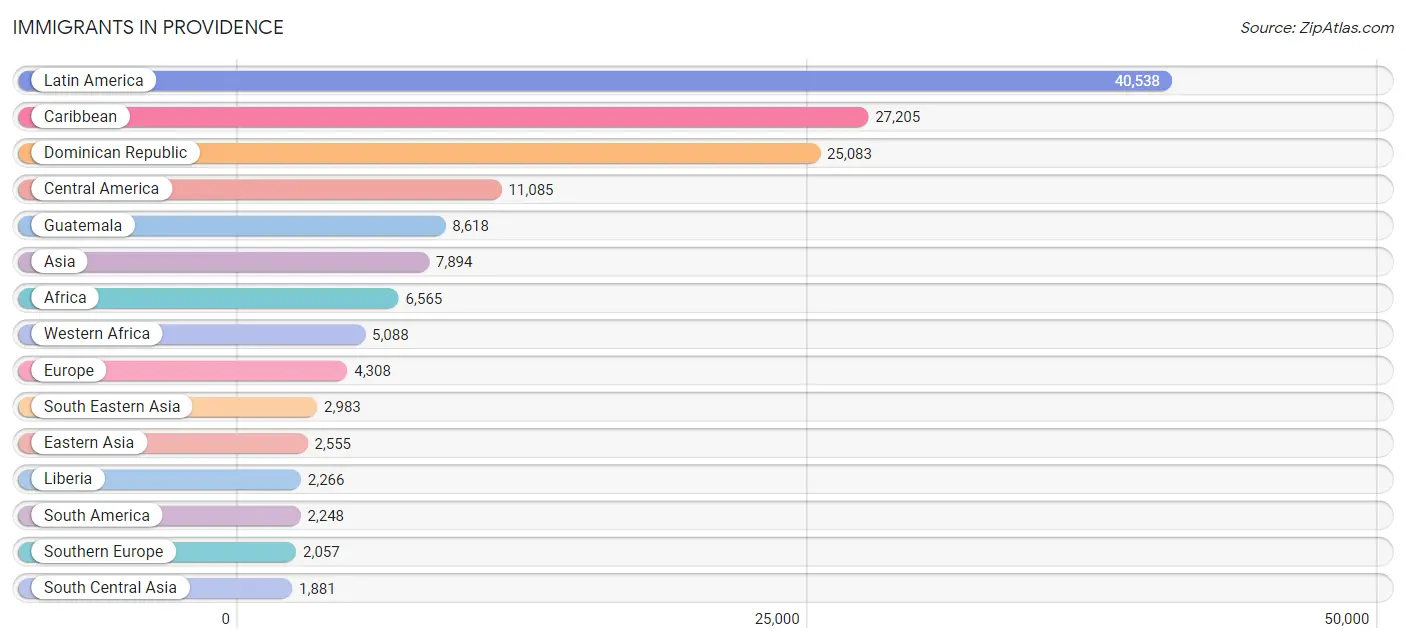
Immigrants in Providence
The most numerous immigrant groups reported in Providence came from Latin America (40,538 | 21.4%), Caribbean (27,205 | 14.3%), Dominican Republic (25,083 | 13.2%), Central America (11,085 | 5.8%), and Guatemala (8,618 | 4.5%), together accounting for 59.3% of all Providence residents.
| Immigration Origin | # Population | % Population |
| Africa | 6,565 | 3.5% |
| Albania | 94 | 0.1% |
| Argentina | 4 | 0.0% |
| Armenia | 9 | 0.0% |
| Asia | 7,894 | 4.2% |
| Australia | 21 | 0.0% |
| Azores | 128 | 0.1% |
| Bangladesh | 4 | 0.0% |
| Barbados | 51 | 0.0% |
| Belarus | 27 | 0.0% |
| Belgium | 18 | 0.0% |
| Bolivia | 306 | 0.2% |
| Bosnia and Herzegovina | 25 | 0.0% |
| Brazil | 90 | 0.1% |
| Cabo Verde | 911 | 0.5% |
| Cambodia | 1,001 | 0.5% |
| Canada | 660 | 0.4% |
| Caribbean | 27,205 | 14.3% |
| Central America | 11,085 | 5.8% |
| Chile | 78 | 0.0% |
| China | 1,846 | 1.0% |
| Colombia | 992 | 0.5% |
| Cuba | 53 | 0.0% |
| Czechoslovakia | 45 | 0.0% |
| Denmark | 76 | 0.0% |
| Dominica | 36 | 0.0% |
| Dominican Republic | 25,083 | 13.2% |
| Eastern Africa | 469 | 0.3% |
| Eastern Asia | 2,555 | 1.3% |
| Eastern Europe | 709 | 0.4% |
| Ecuador | 409 | 0.2% |
| Egypt | 45 | 0.0% |
| El Salvador | 722 | 0.4% |
| England | 142 | 0.1% |
| Eritrea | 39 | 0.0% |
| Europe | 4,308 | 2.3% |
| France | 251 | 0.1% |
| Germany | 381 | 0.2% |
| Ghana | 192 | 0.1% |
| Greece | 76 | 0.0% |
| Guatemala | 8,618 | 4.5% |
| Guyana | 17 | 0.0% |
| Haiti | 1,409 | 0.7% |
| Honduras | 866 | 0.5% |
| Hong Kong | 236 | 0.1% |
| Hungary | 55 | 0.0% |
| India | 1,443 | 0.8% |
| Indonesia | 54 | 0.0% |
| Iran | 103 | 0.1% |
| Iraq | 8 | 0.0% |
| Ireland | 146 | 0.1% |
| Israel | 127 | 0.1% |
| Italy | 637 | 0.3% |
| Jamaica | 370 | 0.2% |
| Japan | 108 | 0.1% |
| Kazakhstan | 48 | 0.0% |
| Kenya | 117 | 0.1% |
| Korea | 601 | 0.3% |
| Laos | 671 | 0.4% |
| Latin America | 40,538 | 21.4% |
| Lebanon | 120 | 0.1% |
| Liberia | 2,266 | 1.2% |
| Malaysia | 72 | 0.0% |
| Mexico | 716 | 0.4% |
| Middle Africa | 44 | 0.0% |
| Morocco | 125 | 0.1% |
| Nepal | 76 | 0.0% |
| Netherlands | 41 | 0.0% |
| Nicaragua | 32 | 0.0% |
| Nigeria | 1,481 | 0.8% |
| Northern Africa | 179 | 0.1% |
| Northern Europe | 775 | 0.4% |
| Norway | 11 | 0.0% |
| Oceania | 21 | 0.0% |
| Pakistan | 197 | 0.1% |
| Panama | 131 | 0.1% |
| Peru | 83 | 0.0% |
| Philippines | 230 | 0.1% |
| Poland | 25 | 0.0% |
| Portugal | 1,084 | 0.6% |
| Romania | 96 | 0.1% |
| Russia | 61 | 0.0% |
| Saudi Arabia | 33 | 0.0% |
| Scotland | 37 | 0.0% |
| Senegal | 24 | 0.0% |
| Serbia | 3 | 0.0% |
| Singapore | 166 | 0.1% |
| South America | 2,248 | 1.2% |
| South Central Asia | 1,881 | 1.0% |
| South Eastern Asia | 2,983 | 1.6% |
| Southern Europe | 2,057 | 1.1% |
| Spain | 260 | 0.1% |
| Sweden | 68 | 0.0% |
| Switzerland | 76 | 0.0% |
| Syria | 132 | 0.1% |
| Taiwan | 127 | 0.1% |
| Thailand | 511 | 0.3% |
| Trinidad and Tobago | 198 | 0.1% |
| Turkey | 9 | 0.0% |
| Ukraine | 254 | 0.1% |
| Uruguay | 12 | 0.0% |
| Uzbekistan | 10 | 0.0% |
| Venezuela | 183 | 0.1% |
| Vietnam | 161 | 0.1% |
| West Indies | 5 | 0.0% |
| Western Africa | 5,088 | 2.7% |
| Western Asia | 464 | 0.2% |
| Western Europe | 767 | 0.4% |
| Zaire | 44 | 0.0% | View All 109 Rows |
Sex and Age in Providence
Sex and Age in Providence
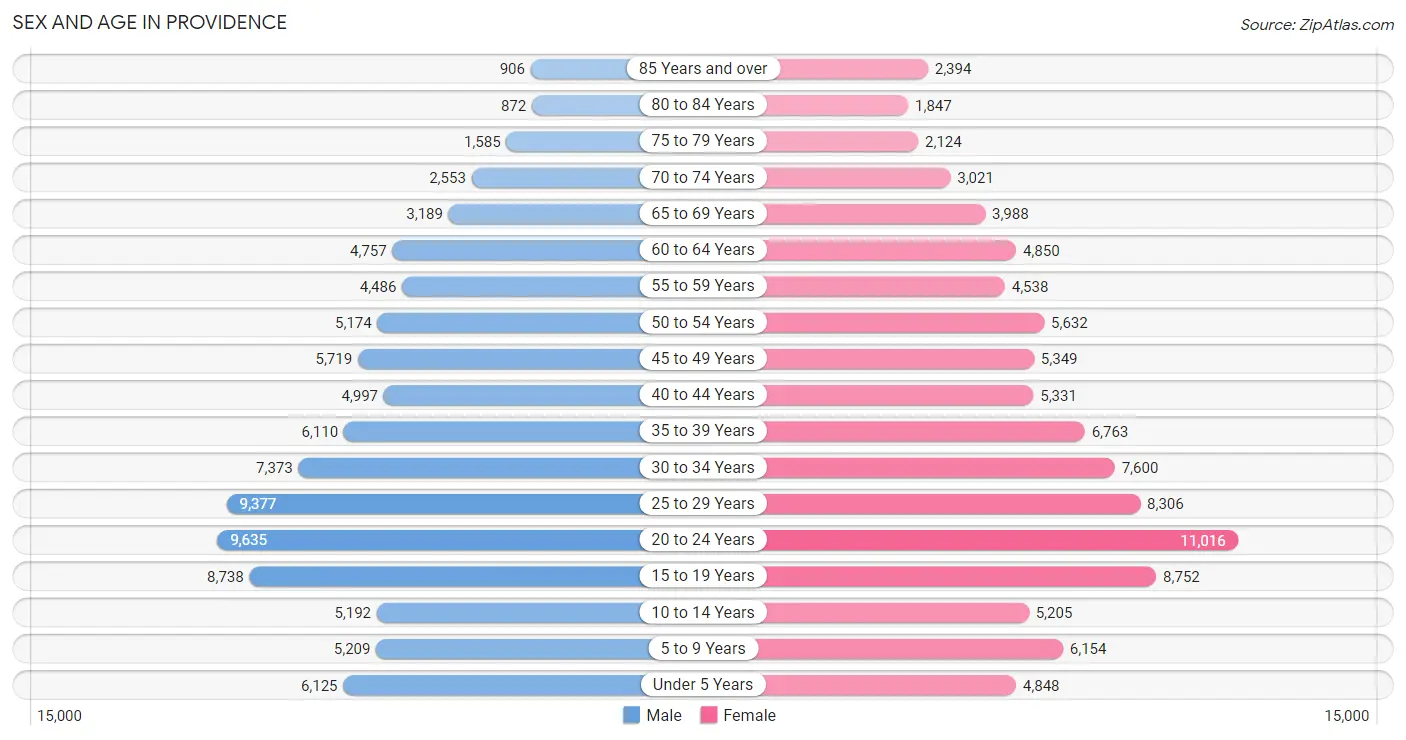
The most populous age groups in Providence are 20 to 24 Years (9,635 | 10.5%) for men and 20 to 24 Years (11,016 | 11.3%) for women.
| Age Bracket | Male | Female |
| Under 5 Years | 6,125 (6.7%) | 4,848 (5.0%) |
| 5 to 9 Years | 5,209 (5.7%) | 6,154 (6.3%) |
| 10 to 14 Years | 5,192 (5.6%) | 5,205 (5.3%) |
| 15 to 19 Years | 8,738 (9.5%) | 8,752 (9.0%) |
| 20 to 24 Years | 9,635 (10.5%) | 11,016 (11.3%) |
| 25 to 29 Years | 9,377 (10.2%) | 8,306 (8.5%) |
| 30 to 34 Years | 7,373 (8.0%) | 7,600 (7.8%) |
| 35 to 39 Years | 6,110 (6.6%) | 6,763 (6.9%) |
| 40 to 44 Years | 4,997 (5.4%) | 5,331 (5.5%) |
| 45 to 49 Years | 5,719 (6.2%) | 5,349 (5.5%) |
| 50 to 54 Years | 5,174 (5.6%) | 5,632 (5.8%) |
| 55 to 59 Years | 4,486 (4.9%) | 4,538 (4.6%) |
| 60 to 64 Years | 4,757 (5.2%) | 4,850 (5.0%) |
| 65 to 69 Years | 3,189 (3.5%) | 3,988 (4.1%) |
| 70 to 74 Years | 2,553 (2.8%) | 3,021 (3.1%) |
| 75 to 79 Years | 1,585 (1.7%) | 2,124 (2.2%) |
| 80 to 84 Years | 872 (0.9%) | 1,847 (1.9%) |
| 85 Years and over | 906 (1.0%) | 2,394 (2.5%) |
| Total | 91,997 (100.0%) | 97,718 (100.0%) |
Families and Households in Providence
Median Family Size in Providence
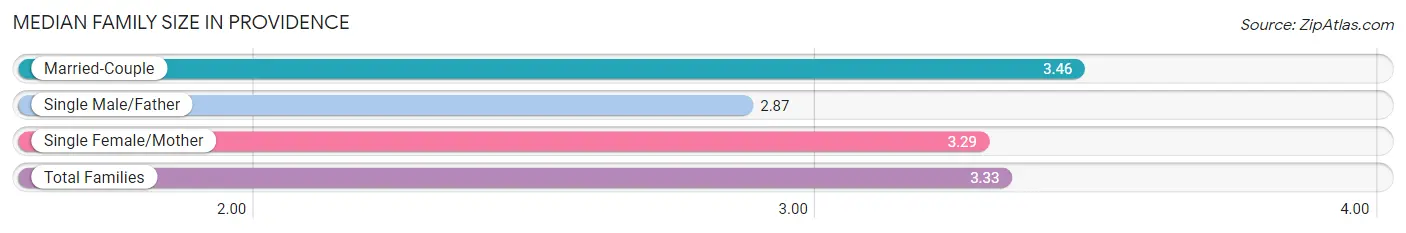
The median family size in Providence is 3.33 persons per family, with married-couple families (20,749 | 55.3%) accounting for the largest median family size of 3.46 persons per family. On the other hand, single male/father families (4,698 | 12.5%) represent the smallest median family size with 2.87 persons per family.
| Family Type | # Families | Family Size |
| Married-Couple | 20,749 (55.3%) | 3.46 |
| Single Male/Father | 4,698 (12.5%) | 2.87 |
| Single Female/Mother | 12,056 (32.2%) | 3.29 |
| Total Families | 37,503 (100.0%) | 3.33 |
Median Household Size in Providence
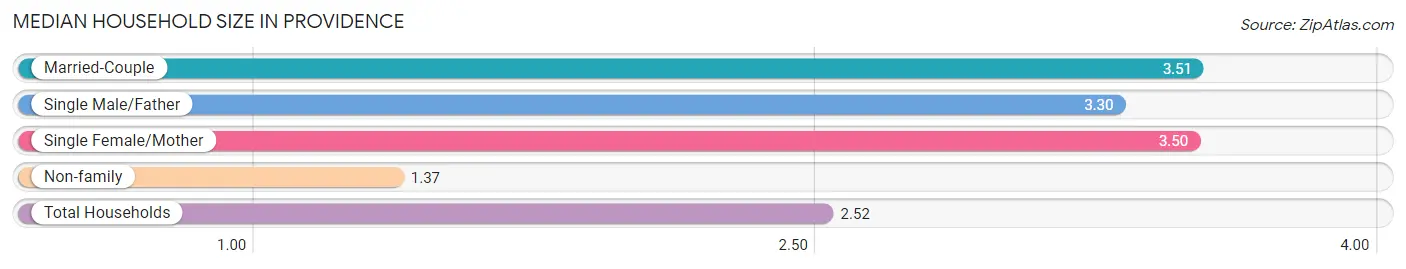
The median household size in Providence is 2.52 persons per household, with married-couple households (20,749 | 30.0%) accounting for the largest median household size of 3.51 persons per household. non-family households (31,607 | 45.7%) represent the smallest median household size with 1.37 persons per household.
| Household Type | # Households | Household Size |
| Married-Couple | 20,749 (30.0%) | 3.51 |
| Single Male/Father | 4,698 (6.8%) | 3.30 |
| Single Female/Mother | 12,056 (17.4%) | 3.50 |
| Non-family | 31,607 (45.7%) | 1.37 |
| Total Households | 69,110 (100.0%) | 2.52 |
Household Size by Marriage Status in Providence
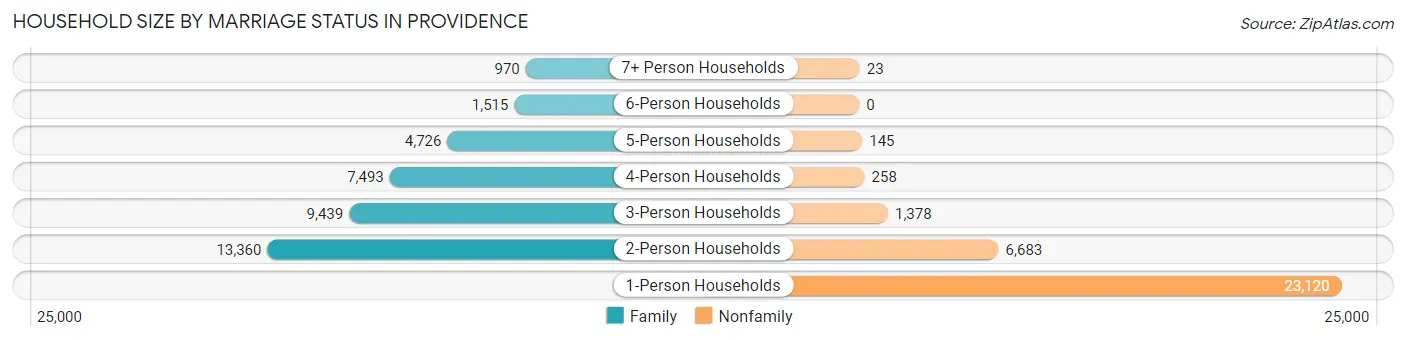
Out of a total of 69,110 households in Providence, 37,503 (54.3%) are family households, while 31,607 (45.7%) are nonfamily households. The most numerous type of family households are 2-person households, comprising 13,360, and the most common type of nonfamily households are 1-person households, comprising 23,120.
| Household Size | Family Households | Nonfamily Households |
| 1-Person Households | - | 23,120 (33.5%) |
| 2-Person Households | 13,360 (19.3%) | 6,683 (9.7%) |
| 3-Person Households | 9,439 (13.7%) | 1,378 (2.0%) |
| 4-Person Households | 7,493 (10.8%) | 258 (0.4%) |
| 5-Person Households | 4,726 (6.8%) | 145 (0.2%) |
| 6-Person Households | 1,515 (2.2%) | 0 (0.0%) |
| 7+ Person Households | 970 (1.4%) | 23 (0.0%) |
| Total | 37,503 (54.3%) | 31,607 (45.7%) |
Female Fertility in Providence
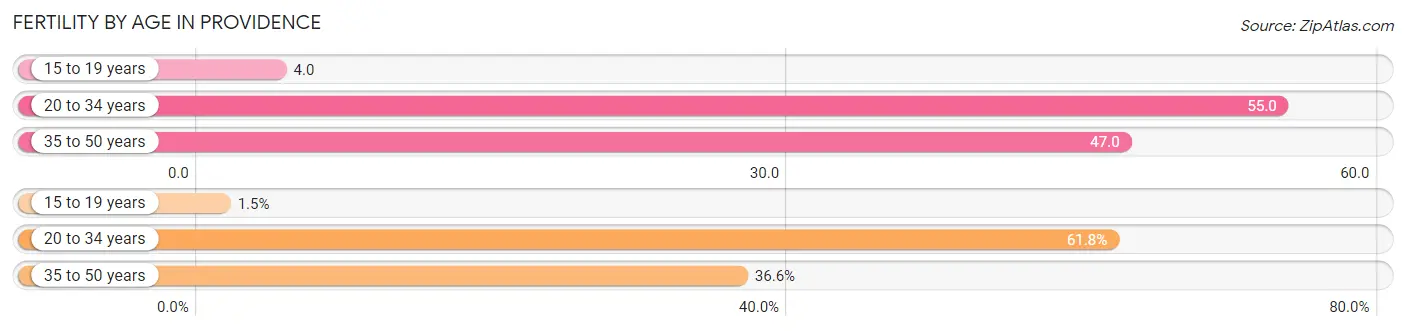
Fertility by Age in Providence
Average fertility rate in Providence is 44.0 births per 1,000 women. Women in the age bracket of 20 to 34 years have the highest fertility rate with 55.0 births per 1,000 women. Women in the age bracket of 20 to 34 years acount for 61.8% of all women with births.
| Age Bracket | Women with Births | Births / 1,000 Women |
| 15 to 19 years | 37 (1.5%) | 4.0 |
| 20 to 34 years | 1,485 (61.8%) | 55.0 |
| 35 to 50 years | 880 (36.6%) | 47.0 |
| Total | 2,402 (100.0%) | 44.0 |
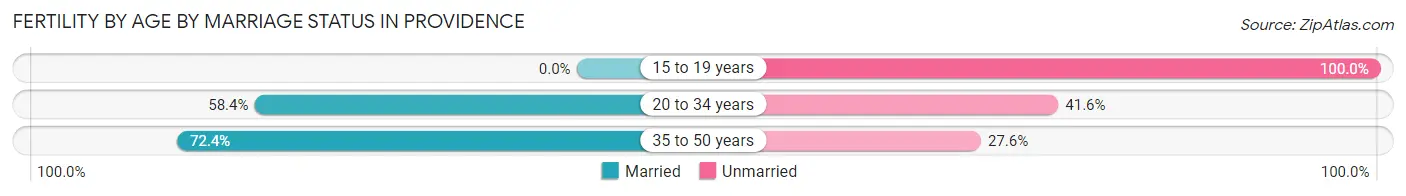
Fertility by Age by Marriage Status in Providence
62.6% of women with births (2,402) in Providence are married. The highest percentage of unmarried women with births falls into 15 to 19 years age bracket with 100.0% of them unmarried at the time of birth, while the lowest percentage of unmarried women with births belong to 35 to 50 years age bracket with 27.6% of them unmarried.
| Age Bracket | Married | Unmarried |
| 15 to 19 years | 0 (0.0%) | 37 (100.0%) |
| 20 to 34 years | 867 (58.4%) | 618 (41.6%) |
| 35 to 50 years | 637 (72.4%) | 243 (27.6%) |
| Total | 1,504 (62.6%) | 898 (37.4%) |
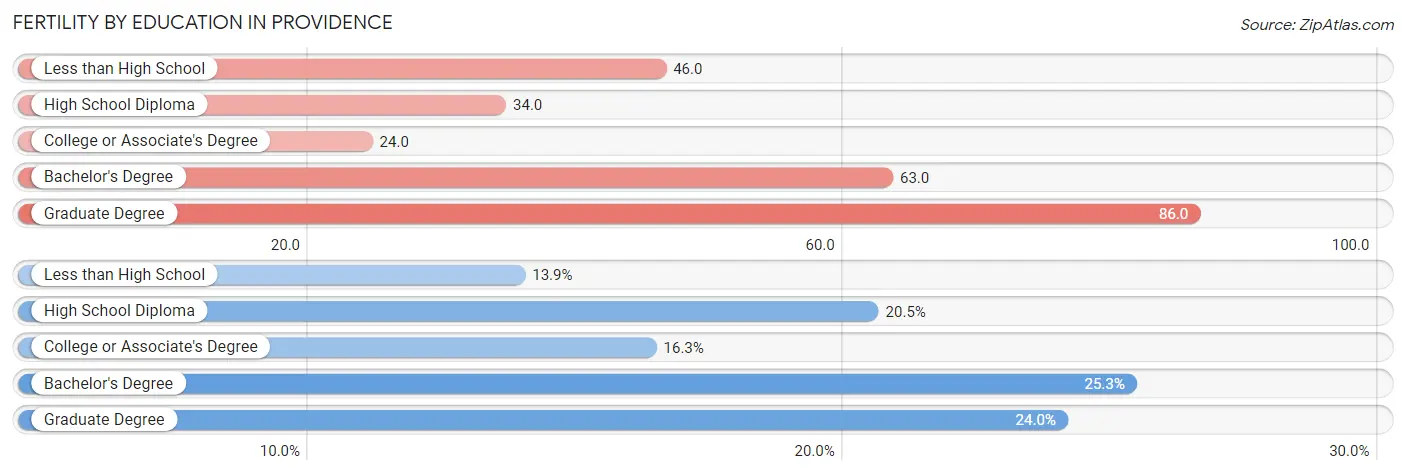
Fertility by Education in Providence
Average fertility rate in Providence is 44.0 births per 1,000 women. Women with the education attainment of graduate degree have the highest fertility rate of 86.0 births per 1,000 women, while women with the education attainment of college or associate's degree have the lowest fertility at 24.0 births per 1,000 women. Women with the education attainment of bachelor's degree represent 25.3% of all women with births.
| Educational Attainment | Women with Births | Births / 1,000 Women |
| Less than High School | 333 (13.9%) | 46.0 |
| High School Diploma | 492 (20.5%) | 34.0 |
| College or Associate's Degree | 392 (16.3%) | 24.0 |
| Bachelor's Degree | 608 (25.3%) | 63.0 |
| Graduate Degree | 577 (24.0%) | 86.0 |
| Total | 2,402 (100.0%) | 44.0 |
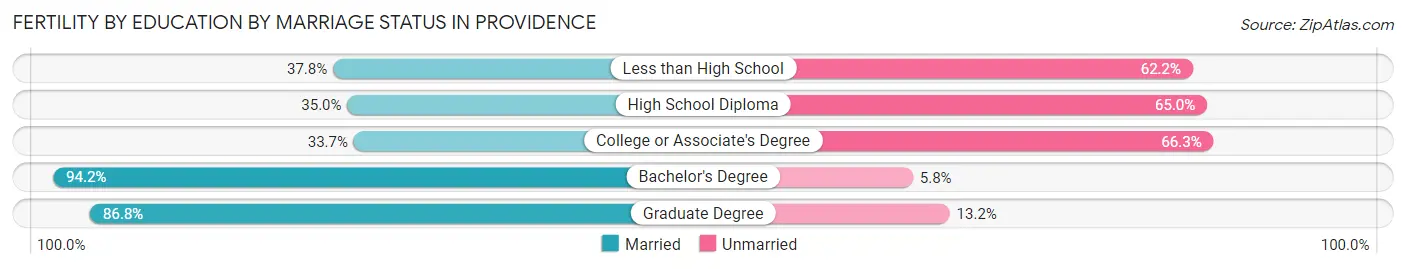
Fertility by Education by Marriage Status in Providence
37.4% of women with births in Providence are unmarried. Women with the educational attainment of bachelor's degree are most likely to be married with 94.2% of them married at childbirth, while women with the educational attainment of college or associate's degree are least likely to be married with 66.3% of them unmarried at childbirth.
| Educational Attainment | Married | Unmarried |
| Less than High School | 126 (37.8%) | 207 (62.2%) |
| High School Diploma | 172 (35.0%) | 320 (65.0%) |
| College or Associate's Degree | 132 (33.7%) | 260 (66.3%) |
| Bachelor's Degree | 573 (94.2%) | 35 (5.8%) |
| Graduate Degree | 501 (86.8%) | 76 (13.2%) |
| Total | 1,504 (62.6%) | 898 (37.4%) |
Income in Providence
Income Overview in Providence
Per Capita Income in Providence is $34,521, while median incomes of families and households are $71,737 and $61,365 respectively.
| Characteristic | Number | Measure |
| Per Capita Income | 189,715 | $34,521 |
| Median Family Income | 37,503 | $71,737 |
| Mean Family Income | 37,503 | $105,793 |
| Median Household Income | 69,110 | $61,365 |
| Mean Household Income | 69,110 | $89,499 |
| Income Deficit | 37,503 | $11,534 |
| Wage / Income Gap (%) | 189,715 | 22.44% |
| Wage / Income Gap ($) | 189,715 | 77.56¢ per $1 |
| Gini / Inequality Index | 189,715 | 0.51 |
Earnings by Sex in Providence
Average Earnings in Providence are $35,402, $40,035 for men and $31,052 for women, a difference of 22.4%.
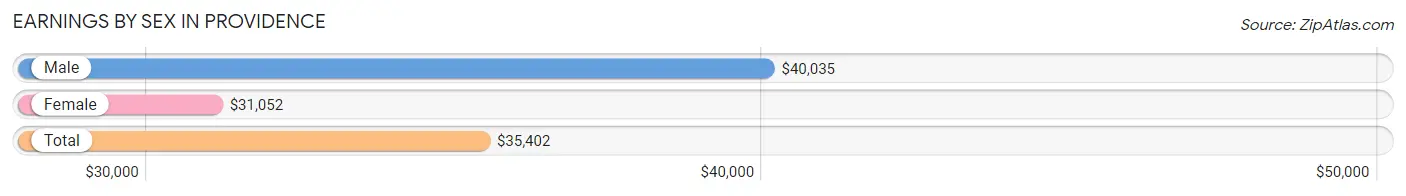
| Sex | Number | Average Earnings |
| Male | 53,237 (50.8%) | $40,035 |
| Female | 51,608 (49.2%) | $31,052 |
| Total | 104,845 (100.0%) | $35,402 |
Earnings by Sex by Income Bracket in Providence
The most common earnings brackets in Providence are $100,000+ for men (6,653 | 12.5%) and $100,000+ for women (4,399 | 8.5%).
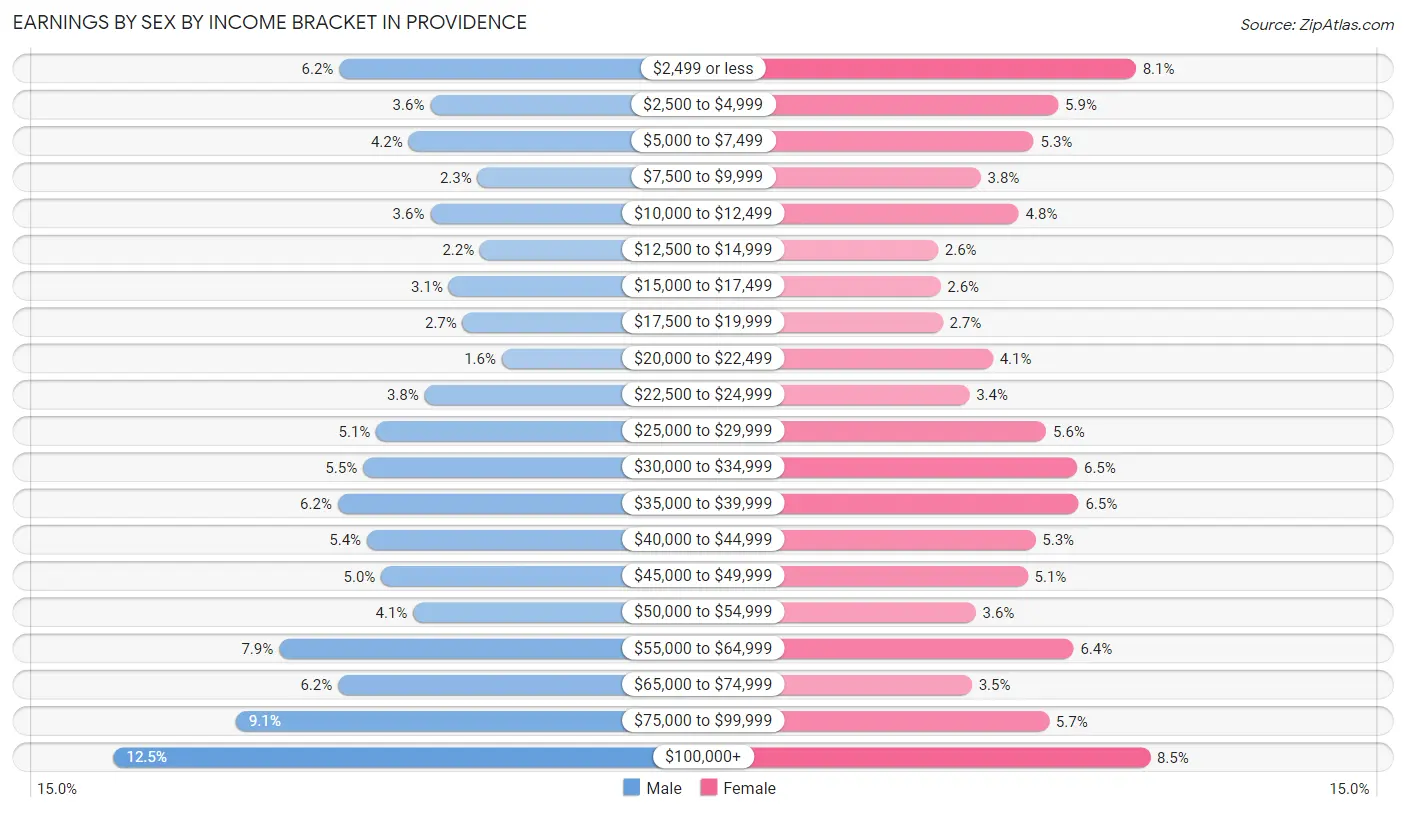
| Income | Male | Female |
| $2,499 or less | 3,277 (6.2%) | 4,193 (8.1%) |
| $2,500 to $4,999 | 1,914 (3.6%) | 3,063 (5.9%) |
| $5,000 to $7,499 | 2,242 (4.2%) | 2,711 (5.2%) |
| $7,500 to $9,999 | 1,208 (2.3%) | 1,943 (3.8%) |
| $10,000 to $12,499 | 1,916 (3.6%) | 2,491 (4.8%) |
| $12,500 to $14,999 | 1,172 (2.2%) | 1,322 (2.6%) |
| $15,000 to $17,499 | 1,640 (3.1%) | 1,359 (2.6%) |
| $17,500 to $19,999 | 1,431 (2.7%) | 1,390 (2.7%) |
| $20,000 to $22,499 | 848 (1.6%) | 2,115 (4.1%) |
| $22,500 to $24,999 | 2,002 (3.8%) | 1,776 (3.4%) |
| $25,000 to $29,999 | 2,726 (5.1%) | 2,889 (5.6%) |
| $30,000 to $34,999 | 2,922 (5.5%) | 3,341 (6.5%) |
| $35,000 to $39,999 | 3,300 (6.2%) | 3,360 (6.5%) |
| $40,000 to $44,999 | 2,864 (5.4%) | 2,736 (5.3%) |
| $45,000 to $49,999 | 2,649 (5.0%) | 2,622 (5.1%) |
| $50,000 to $54,999 | 2,174 (4.1%) | 1,866 (3.6%) |
| $55,000 to $64,999 | 4,180 (7.9%) | 3,290 (6.4%) |
| $65,000 to $74,999 | 3,295 (6.2%) | 1,813 (3.5%) |
| $75,000 to $99,999 | 4,824 (9.1%) | 2,929 (5.7%) |
| $100,000+ | 6,653 (12.5%) | 4,399 (8.5%) |
| Total | 53,237 (100.0%) | 51,608 (100.0%) |
Earnings by Sex by Educational Attainment in Providence
Average earnings in Providence are $47,516 for men and $40,144 for women, a difference of 15.5%. Men with an educational attainment of graduate degree enjoy the highest average annual earnings of $78,404, while those with less than high school education earn the least with $35,680. Women with an educational attainment of graduate degree earn the most with the average annual earnings of $75,117, while those with less than high school education have the smallest earnings of $27,825.
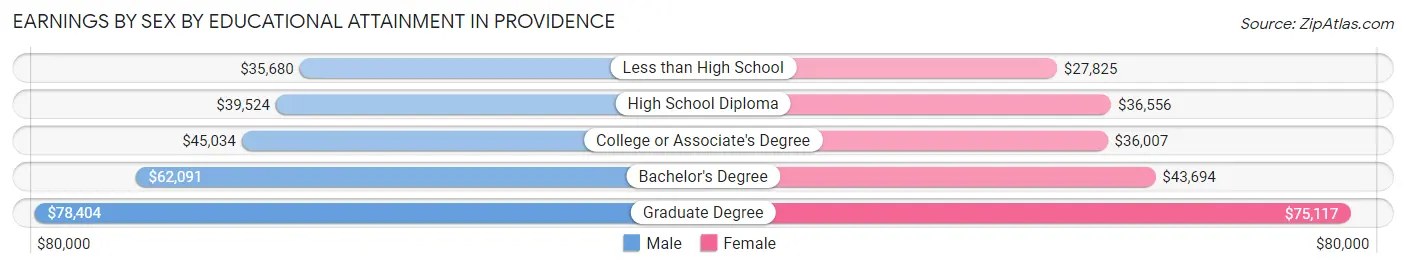
| Educational Attainment | Male Income | Female Income |
| Less than High School | $35,680 | $27,825 |
| High School Diploma | $39,524 | $36,556 |
| College or Associate's Degree | $45,034 | $36,007 |
| Bachelor's Degree | $62,091 | $43,694 |
| Graduate Degree | $78,404 | $75,117 |
| Total | $47,516 | $40,144 |
Family Income in Providence
Family Income Brackets in Providence
According to the Providence family income data, there are 6,601 families falling into the $50,000 to $74,999 income range, which is the most common income bracket and makes up 17.6% of all families. Conversely, the $10,000 to $14,999 income bracket is the least frequent group with only 1,538 families (4.1%) belonging to this category.
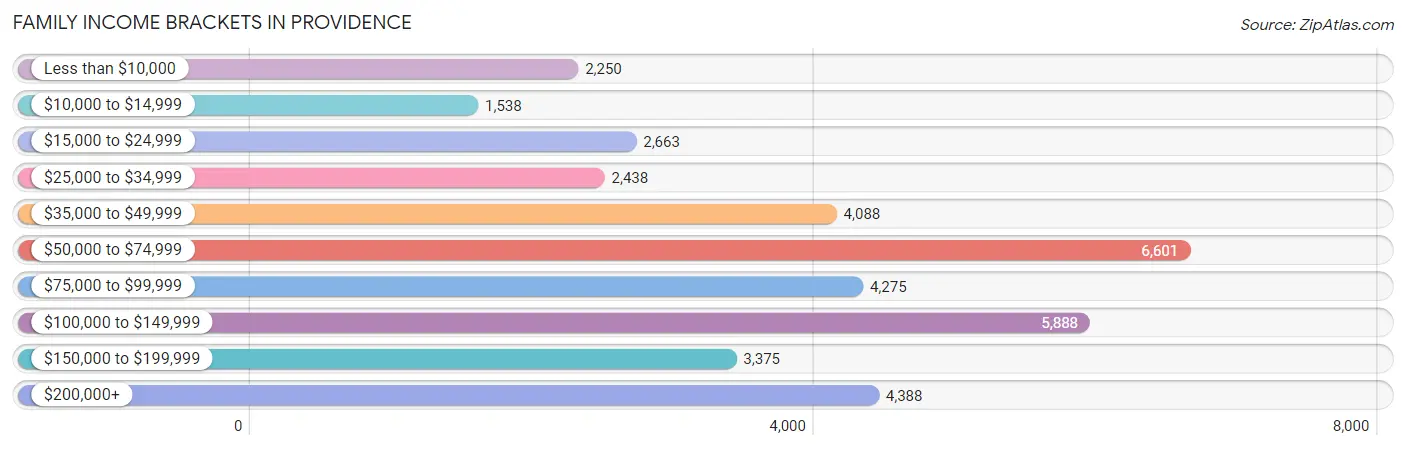
| Income Bracket | # Families | % Families |
| Less than $10,000 | 2,250 | 6.0% |
| $10,000 to $14,999 | 1,538 | 4.1% |
| $15,000 to $24,999 | 2,663 | 7.1% |
| $25,000 to $34,999 | 2,438 | 6.5% |
| $35,000 to $49,999 | 4,088 | 10.9% |
| $50,000 to $74,999 | 6,601 | 17.6% |
| $75,000 to $99,999 | 4,275 | 11.4% |
| $100,000 to $149,999 | 5,888 | 15.7% |
| $150,000 to $199,999 | 3,375 | 9.0% |
| $200,000+ | 4,388 | 11.7% |
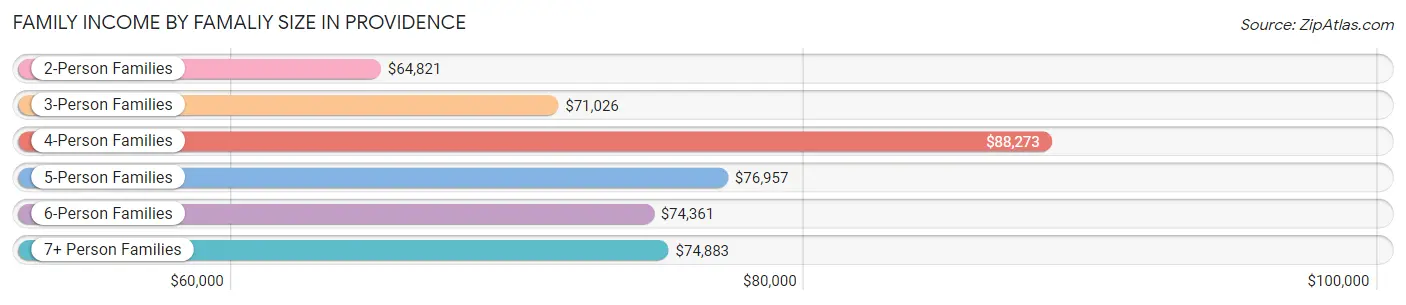
Family Income by Famaliy Size in Providence
4-person families (7,362 | 19.6%) account for the highest median family income in Providence with $88,273 per family, while 2-person families (15,087 | 40.2%) have the highest median income of $32,410 per family member.
| Income Bracket | # Families | Median Income |
| 2-Person Families | 15,087 (40.2%) | $64,821 |
| 3-Person Families | 9,108 (24.3%) | $71,026 |
| 4-Person Families | 7,362 (19.6%) | $88,273 |
| 5-Person Families | 4,202 (11.2%) | $76,957 |
| 6-Person Families | 1,223 (3.3%) | $74,361 |
| 7+ Person Families | 521 (1.4%) | $74,883 |
| Total | 37,503 (100.0%) | $71,737 |
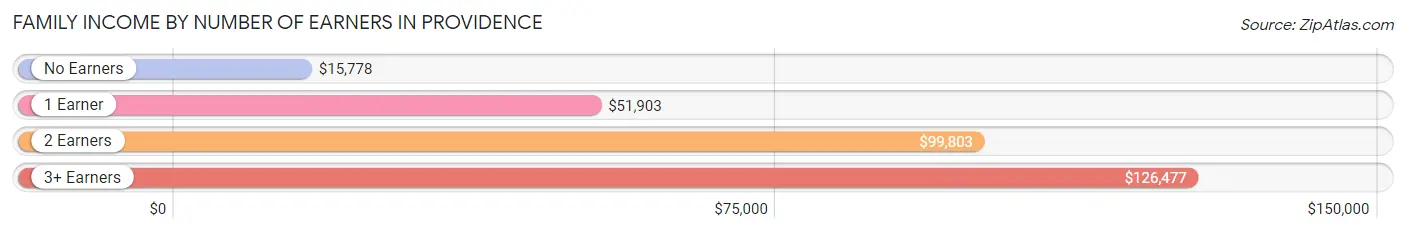
Family Income by Number of Earners in Providence
The median family income in Providence is $71,737, with families comprising 3+ earners (4,641) having the highest median family income of $126,477, while families with no earners (4,605) have the lowest median family income of $15,778, accounting for 12.4% and 12.3% of families, respectively.
| Number of Earners | # Families | Median Income |
| No Earners | 4,605 (12.3%) | $15,778 |
| 1 Earner | 13,919 (37.1%) | $51,903 |
| 2 Earners | 14,338 (38.2%) | $99,803 |
| 3+ Earners | 4,641 (12.4%) | $126,477 |
| Total | 37,503 (100.0%) | $71,737 |
Household Income in Providence
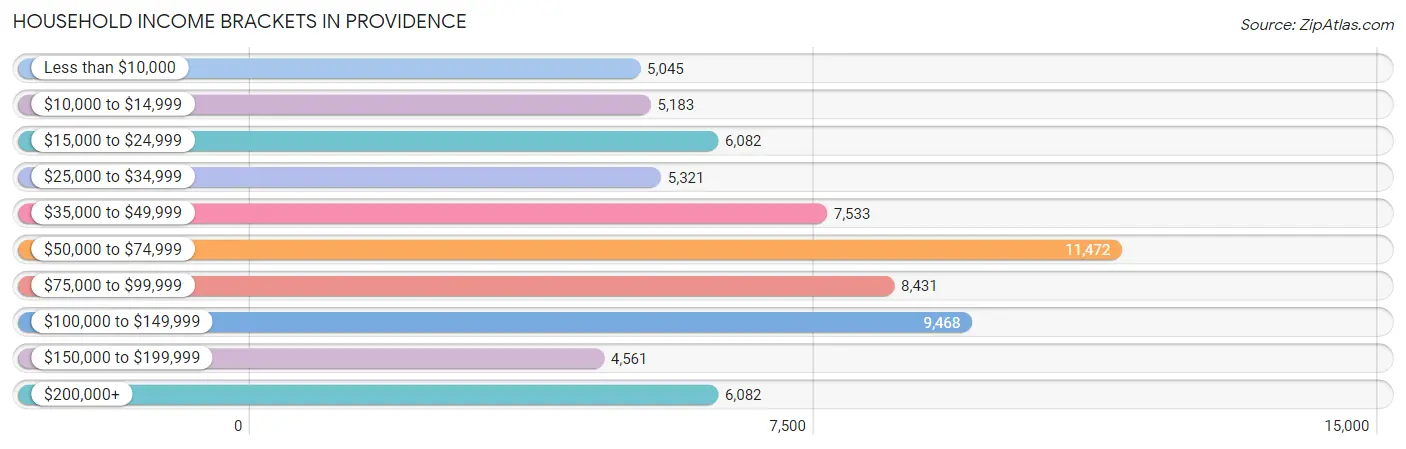
Household Income Brackets in Providence
With 11,472 households falling in the category, the $50,000 to $74,999 income range is the most frequent in Providence, accounting for 16.6% of all households. In contrast, only 4,561 households (6.6%) fall into the $150,000 to $199,999 income bracket, making it the least populous group.
| Income Bracket | # Households | % Households |
| Less than $10,000 | 5,045 | 7.3% |
| $10,000 to $14,999 | 5,183 | 7.5% |
| $15,000 to $24,999 | 6,082 | 8.8% |
| $25,000 to $34,999 | 5,321 | 7.7% |
| $35,000 to $49,999 | 7,533 | 10.9% |
| $50,000 to $74,999 | 11,472 | 16.6% |
| $75,000 to $99,999 | 8,431 | 12.2% |
| $100,000 to $149,999 | 9,468 | 13.7% |
| $150,000 to $199,999 | 4,561 | 6.6% |
| $200,000+ | 6,082 | 8.8% |
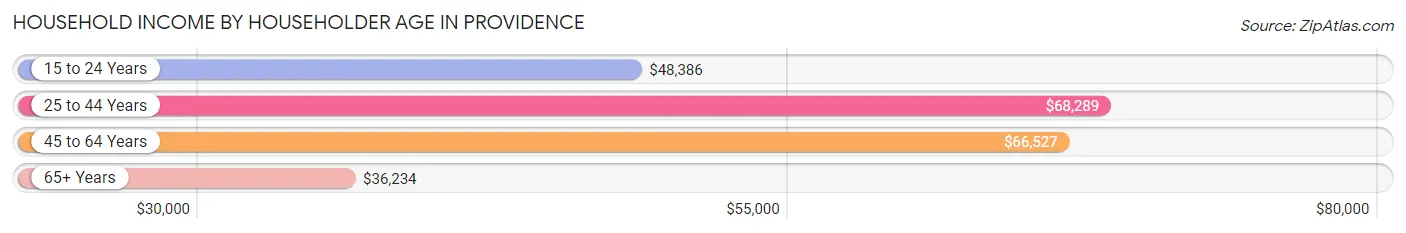
Household Income by Householder Age in Providence
The median household income in Providence is $61,365, with the highest median household income of $68,289 found in the 25 to 44 years age bracket for the primary householder. A total of 27,900 households (40.4%) fall into this category. Meanwhile, the 65+ years age bracket for the primary householder has the lowest median household income of $36,234, with 13,861 households (20.1%) in this group.
| Income Bracket | # Households | Median Income |
| 15 to 24 Years | 3,293 (4.8%) | $48,386 |
| 25 to 44 Years | 27,900 (40.4%) | $68,289 |
| 45 to 64 Years | 24,056 (34.8%) | $66,527 |
| 65+ Years | 13,861 (20.1%) | $36,234 |
| Total | 69,110 (100.0%) | $61,365 |
Poverty in Providence
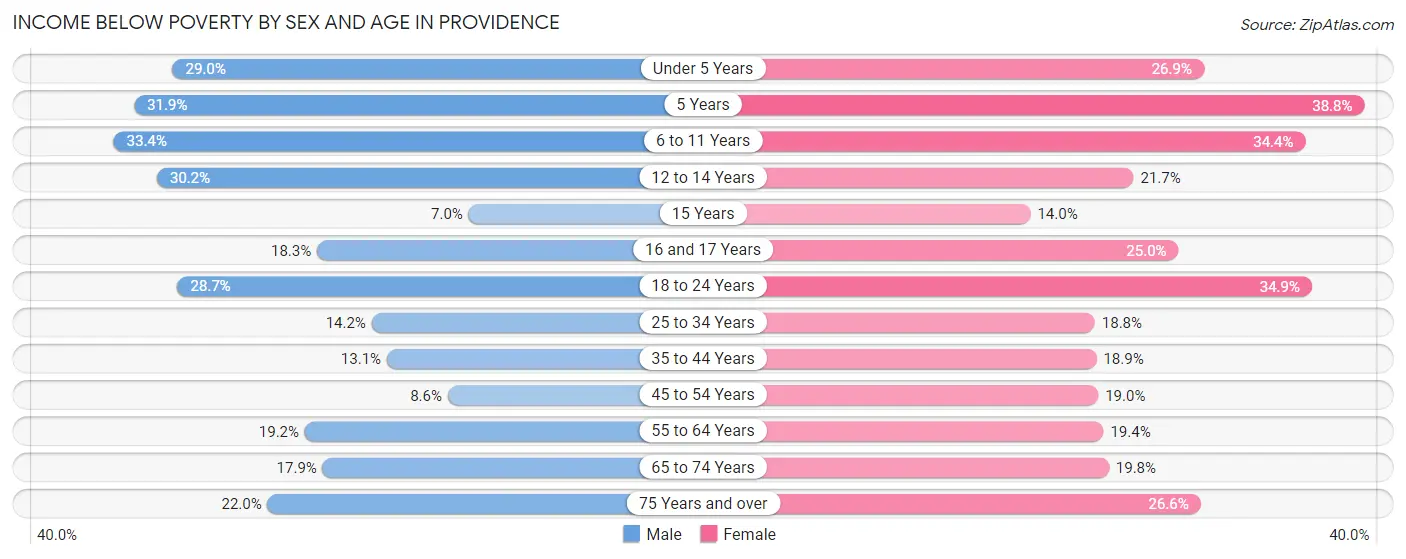
Income Below Poverty by Sex and Age in Providence
With 19.1% poverty level for males and 23.4% for females among the residents of Providence, 6 to 11 year old males and 5 year old females are the most vulnerable to poverty, with 1,803 males (33.4%) and 441 females (38.8%) in their respective age groups living below the poverty level.
| Age Bracket | Male | Female |
| Under 5 Years | 1,763 (29.0%) | 1,259 (26.9%) |
| 5 Years | 378 (31.9%) | 441 (38.8%) |
| 6 to 11 Years | 1,803 (33.4%) | 2,309 (34.4%) |
| 12 to 14 Years | 982 (30.2%) | 711 (21.7%) |
| 15 Years | 76 (7.0%) | 117 (14.0%) |
| 16 and 17 Years | 472 (18.3%) | 467 (25.0%) |
| 18 to 24 Years | 2,615 (28.6%) | 3,681 (34.9%) |
| 25 to 34 Years | 2,376 (14.2%) | 2,985 (18.8%) |
| 35 to 44 Years | 1,453 (13.1%) | 2,287 (18.9%) |
| 45 to 54 Years | 930 (8.6%) | 2,069 (19.0%) |
| 55 to 64 Years | 1,738 (19.2%) | 1,785 (19.4%) |
| 65 to 74 Years | 983 (17.9%) | 1,328 (19.8%) |
| 75 Years and over | 673 (22.0%) | 1,453 (26.6%) |
| Total | 16,242 (19.1%) | 20,892 (23.4%) |
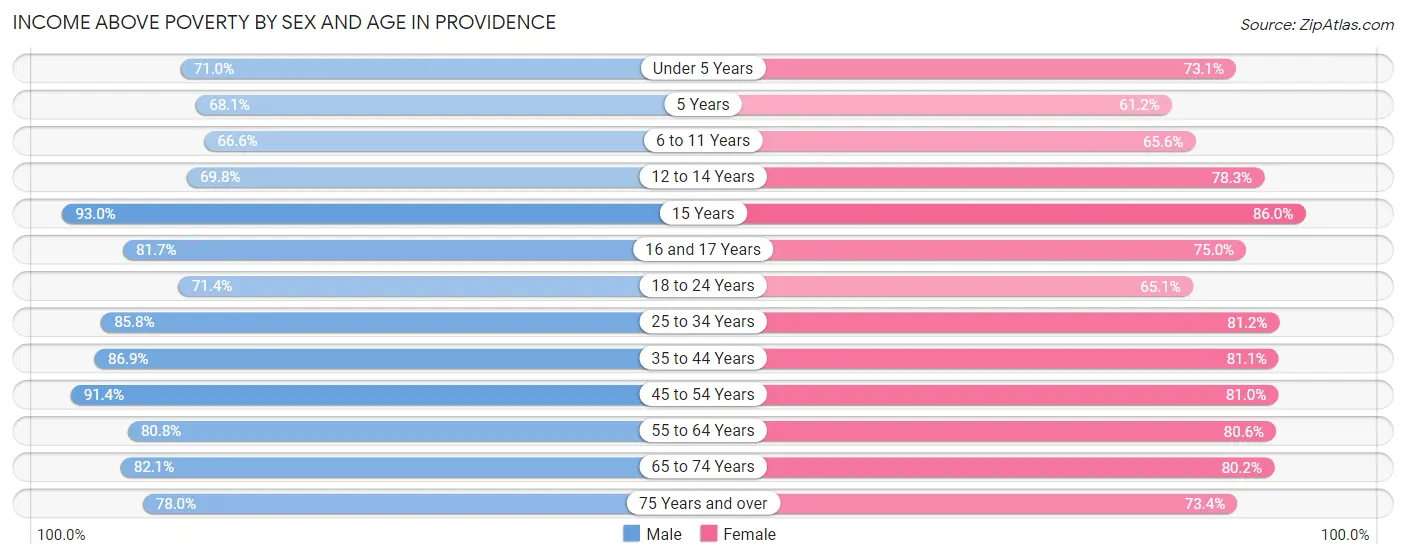
Income Above Poverty by Sex and Age in Providence
According to the poverty statistics in Providence, males aged 15 years and females aged 15 years are the age groups that are most secure financially, with 93.0% of males and 86.0% of females in these age groups living above the poverty line.
| Age Bracket | Male | Female |
| Under 5 Years | 4,314 (71.0%) | 3,427 (73.1%) |
| 5 Years | 808 (68.1%) | 696 (61.2%) |
| 6 to 11 Years | 3,597 (66.6%) | 4,401 (65.6%) |
| 12 to 14 Years | 2,272 (69.8%) | 2,571 (78.3%) |
| 15 Years | 1,005 (93.0%) | 718 (86.0%) |
| 16 and 17 Years | 2,109 (81.7%) | 1,402 (75.0%) |
| 18 to 24 Years | 6,511 (71.4%) | 6,870 (65.1%) |
| 25 to 34 Years | 14,321 (85.8%) | 12,901 (81.2%) |
| 35 to 44 Years | 9,638 (86.9%) | 9,805 (81.1%) |
| 45 to 54 Years | 9,911 (91.4%) | 8,795 (81.0%) |
| 55 to 64 Years | 7,319 (80.8%) | 7,402 (80.6%) |
| 65 to 74 Years | 4,518 (82.1%) | 5,368 (80.2%) |
| 75 Years and over | 2,391 (78.0%) | 4,001 (73.4%) |
| Total | 68,714 (80.9%) | 68,357 (76.6%) |
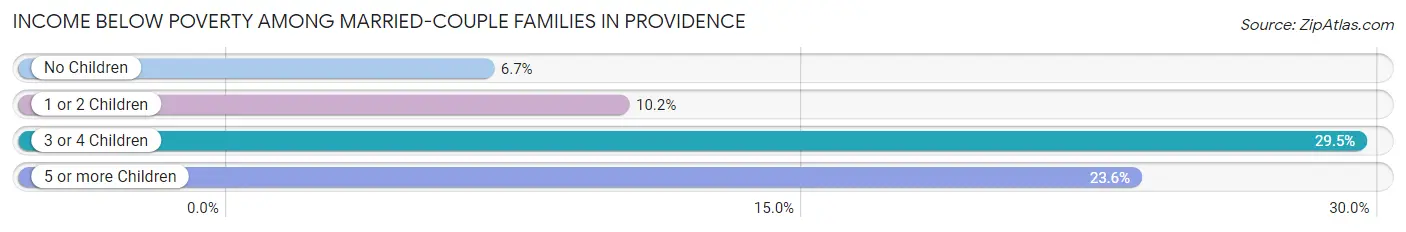
Income Below Poverty Among Married-Couple Families in Providence
The poverty statistics for married-couple families in Providence show that 9.9% or 2,046 of the total 20,749 families live below the poverty line. Families with 3 or 4 children have the highest poverty rate of 29.5%, comprising of 454 families. On the other hand, families with no children have the lowest poverty rate of 6.7%, which includes 720 families.
| Children | Above Poverty | Below Poverty |
| No Children | 10,066 (93.3%) | 720 (6.7%) |
| 1 or 2 Children | 7,483 (89.8%) | 851 (10.2%) |
| 3 or 4 Children | 1,086 (70.5%) | 454 (29.5%) |
| 5 or more Children | 68 (76.4%) | 21 (23.6%) |
| Total | 18,703 (90.1%) | 2,046 (9.9%) |
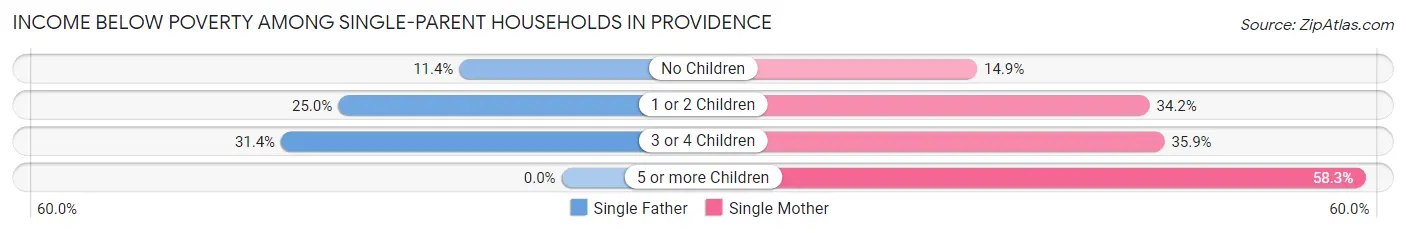
Income Below Poverty Among Single-Parent Households in Providence
According to the poverty data in Providence, 20.7% or 972 single-father households and 27.6% or 3,321 single-mother households are living below the poverty line. Among single-father households, those with 3 or 4 children have the highest poverty rate, with 206 households (31.4%) experiencing poverty. Likewise, among single-mother households, those with 5 or more children have the highest poverty rate, with 67 households (58.3%) falling below the poverty line.
| Children | Single Father | Single Mother |
| No Children | 205 (11.4%) | 664 (14.9%) |
| 1 or 2 Children | 561 (25.0%) | 1,945 (34.2%) |
| 3 or 4 Children | 206 (31.4%) | 645 (35.8%) |
| 5 or more Children | 0 (0.0%) | 67 (58.3%) |
| Total | 972 (20.7%) | 3,321 (27.6%) |
Income Below Poverty Among Married-Couple vs Single-Parent Households in Providence
The poverty data for Providence shows that 2,046 of the married-couple family households (9.9%) and 4,293 of the single-parent households (25.6%) are living below the poverty level. Within the married-couple family households, those with 3 or 4 children have the highest poverty rate, with 454 households (29.5%) falling below the poverty line. Among the single-parent households, those with 5 or more children have the highest poverty rate, with 67 household (58.3%) living below poverty.
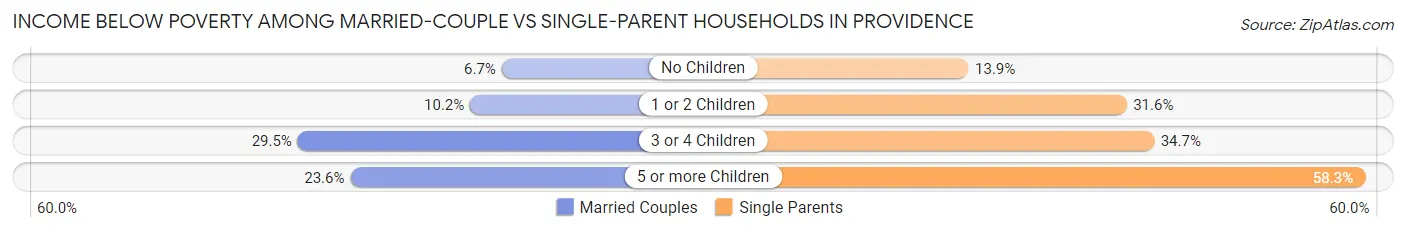
| Children | Married-Couple Families | Single-Parent Households |
| No Children | 720 (6.7%) | 869 (13.9%) |
| 1 or 2 Children | 851 (10.2%) | 2,506 (31.6%) |
| 3 or 4 Children | 454 (29.5%) | 851 (34.6%) |
| 5 or more Children | 21 (23.6%) | 67 (58.3%) |
| Total | 2,046 (9.9%) | 4,293 (25.6%) |
Employment Characteristics in Providence
Employment by Class of Employer in Providence
Among the 87,555 employed individuals in Providence, private company employees (57,445 | 65.6%), not-for-profit organizations (14,639 | 16.7%), and self-employed (not incorporated) (4,272 | 4.9%) make up the most common classes of employment.
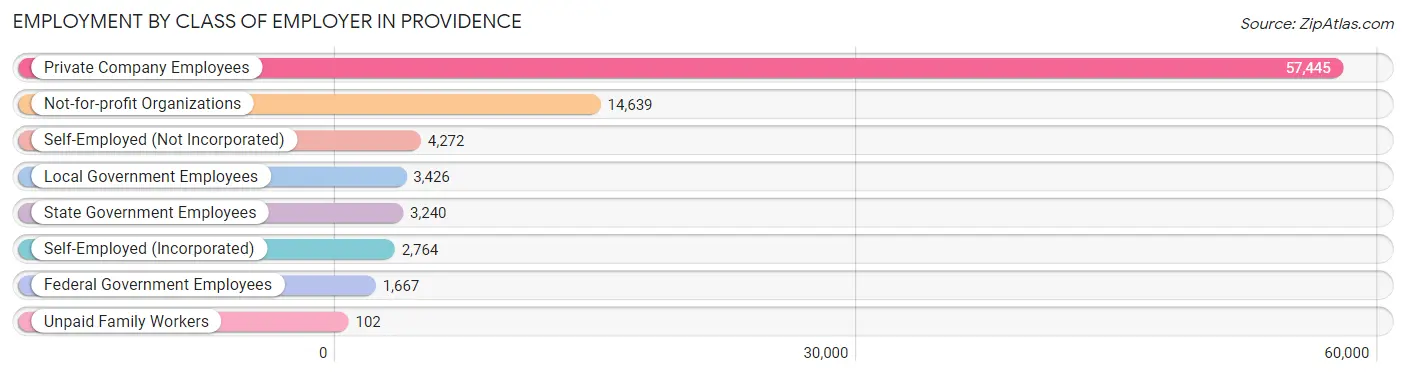
| Employer Class | # Employees | % Employees |
| Private Company Employees | 57,445 | 65.6% |
| Self-Employed (Incorporated) | 2,764 | 3.2% |
| Self-Employed (Not Incorporated) | 4,272 | 4.9% |
| Not-for-profit Organizations | 14,639 | 16.7% |
| Local Government Employees | 3,426 | 3.9% |
| State Government Employees | 3,240 | 3.7% |
| Federal Government Employees | 1,667 | 1.9% |
| Unpaid Family Workers | 102 | 0.1% |
| Total | 87,555 | 100.0% |
Employment Status by Age in Providence
According to the labor force statistics for Providence, out of the total population over 16 years of age (155,064), 63.1% or 97,845 individuals are in the labor force, with 7.2% or 7,045 of them unemployed. The age group with the highest labor force participation rate is 30 to 34 years, with 87.0% or 13,027 individuals in the labor force. Within the labor force, the 16 to 19 years age range has the highest percentage of unemployed individuals, with 13.2% or 752 of them being unemployed.
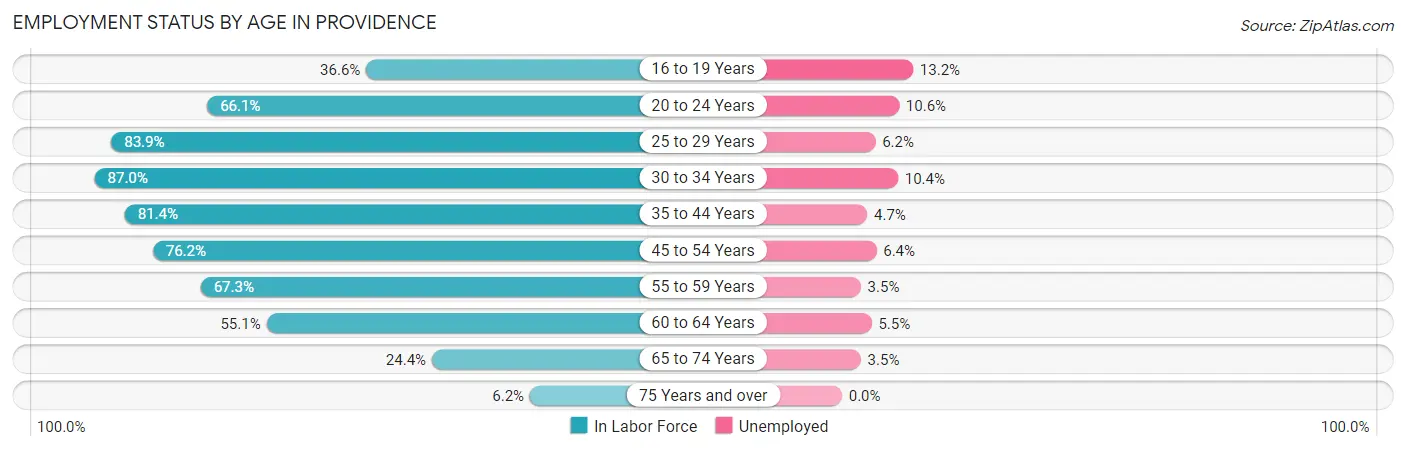
| Age Bracket | In Labor Force | Unemployed |
| 16 to 19 Years | 5,699 (36.6%) | 752 (13.2%) |
| 20 to 24 Years | 13,650 (66.1%) | 1,447 (10.6%) |
| 25 to 29 Years | 14,836 (83.9%) | 920 (6.2%) |
| 30 to 34 Years | 13,027 (87.0%) | 1,355 (10.4%) |
| 35 to 44 Years | 18,886 (81.4%) | 888 (4.7%) |
| 45 to 54 Years | 16,668 (76.2%) | 1,067 (6.4%) |
| 55 to 59 Years | 6,073 (67.3%) | 213 (3.5%) |
| 60 to 64 Years | 5,293 (55.1%) | 291 (5.5%) |
| 65 to 74 Years | 3,111 (24.4%) | 109 (3.5%) |
| 75 Years and over | 603 (6.2%) | 0 (0.0%) |
| Total | 97,845 (63.1%) | 7,045 (7.2%) |
Employment Status by Educational Attainment in Providence
According to labor force statistics for Providence, 77.6% of individuals (74,777) out of the total population between 25 and 64 years of age (96,362) are in the labor force, with 6.3% or 4,711 of them being unemployed. The group with the highest labor force participation rate are those with the educational attainment of bachelor's degree or higher, with 85.5% or 29,248 individuals in the labor force. Within the labor force, individuals with less than high school education have the highest percentage of unemployment, with 10.8% or 927 of them being unemployed.
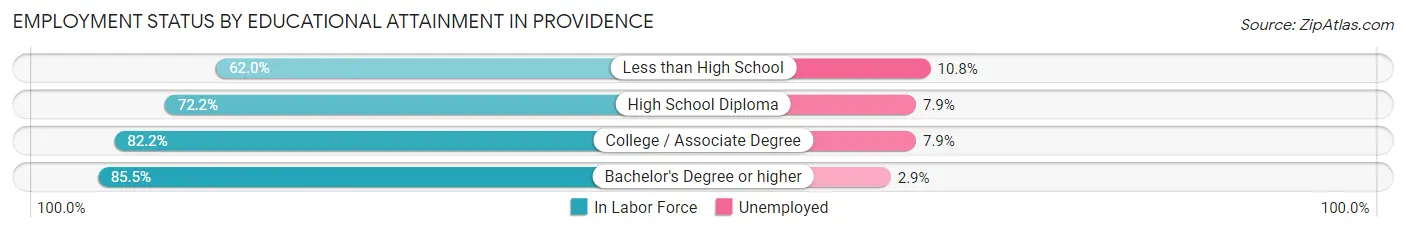
| Educational Attainment | In Labor Force | Unemployed |
| Less than High School | 8,581 (62.0%) | 1,495 (10.8%) |
| High School Diploma | 19,819 (72.2%) | 2,169 (7.9%) |
| College / Associate Degree | 17,149 (82.2%) | 1,648 (7.9%) |
| Bachelor's Degree or higher | 29,248 (85.5%) | 992 (2.9%) |
| Total | 74,777 (77.6%) | 6,071 (6.3%) |
Employment Occupations by Sex in Providence
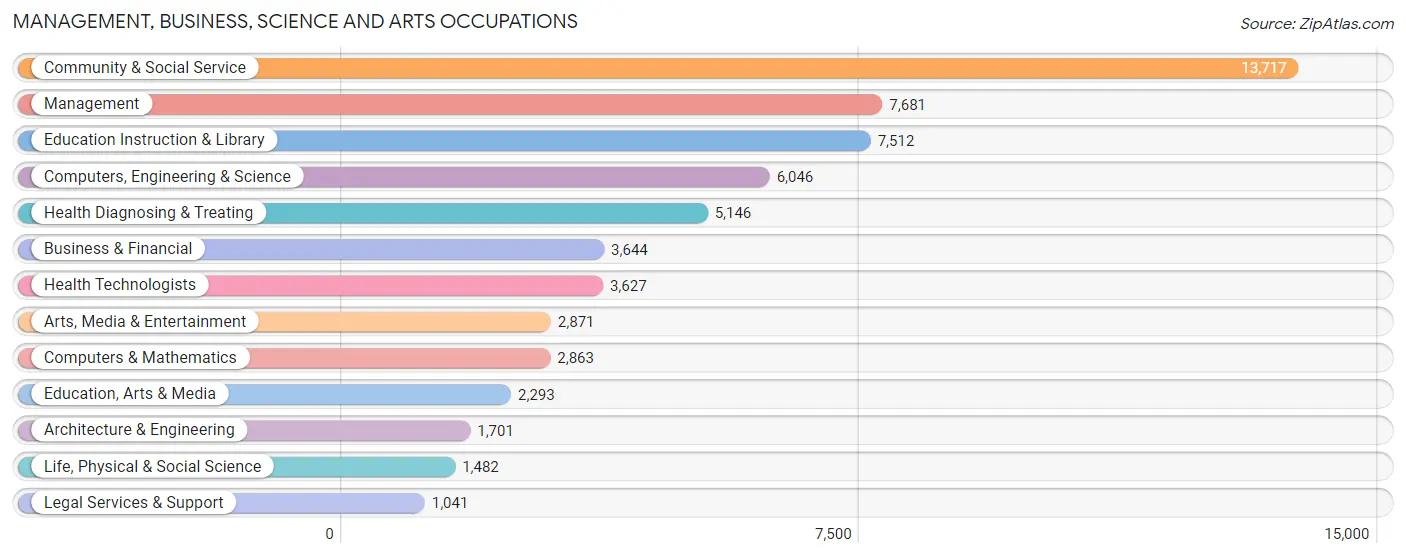
Management, Business, Science and Arts Occupations
The most common Management, Business, Science and Arts occupations in Providence are Community & Social Service (13,717 | 15.1%), Management (7,681 | 8.5%), Education Instruction & Library (7,512 | 8.3%), Computers, Engineering & Science (6,046 | 6.7%), and Health Diagnosing & Treating (5,146 | 5.7%).
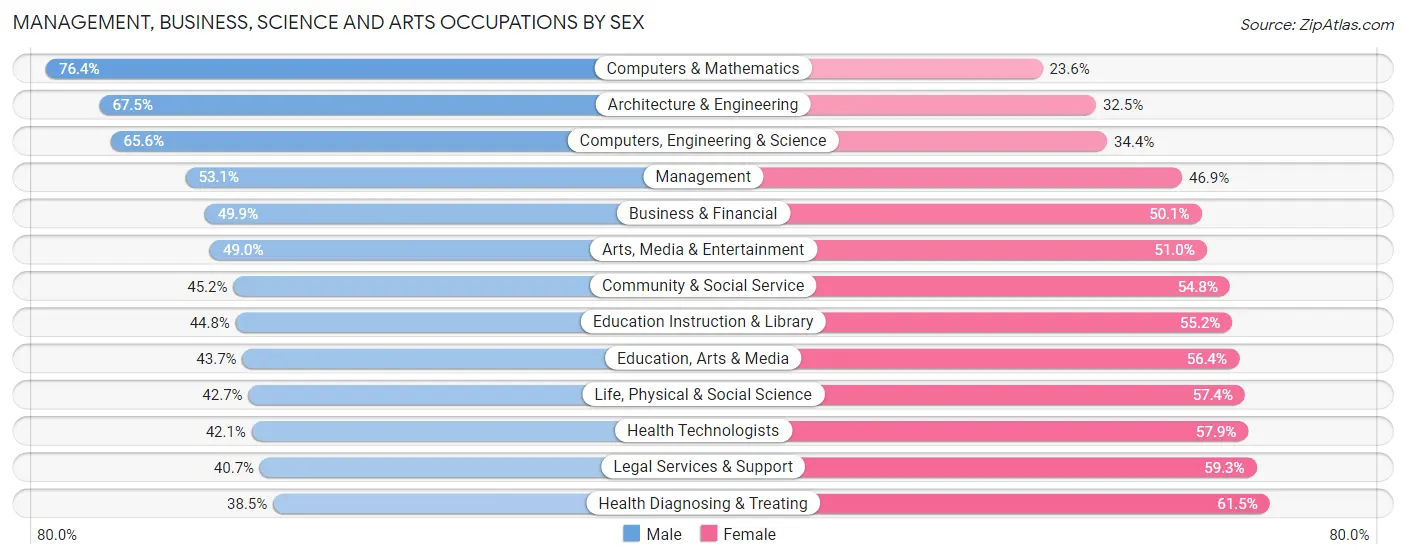
Management, Business, Science and Arts Occupations by Sex
Within the Management, Business, Science and Arts occupations in Providence, the most male-oriented occupations are Computers & Mathematics (76.4%), Architecture & Engineering (67.5%), and Computers, Engineering & Science (65.6%), while the most female-oriented occupations are Health Diagnosing & Treating (61.5%), Legal Services & Support (59.3%), and Health Technologists (57.9%).
| Occupation | Male | Female |
| Management | 4,081 (53.1%) | 3,600 (46.9%) |
| Business & Financial | 1,819 (49.9%) | 1,825 (50.1%) |
| Computers, Engineering & Science | 3,968 (65.6%) | 2,078 (34.4%) |
| Computers & Mathematics | 2,188 (76.4%) | 675 (23.6%) |
| Architecture & Engineering | 1,148 (67.5%) | 553 (32.5%) |
| Life, Physical & Social Science | 632 (42.6%) | 850 (57.4%) |
| Community & Social Service | 6,196 (45.2%) | 7,521 (54.8%) |
| Education, Arts & Media | 1,001 (43.6%) | 1,292 (56.4%) |
| Legal Services & Support | 424 (40.7%) | 617 (59.3%) |
| Education Instruction & Library | 3,363 (44.8%) | 4,149 (55.2%) |
| Arts, Media & Entertainment | 1,408 (49.0%) | 1,463 (51.0%) |
| Health Diagnosing & Treating | 1,983 (38.5%) | 3,163 (61.5%) |
| Health Technologists | 1,527 (42.1%) | 2,100 (57.9%) |
| Total (Category) | 18,047 (49.8%) | 18,187 (50.2%) |
| Total (Overall) | 46,250 (51.0%) | 44,430 (49.0%) |
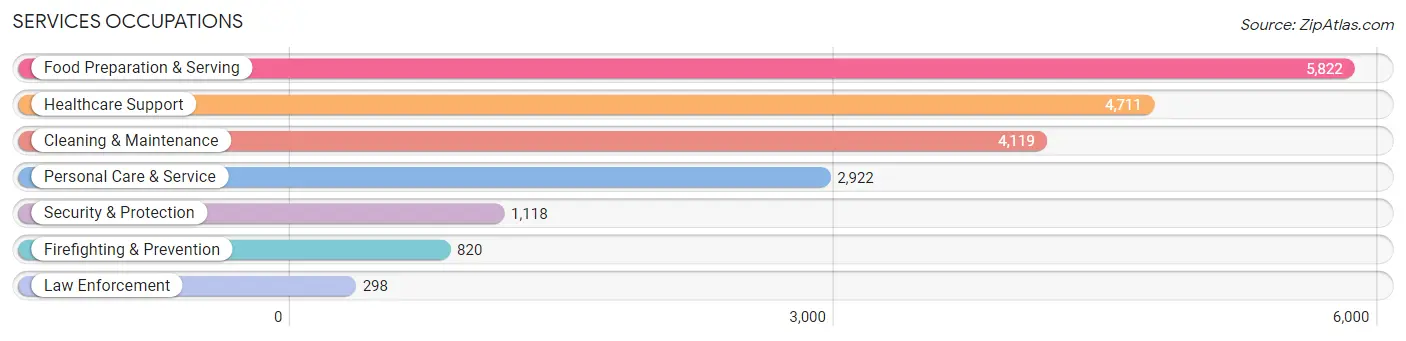
Services Occupations
The most common Services occupations in Providence are Food Preparation & Serving (5,822 | 6.4%), Healthcare Support (4,711 | 5.2%), Cleaning & Maintenance (4,119 | 4.5%), Personal Care & Service (2,922 | 3.2%), and Security & Protection (1,118 | 1.2%).
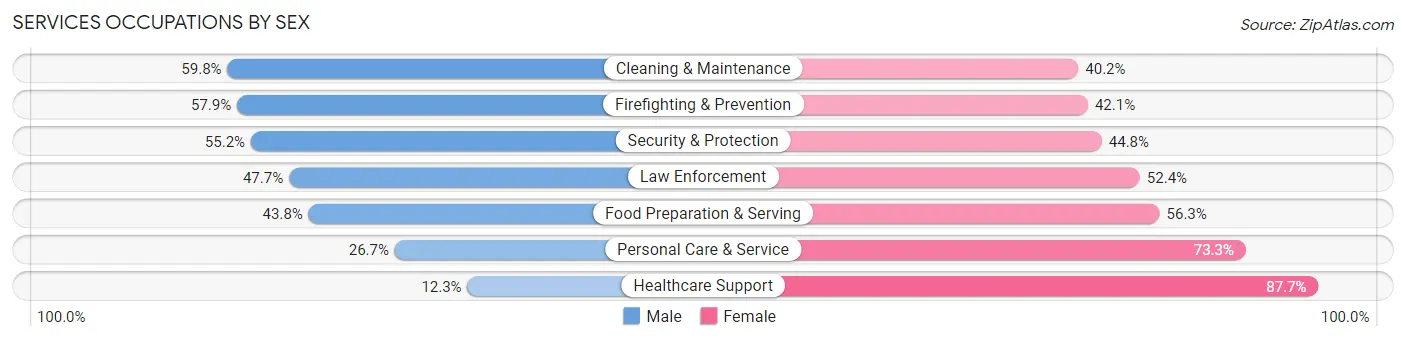
Services Occupations by Sex
Within the Services occupations in Providence, the most male-oriented occupations are Cleaning & Maintenance (59.8%), Firefighting & Prevention (57.9%), and Security & Protection (55.2%), while the most female-oriented occupations are Healthcare Support (87.7%), Personal Care & Service (73.3%), and Food Preparation & Serving (56.2%).
| Occupation | Male | Female |
| Healthcare Support | 580 (12.3%) | 4,131 (87.7%) |
| Security & Protection | 617 (55.2%) | 501 (44.8%) |
| Firefighting & Prevention | 475 (57.9%) | 345 (42.1%) |
| Law Enforcement | 142 (47.6%) | 156 (52.3%) |
| Food Preparation & Serving | 2,547 (43.8%) | 3,275 (56.2%) |
| Cleaning & Maintenance | 2,465 (59.8%) | 1,654 (40.2%) |
| Personal Care & Service | 780 (26.7%) | 2,142 (73.3%) |
| Total (Category) | 6,989 (37.4%) | 11,703 (62.6%) |
| Total (Overall) | 46,250 (51.0%) | 44,430 (49.0%) |
Sales and Office Occupations
The most common Sales and Office occupations in Providence are Office & Administration (8,965 | 9.9%), and Sales & Related (7,592 | 8.4%).

Sales and Office Occupations by Sex
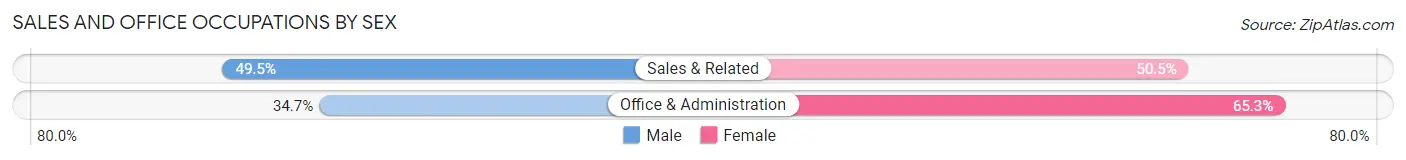
| Occupation | Male | Female |
| Sales & Related | 3,761 (49.5%) | 3,831 (50.5%) |
| Office & Administration | 3,111 (34.7%) | 5,854 (65.3%) |
| Total (Category) | 6,872 (41.5%) | 9,685 (58.5%) |
| Total (Overall) | 46,250 (51.0%) | 44,430 (49.0%) |
Natural Resources, Construction and Maintenance Occupations
The most common Natural Resources, Construction and Maintenance occupations in Providence are Construction & Extraction (3,012 | 3.3%), Installation, Maintenance & Repair (1,385 | 1.5%), and Farming, Fishing & Forestry (95 | 0.1%).

Natural Resources, Construction and Maintenance Occupations by Sex
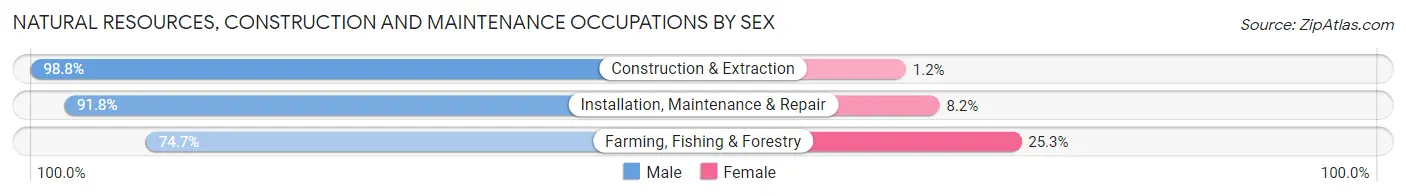
| Occupation | Male | Female |
| Farming, Fishing & Forestry | 71 (74.7%) | 24 (25.3%) |
| Construction & Extraction | 2,975 (98.8%) | 37 (1.2%) |
| Installation, Maintenance & Repair | 1,271 (91.8%) | 114 (8.2%) |
| Total (Category) | 4,317 (96.1%) | 175 (3.9%) |
| Total (Overall) | 46,250 (51.0%) | 44,430 (49.0%) |
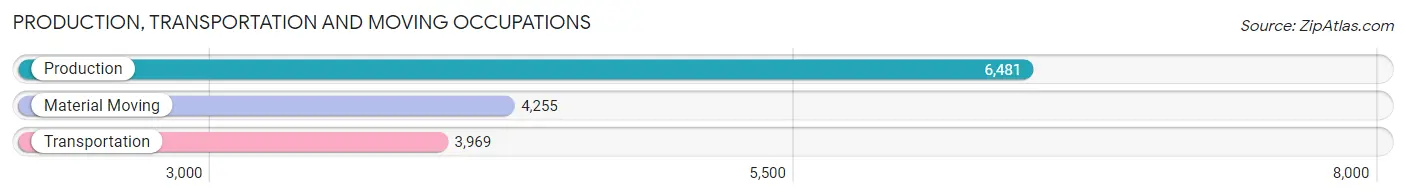
Production, Transportation and Moving Occupations
The most common Production, Transportation and Moving occupations in Providence are Production (6,481 | 7.1%), Material Moving (4,255 | 4.7%), and Transportation (3,969 | 4.4%).
Production, Transportation and Moving Occupations by Sex
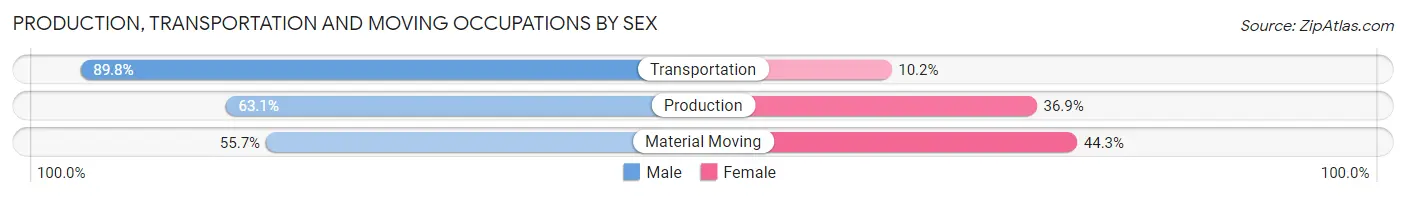
| Occupation | Male | Female |
| Production | 4,091 (63.1%) | 2,390 (36.9%) |
| Transportation | 3,563 (89.8%) | 406 (10.2%) |
| Material Moving | 2,371 (55.7%) | 1,884 (44.3%) |
| Total (Category) | 10,025 (68.2%) | 4,680 (31.8%) |
| Total (Overall) | 46,250 (51.0%) | 44,430 (49.0%) |
Employment Industries by Sex in Providence
Employment Industries in Providence
The major employment industries in Providence include Health Care & Social Assistance (14,839 | 16.4%), Educational Services (11,842 | 13.1%), Manufacturing (10,260 | 11.3%), Retail Trade (9,636 | 10.6%), and Accommodation & Food Services (7,075 | 7.8%).
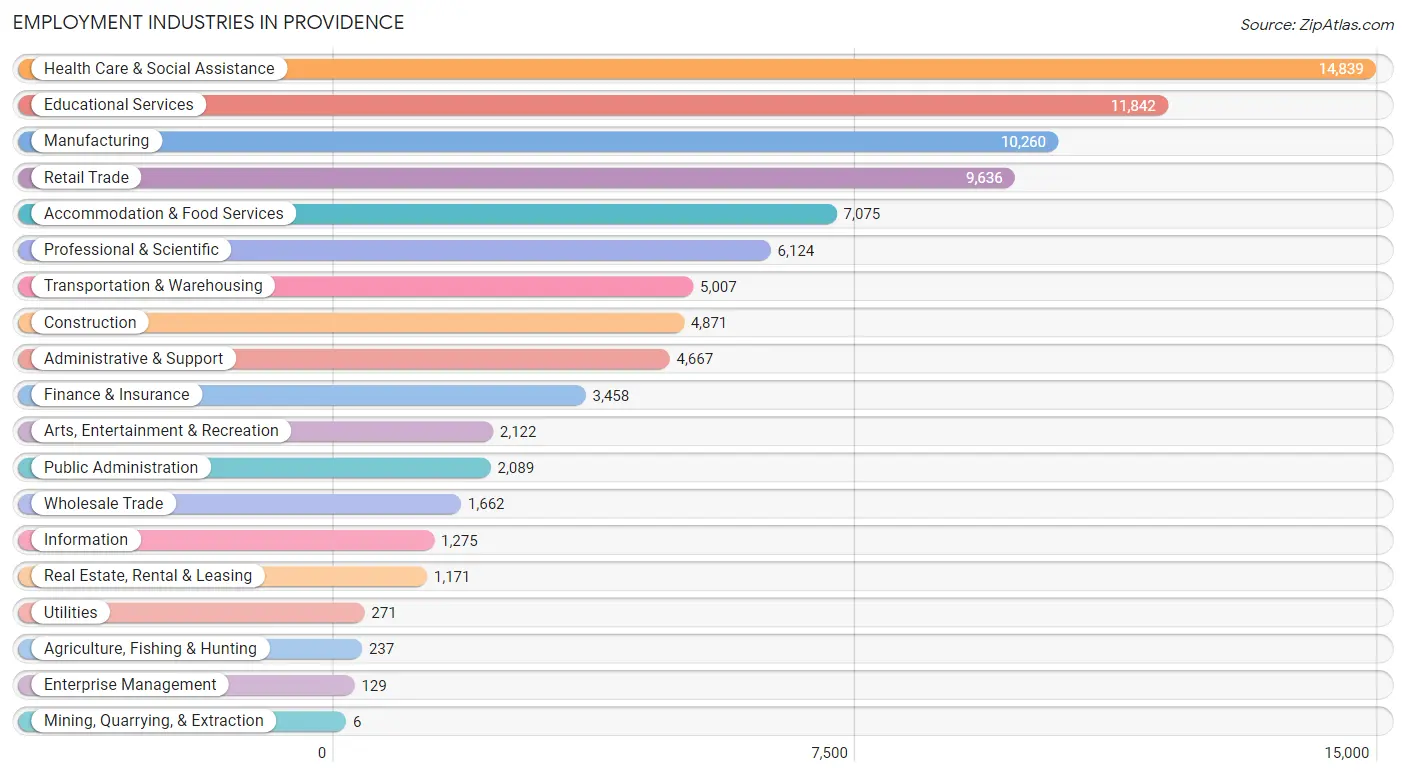
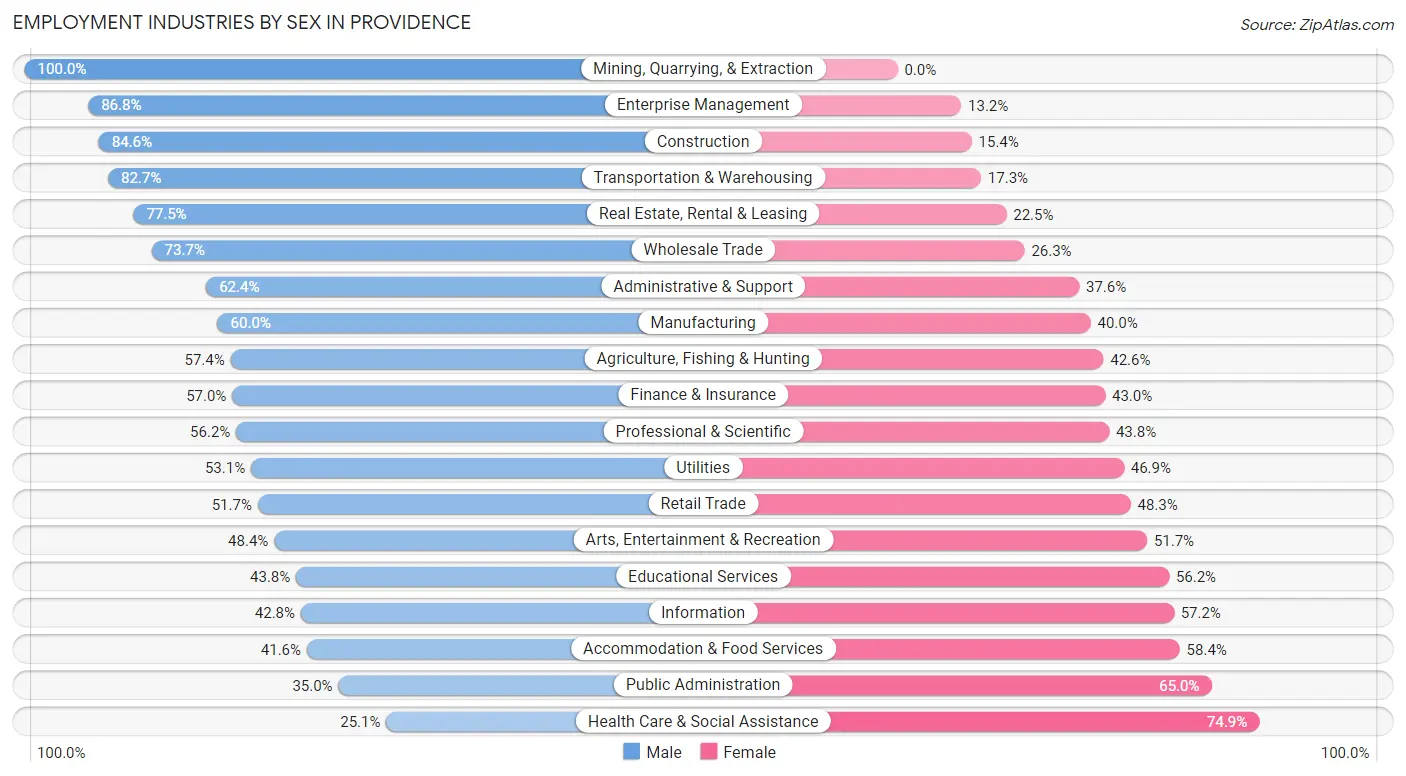
Employment Industries by Sex in Providence
The Providence industries that see more men than women are Mining, Quarrying, & Extraction (100.0%), Enterprise Management (86.8%), and Construction (84.6%), whereas the industries that tend to have a higher number of women are Health Care & Social Assistance (74.9%), Public Administration (65.0%), and Accommodation & Food Services (58.4%).
| Industry | Male | Female |
| Agriculture, Fishing & Hunting | 136 (57.4%) | 101 (42.6%) |
| Mining, Quarrying, & Extraction | 6 (100.0%) | 0 (0.0%) |
| Construction | 4,123 (84.6%) | 748 (15.4%) |
| Manufacturing | 6,159 (60.0%) | 4,101 (40.0%) |
| Wholesale Trade | 1,225 (73.7%) | 437 (26.3%) |
| Retail Trade | 4,986 (51.7%) | 4,650 (48.3%) |
| Transportation & Warehousing | 4,142 (82.7%) | 865 (17.3%) |
| Utilities | 144 (53.1%) | 127 (46.9%) |
| Information | 546 (42.8%) | 729 (57.2%) |
| Finance & Insurance | 1,972 (57.0%) | 1,486 (43.0%) |
| Real Estate, Rental & Leasing | 907 (77.5%) | 264 (22.5%) |
| Professional & Scientific | 3,442 (56.2%) | 2,682 (43.8%) |
| Enterprise Management | 112 (86.8%) | 17 (13.2%) |
| Administrative & Support | 2,912 (62.4%) | 1,755 (37.6%) |
| Educational Services | 5,187 (43.8%) | 6,655 (56.2%) |
| Health Care & Social Assistance | 3,731 (25.1%) | 11,108 (74.9%) |
| Arts, Entertainment & Recreation | 1,026 (48.3%) | 1,096 (51.6%) |
| Accommodation & Food Services | 2,942 (41.6%) | 4,133 (58.4%) |
| Public Administration | 732 (35.0%) | 1,357 (65.0%) |
| Total | 46,250 (51.0%) | 44,430 (49.0%) |
Education in Providence
School Enrollment in Providence
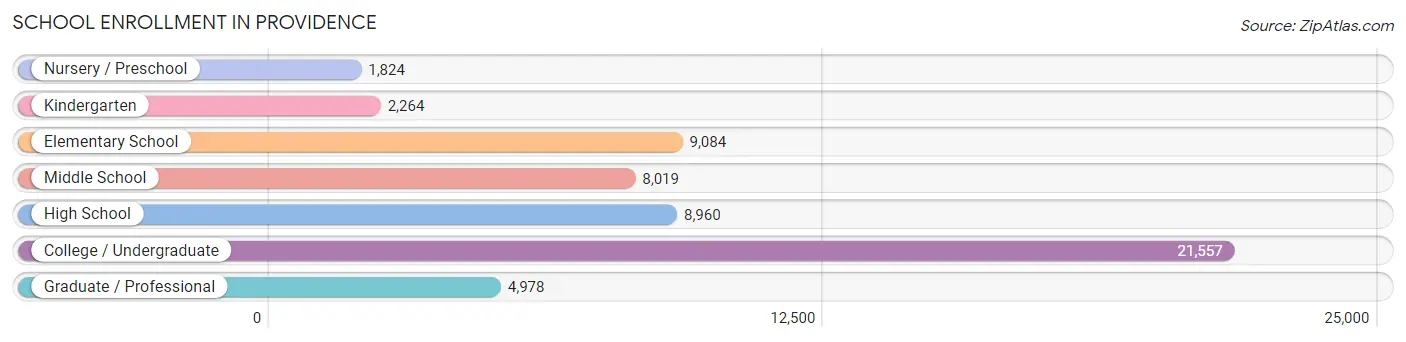
The most common levels of schooling among the 56,686 students in Providence are college / undergraduate (21,557 | 38.0%), elementary school (9,084 | 16.0%), and high school (8,960 | 15.8%).
| School Level | # Students | % Students |
| Nursery / Preschool | 1,824 | 3.2% |
| Kindergarten | 2,264 | 4.0% |
| Elementary School | 9,084 | 16.0% |
| Middle School | 8,019 | 14.1% |
| High School | 8,960 | 15.8% |
| College / Undergraduate | 21,557 | 38.0% |
| Graduate / Professional | 4,978 | 8.8% |
| Total | 56,686 | 100.0% |
School Enrollment by Age by Funding Source in Providence
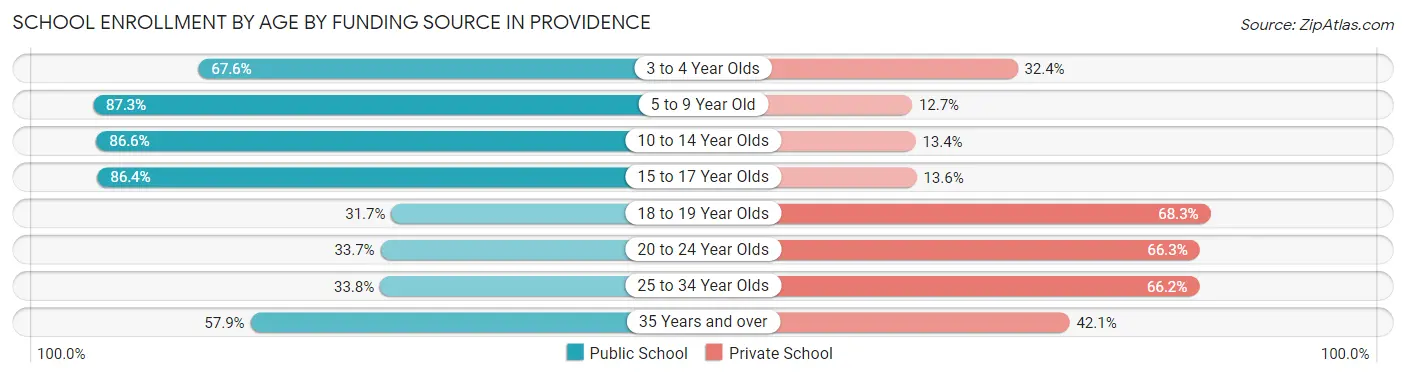
Out of a total of 56,686 students who are enrolled in schools in Providence, 22,618 (39.9%) attend a private institution, while the remaining 34,068 (60.1%) are enrolled in public schools. The age group of 18 to 19 year olds has the highest likelihood of being enrolled in private schools, with 6,409 (68.3% in the age bracket) enrolled. Conversely, the age group of 5 to 9 year old has the lowest likelihood of being enrolled in a private school, with 8,974 (87.3% in the age bracket) attending a public institution.
| Age Bracket | Public School | Private School |
| 3 to 4 Year Olds | 1,009 (67.6%) | 483 (32.4%) |
| 5 to 9 Year Old | 8,974 (87.3%) | 1,308 (12.7%) |
| 10 to 14 Year Olds | 8,706 (86.6%) | 1,344 (13.4%) |
| 15 to 17 Year Olds | 5,361 (86.4%) | 841 (13.6%) |
| 18 to 19 Year Olds | 2,974 (31.7%) | 6,409 (68.3%) |
| 20 to 24 Year Olds | 4,290 (33.7%) | 8,431 (66.3%) |
| 25 to 34 Year Olds | 1,467 (33.8%) | 2,873 (66.2%) |
| 35 Years and over | 1,284 (57.9%) | 932 (42.1%) |
| Total | 34,068 (60.1%) | 22,618 (39.9%) |
Educational Attainment by Field of Study in Providence
Business (6,768 | 15.2%), social sciences (4,298 | 9.6%), bio, nature & agricultural (4,260 | 9.6%), literature & languages (4,180 | 9.4%), and visual & performing arts (4,158 | 9.3%) are the most common fields of study among 44,609 individuals in Providence who have obtained a bachelor's degree or higher.
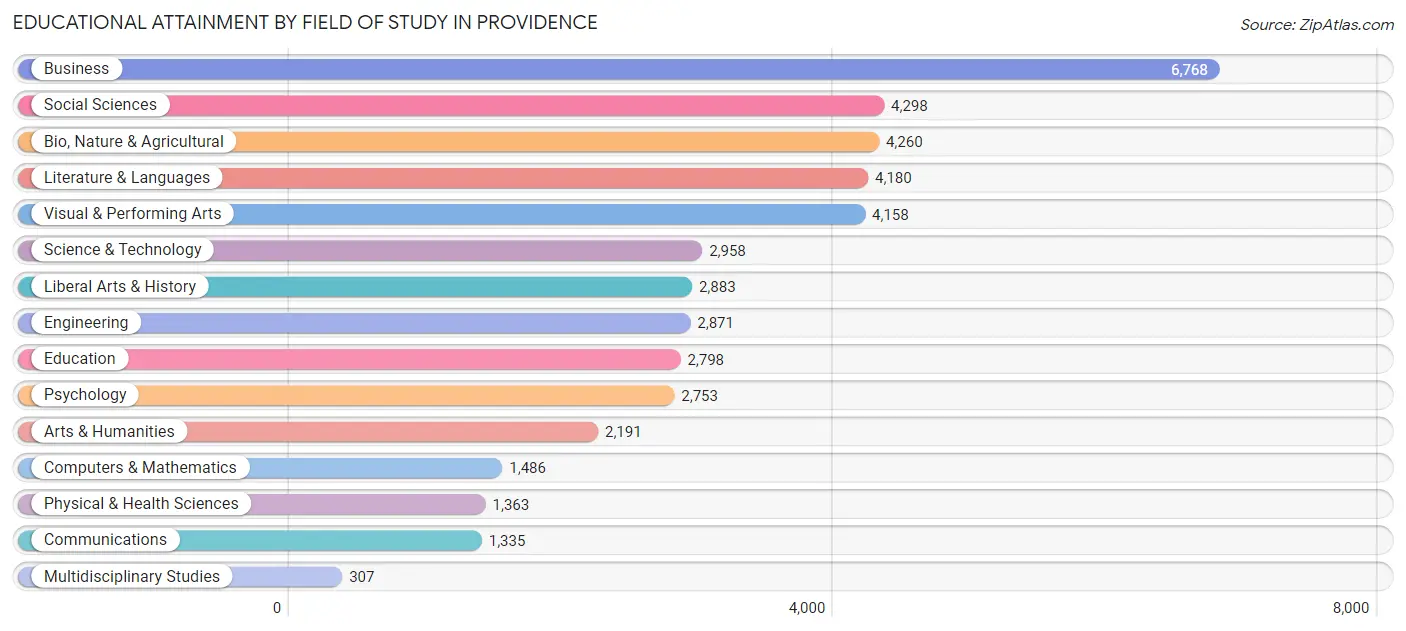
| Field of Study | # Graduates | % Graduates |
| Computers & Mathematics | 1,486 | 3.3% |
| Bio, Nature & Agricultural | 4,260 | 9.6% |
| Physical & Health Sciences | 1,363 | 3.1% |
| Psychology | 2,753 | 6.2% |
| Social Sciences | 4,298 | 9.6% |
| Engineering | 2,871 | 6.4% |
| Multidisciplinary Studies | 307 | 0.7% |
| Science & Technology | 2,958 | 6.6% |
| Business | 6,768 | 15.2% |
| Education | 2,798 | 6.3% |
| Literature & Languages | 4,180 | 9.4% |
| Liberal Arts & History | 2,883 | 6.5% |
| Visual & Performing Arts | 4,158 | 9.3% |
| Communications | 1,335 | 3.0% |
| Arts & Humanities | 2,191 | 4.9% |
| Total | 44,609 | 100.0% |
Transportation & Commute in Providence
Vehicle Availability by Sex in Providence
The most prevalent vehicle ownership categories in Providence are males with 2 vehicles (16,592, accounting for 38.1%) and females with 2 vehicles (15,349, making up 41.4%).
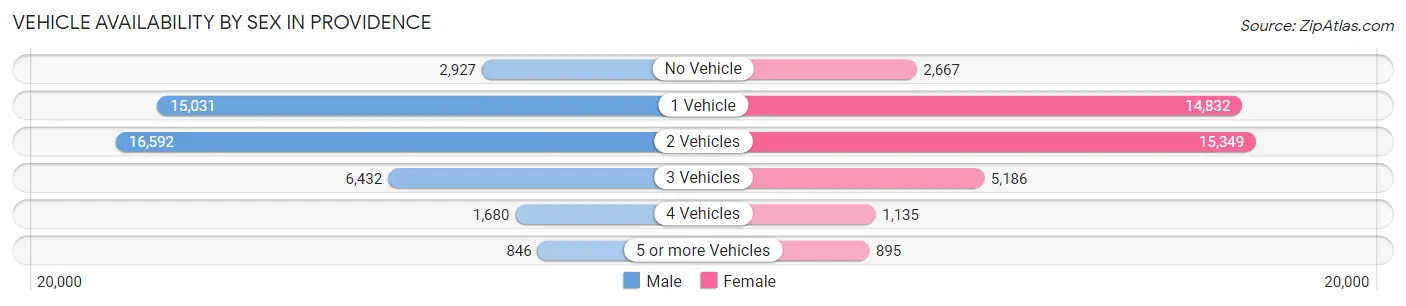
| Vehicles Available | Male | Female |
| No Vehicle | 2,927 (6.7%) | 2,667 (6.7%) |
| 1 Vehicle | 15,031 (34.5%) | 14,832 (37.0%) |
| 2 Vehicles | 16,592 (38.1%) | 15,349 (38.3%) |
| 3 Vehicles | 6,432 (14.8%) | 5,186 (12.9%) |
| 4 Vehicles | 1,680 (3.9%) | 1,135 (2.8%) |
| 5 or more Vehicles | 846 (1.9%) | 895 (2.2%) |
| Total | 43,508 (100.0%) | 40,064 (100.0%) |
Commute Time in Providence
The most frequently occuring commute durations in Providence are 15 to 19 minutes (16,156 commuters, 20.9%), 10 to 14 minutes (13,378 commuters, 17.3%), and 20 to 24 minutes (12,155 commuters, 15.7%).
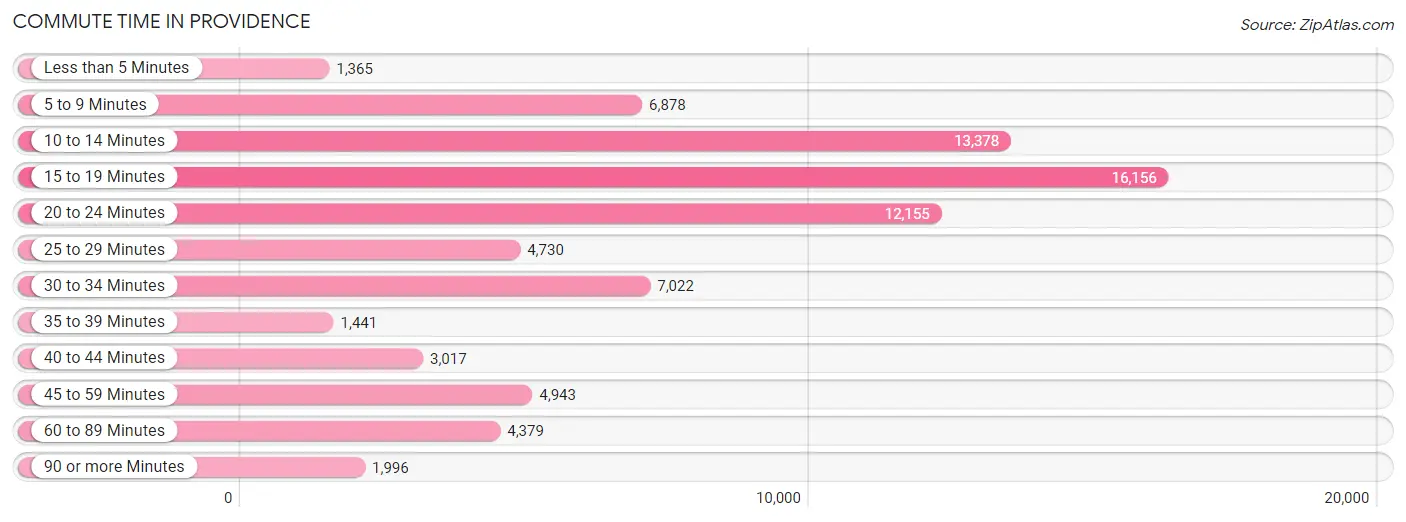
| Commute Time | # Commuters | % Commuters |
| Less than 5 Minutes | 1,365 | 1.8% |
| 5 to 9 Minutes | 6,878 | 8.9% |
| 10 to 14 Minutes | 13,378 | 17.3% |
| 15 to 19 Minutes | 16,156 | 20.9% |
| 20 to 24 Minutes | 12,155 | 15.7% |
| 25 to 29 Minutes | 4,730 | 6.1% |
| 30 to 34 Minutes | 7,022 | 9.1% |
| 35 to 39 Minutes | 1,441 | 1.9% |
| 40 to 44 Minutes | 3,017 | 3.9% |
| 45 to 59 Minutes | 4,943 | 6.4% |
| 60 to 89 Minutes | 4,379 | 5.7% |
| 90 or more Minutes | 1,996 | 2.6% |
Commute Time by Sex in Providence
The most common commute times in Providence are 10 to 14 minutes (6,892 commuters, 17.2%) for males and 15 to 19 minutes (9,822 commuters, 26.2%) for females.
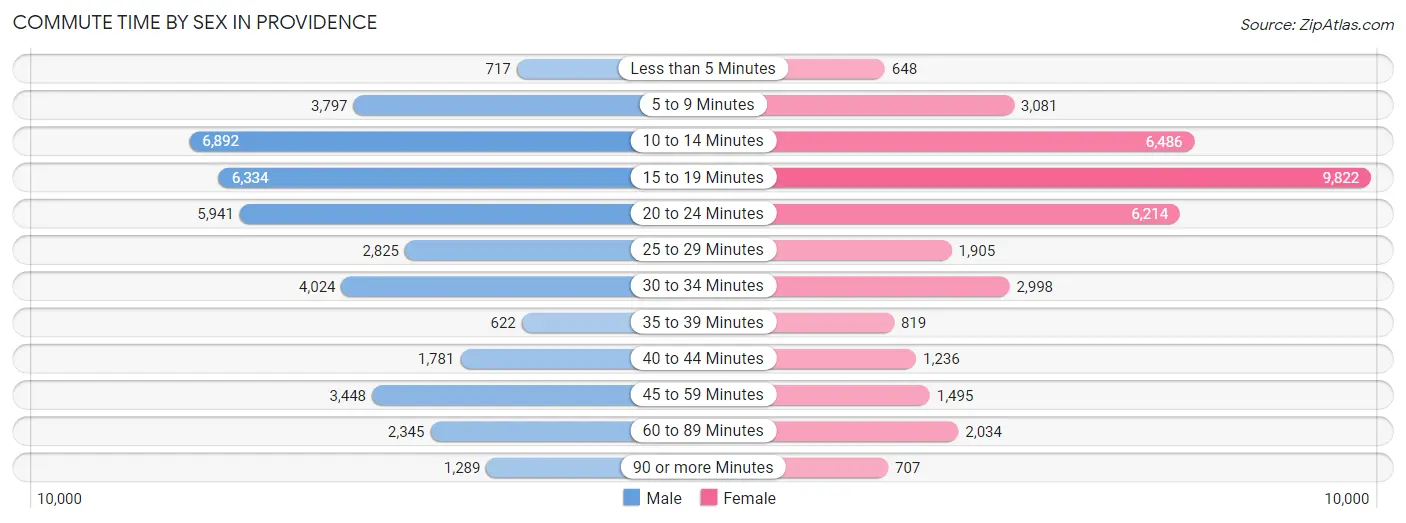
| Commute Time | Male | Female |
| Less than 5 Minutes | 717 (1.8%) | 648 (1.7%) |
| 5 to 9 Minutes | 3,797 (9.5%) | 3,081 (8.2%) |
| 10 to 14 Minutes | 6,892 (17.2%) | 6,486 (17.3%) |
| 15 to 19 Minutes | 6,334 (15.8%) | 9,822 (26.2%) |
| 20 to 24 Minutes | 5,941 (14.8%) | 6,214 (16.6%) |
| 25 to 29 Minutes | 2,825 (7.1%) | 1,905 (5.1%) |
| 30 to 34 Minutes | 4,024 (10.1%) | 2,998 (8.0%) |
| 35 to 39 Minutes | 622 (1.5%) | 819 (2.2%) |
| 40 to 44 Minutes | 1,781 (4.4%) | 1,236 (3.3%) |
| 45 to 59 Minutes | 3,448 (8.6%) | 1,495 (4.0%) |
| 60 to 89 Minutes | 2,345 (5.9%) | 2,034 (5.4%) |
| 90 or more Minutes | 1,289 (3.2%) | 707 (1.9%) |
Time of Departure to Work by Sex in Providence
The most frequent times of departure to work in Providence are 7:00 AM to 7:29 AM (6,534, 16.3%) for males and 8:00 AM to 8:29 AM (6,068, 16.2%) for females.
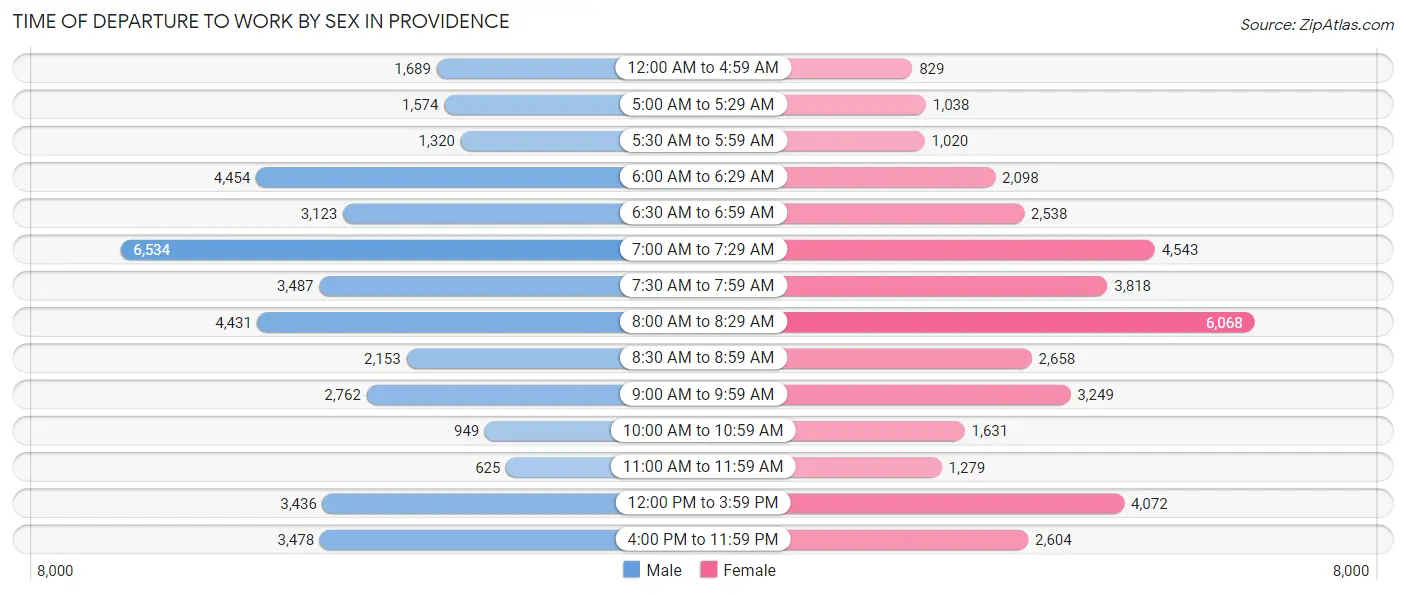
| Time of Departure | Male | Female |
| 12:00 AM to 4:59 AM | 1,689 (4.2%) | 829 (2.2%) |
| 5:00 AM to 5:29 AM | 1,574 (3.9%) | 1,038 (2.8%) |
| 5:30 AM to 5:59 AM | 1,320 (3.3%) | 1,020 (2.7%) |
| 6:00 AM to 6:29 AM | 4,454 (11.1%) | 2,098 (5.6%) |
| 6:30 AM to 6:59 AM | 3,123 (7.8%) | 2,538 (6.8%) |
| 7:00 AM to 7:29 AM | 6,534 (16.3%) | 4,543 (12.1%) |
| 7:30 AM to 7:59 AM | 3,487 (8.7%) | 3,818 (10.2%) |
| 8:00 AM to 8:29 AM | 4,431 (11.1%) | 6,068 (16.2%) |
| 8:30 AM to 8:59 AM | 2,153 (5.4%) | 2,658 (7.1%) |
| 9:00 AM to 9:59 AM | 2,762 (6.9%) | 3,249 (8.7%) |
| 10:00 AM to 10:59 AM | 949 (2.4%) | 1,631 (4.4%) |
| 11:00 AM to 11:59 AM | 625 (1.6%) | 1,279 (3.4%) |
| 12:00 PM to 3:59 PM | 3,436 (8.6%) | 4,072 (10.9%) |
| 4:00 PM to 11:59 PM | 3,478 (8.7%) | 2,604 (7.0%) |
| Total | 40,015 (100.0%) | 37,445 (100.0%) |
Housing Occupancy in Providence
Occupancy by Ownership in Providence
Of the total 69,110 dwellings in Providence, owner-occupied units account for 27,603 (39.9%), while renter-occupied units make up 41,507 (60.1%).
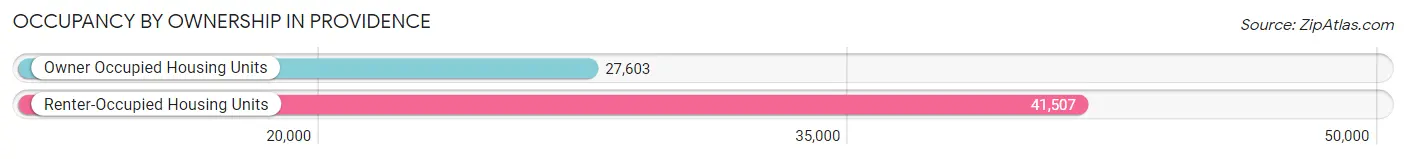
| Occupancy | # Housing Units | % Housing Units |
| Owner Occupied Housing Units | 27,603 | 39.9% |
| Renter-Occupied Housing Units | 41,507 | 60.1% |
| Total Occupied Housing Units | 69,110 | 100.0% |
Occupancy by Household Size in Providence
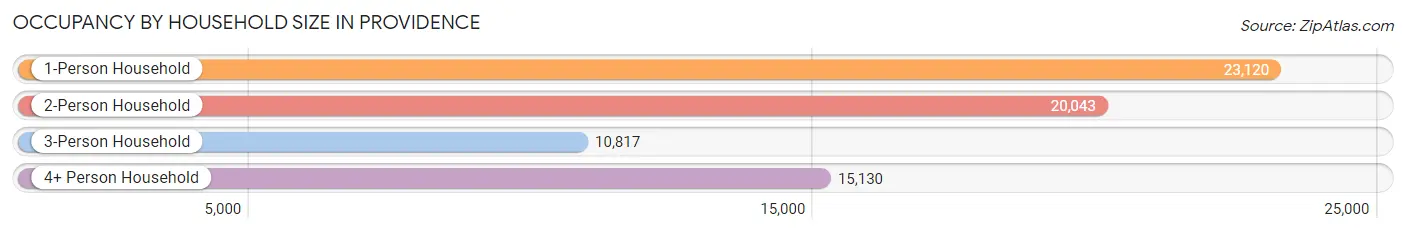
| Household Size | # Housing Units | % Housing Units |
| 1-Person Household | 23,120 | 33.5% |
| 2-Person Household | 20,043 | 29.0% |
| 3-Person Household | 10,817 | 15.7% |
| 4+ Person Household | 15,130 | 21.9% |
| Total Housing Units | 69,110 | 100.0% |
Occupancy by Ownership by Household Size in Providence
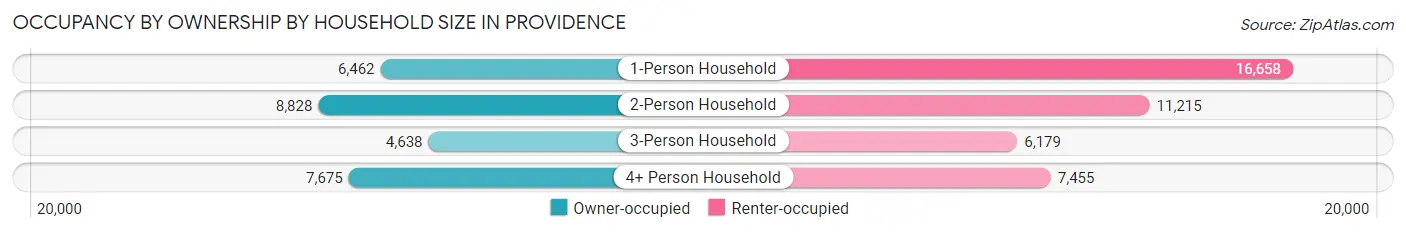
| Household Size | Owner-occupied | Renter-occupied |
| 1-Person Household | 6,462 (28.0%) | 16,658 (72.1%) |
| 2-Person Household | 8,828 (44.1%) | 11,215 (55.9%) |
| 3-Person Household | 4,638 (42.9%) | 6,179 (57.1%) |
| 4+ Person Household | 7,675 (50.7%) | 7,455 (49.3%) |
| Total Housing Units | 27,603 (39.9%) | 41,507 (60.1%) |
Occupancy by Educational Attainment in Providence
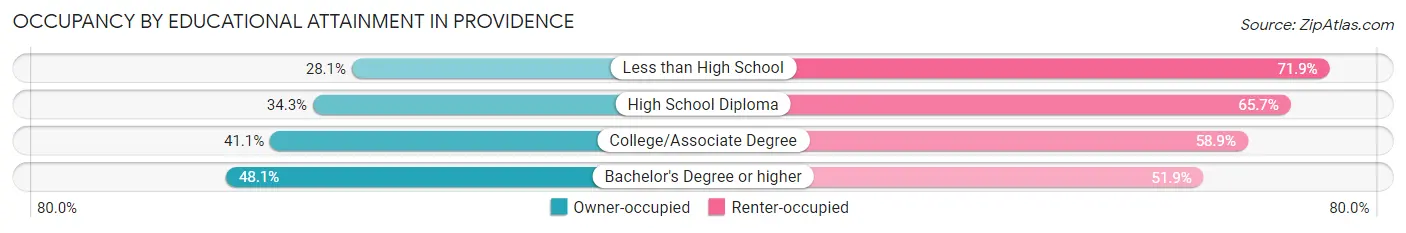
| Household Size | Owner-occupied | Renter-occupied |
| Less than High School | 2,971 (28.1%) | 7,597 (71.9%) |
| High School Diploma | 6,427 (34.3%) | 12,325 (65.7%) |
| College/Associate Degree | 5,392 (41.1%) | 7,736 (58.9%) |
| Bachelor's Degree or higher | 12,813 (48.1%) | 13,849 (51.9%) |
Occupancy by Age of Householder in Providence
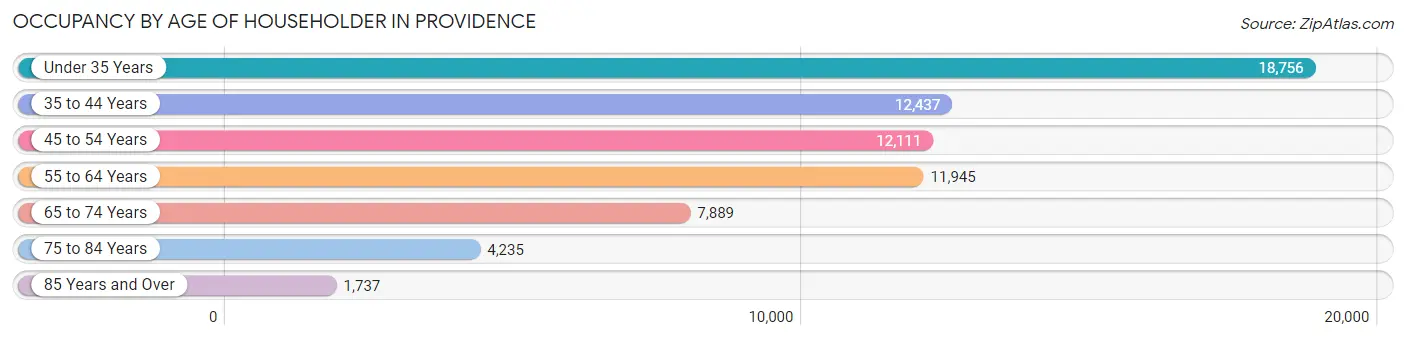
| Age Bracket | # Households | % Households |
| Under 35 Years | 18,756 | 27.1% |
| 35 to 44 Years | 12,437 | 18.0% |
| 45 to 54 Years | 12,111 | 17.5% |
| 55 to 64 Years | 11,945 | 17.3% |
| 65 to 74 Years | 7,889 | 11.4% |
| 75 to 84 Years | 4,235 | 6.1% |
| 85 Years and Over | 1,737 | 2.5% |
| Total | 69,110 | 100.0% |
Housing Finances in Providence
Median Income by Occupancy in Providence
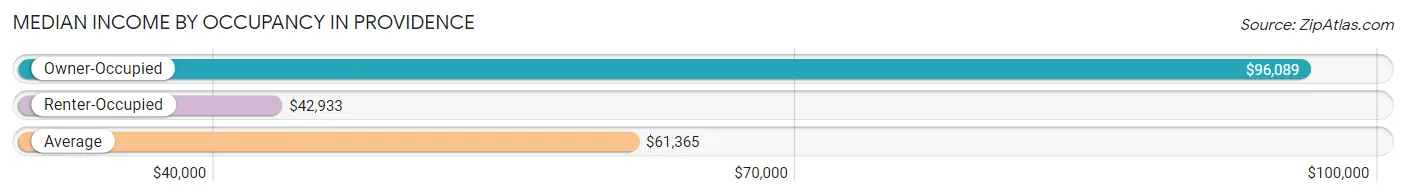
| Occupancy Type | # Households | Median Income |
| Owner-Occupied | 27,603 (39.9%) | $96,089 |
| Renter-Occupied | 41,507 (60.1%) | $42,933 |
| Average | 69,110 (100.0%) | $61,365 |
Occupancy by Householder Income Bracket in Providence
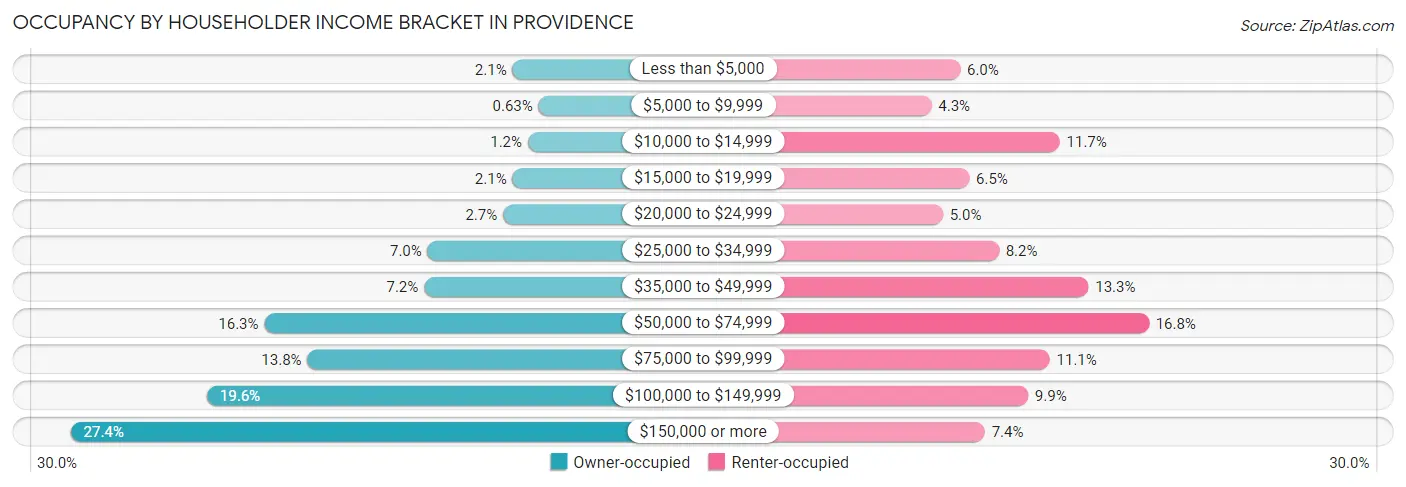
| Income Bracket | Owner-occupied | Renter-occupied |
| Less than $5,000 | 586 (2.1%) | 2,477 (6.0%) |
| $5,000 to $9,999 | 174 (0.6%) | 1,799 (4.3%) |
| $10,000 to $14,999 | 342 (1.2%) | 4,841 (11.7%) |
| $15,000 to $19,999 | 585 (2.1%) | 2,695 (6.5%) |
| $20,000 to $24,999 | 735 (2.7%) | 2,069 (5.0%) |
| $25,000 to $34,999 | 1,924 (7.0%) | 3,397 (8.2%) |
| $35,000 to $49,999 | 1,978 (7.2%) | 5,521 (13.3%) |
| $50,000 to $74,999 | 4,500 (16.3%) | 6,951 (16.8%) |
| $75,000 to $99,999 | 3,819 (13.8%) | 4,605 (11.1%) |
| $100,000 to $149,999 | 5,405 (19.6%) | 4,088 (9.9%) |
| $150,000 or more | 7,555 (27.4%) | 3,064 (7.4%) |
| Total | 27,603 (100.0%) | 41,507 (100.0%) |
Monthly Housing Cost Tiers in Providence
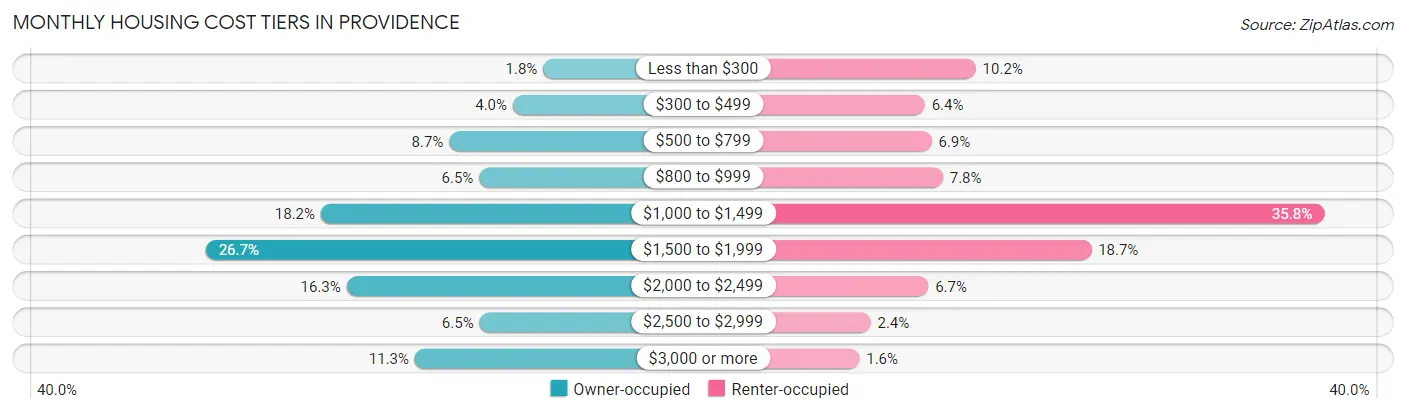
| Monthly Cost | Owner-occupied | Renter-occupied |
| Less than $300 | 499 (1.8%) | 4,224 (10.2%) |
| $300 to $499 | 1,115 (4.0%) | 2,668 (6.4%) |
| $500 to $799 | 2,411 (8.7%) | 2,875 (6.9%) |
| $800 to $999 | 1,801 (6.5%) | 3,219 (7.8%) |
| $1,000 to $1,499 | 5,019 (18.2%) | 14,872 (35.8%) |
| $1,500 to $1,999 | 7,358 (26.7%) | 7,756 (18.7%) |
| $2,000 to $2,499 | 4,497 (16.3%) | 2,776 (6.7%) |
| $2,500 to $2,999 | 1,794 (6.5%) | 1,013 (2.4%) |
| $3,000 or more | 3,109 (11.3%) | 670 (1.6%) |
| Total | 27,603 (100.0%) | 41,507 (100.0%) |
Physical Housing Characteristics in Providence
Housing Structures in Providence
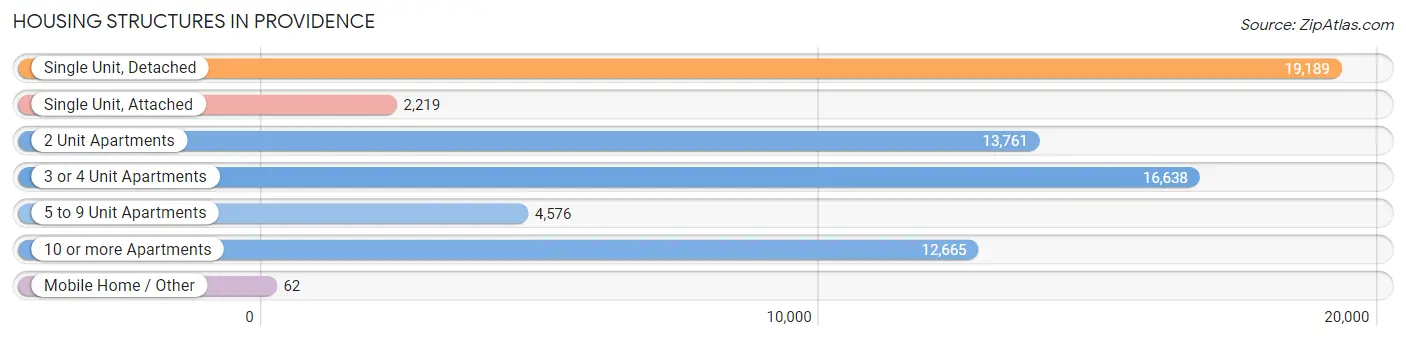
| Structure Type | # Housing Units | % Housing Units |
| Single Unit, Detached | 19,189 | 27.8% |
| Single Unit, Attached | 2,219 | 3.2% |
| 2 Unit Apartments | 13,761 | 19.9% |
| 3 or 4 Unit Apartments | 16,638 | 24.1% |
| 5 to 9 Unit Apartments | 4,576 | 6.6% |
| 10 or more Apartments | 12,665 | 18.3% |
| Mobile Home / Other | 62 | 0.1% |
| Total | 69,110 | 100.0% |
Housing Structures by Occupancy in Providence
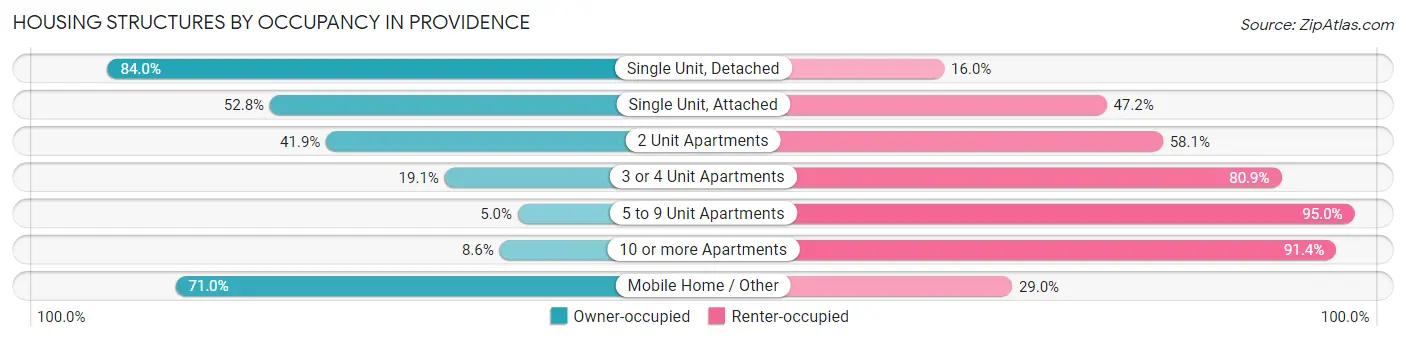
| Structure Type | Owner-occupied | Renter-occupied |
| Single Unit, Detached | 16,122 (84.0%) | 3,067 (16.0%) |
| Single Unit, Attached | 1,171 (52.8%) | 1,048 (47.2%) |
| 2 Unit Apartments | 5,771 (41.9%) | 7,990 (58.1%) |
| 3 or 4 Unit Apartments | 3,181 (19.1%) | 13,457 (80.9%) |
| 5 to 9 Unit Apartments | 230 (5.0%) | 4,346 (95.0%) |
| 10 or more Apartments | 1,084 (8.6%) | 11,581 (91.4%) |
| Mobile Home / Other | 44 (71.0%) | 18 (29.0%) |
| Total | 27,603 (39.9%) | 41,507 (60.1%) |
Housing Structures by Number of Rooms in Providence
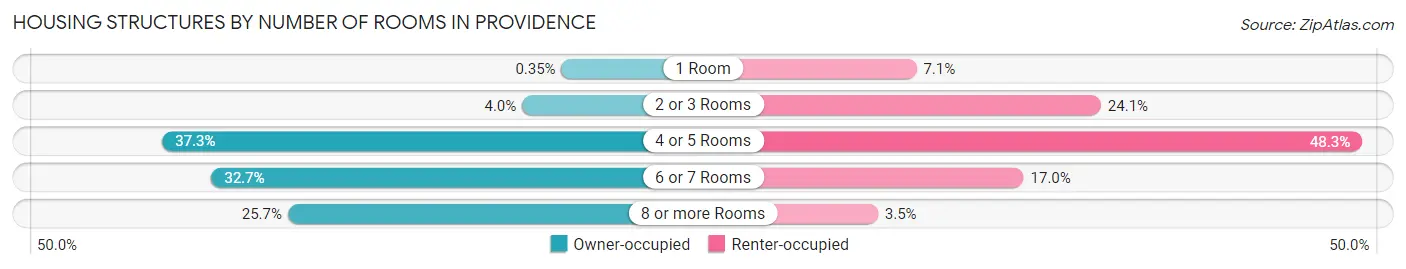
| Number of Rooms | Owner-occupied | Renter-occupied |
| 1 Room | 96 (0.4%) | 2,939 (7.1%) |
| 2 or 3 Rooms | 1,100 (4.0%) | 10,021 (24.1%) |
| 4 or 5 Rooms | 10,290 (37.3%) | 20,039 (48.3%) |
| 6 or 7 Rooms | 9,034 (32.7%) | 7,051 (17.0%) |
| 8 or more Rooms | 7,083 (25.7%) | 1,457 (3.5%) |
| Total | 27,603 (100.0%) | 41,507 (100.0%) |
Housing Structure by Heating Type in Providence
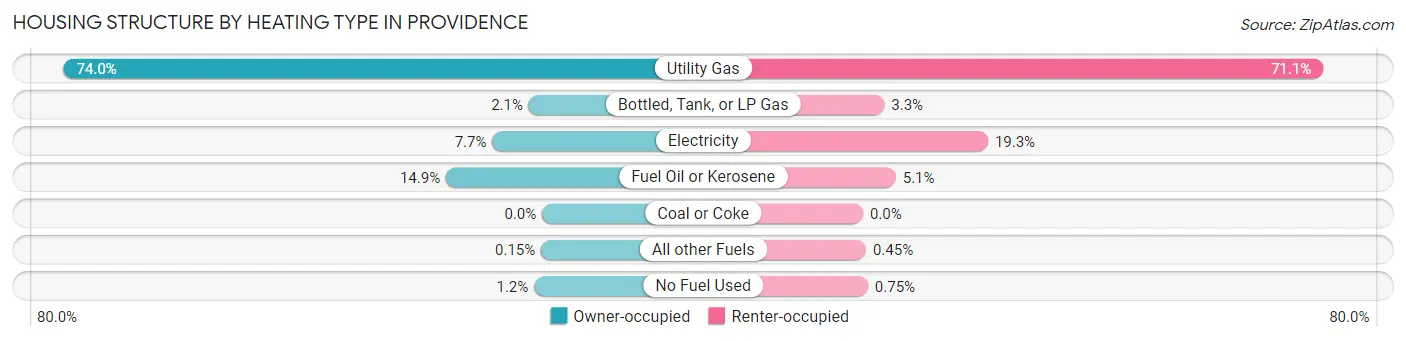
| Heating Type | Owner-occupied | Renter-occupied |
| Utility Gas | 20,424 (74.0%) | 29,526 (71.1%) |
| Bottled, Tank, or LP Gas | 570 (2.1%) | 1,366 (3.3%) |
| Electricity | 2,126 (7.7%) | 8,016 (19.3%) |
| Fuel Oil or Kerosene | 4,102 (14.9%) | 2,101 (5.1%) |
| Coal or Coke | 0 (0.0%) | 0 (0.0%) |
| All other Fuels | 42 (0.2%) | 188 (0.4%) |
| No Fuel Used | 339 (1.2%) | 310 (0.7%) |
| Total | 27,603 (100.0%) | 41,507 (100.0%) |
Household Vehicle Usage in Providence
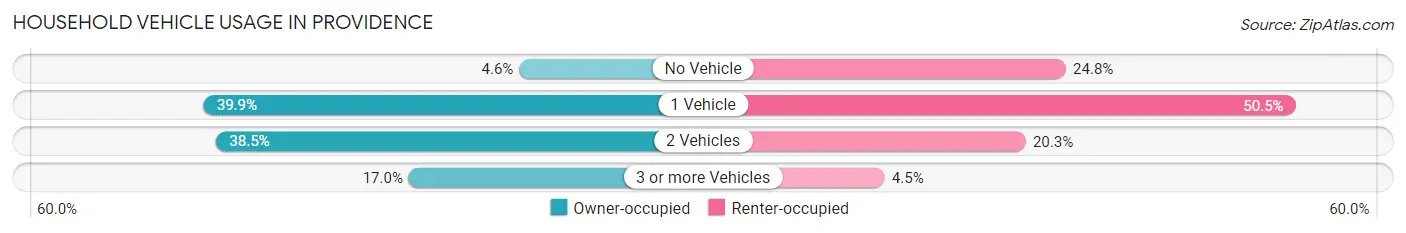
| Vehicles per Household | Owner-occupied | Renter-occupied |
| No Vehicle | 1,269 (4.6%) | 10,287 (24.8%) |
| 1 Vehicle | 11,020 (39.9%) | 20,944 (50.5%) |
| 2 Vehicles | 10,631 (38.5%) | 8,417 (20.3%) |
| 3 or more Vehicles | 4,683 (17.0%) | 1,859 (4.5%) |
| Total | 27,603 (100.0%) | 41,507 (100.0%) |
Real Estate & Mortgages in Providence
Real Estate and Mortgage Overview in Providence
| Characteristic | Without Mortgage | With Mortgage |
| Housing Units | 7,288 | 20,315 |
| Median Property Value | $301,900 | $290,700 |
| Median Household Income | $71,471 | $5,862 |
| Monthly Housing Costs | $799 | $2,968 |
| Real Estate Taxes | $4,258 | $556 |
Property Value by Mortgage Status in Providence
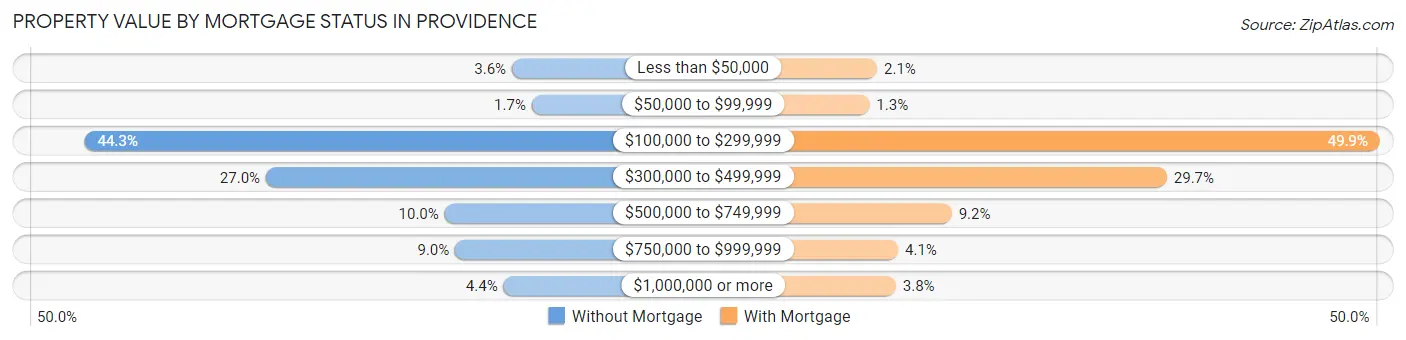
| Property Value | Without Mortgage | With Mortgage |
| Less than $50,000 | 262 (3.6%) | 416 (2.1%) |
| $50,000 to $99,999 | 124 (1.7%) | 268 (1.3%) |
| $100,000 to $299,999 | 3,228 (44.3%) | 10,144 (49.9%) |
| $300,000 to $499,999 | 1,969 (27.0%) | 6,024 (29.6%) |
| $500,000 to $749,999 | 729 (10.0%) | 1,861 (9.2%) |
| $750,000 to $999,999 | 656 (9.0%) | 822 (4.1%) |
| $1,000,000 or more | 320 (4.4%) | 780 (3.8%) |
| Total | 7,288 (100.0%) | 20,315 (100.0%) |
Household Income by Mortgage Status in Providence
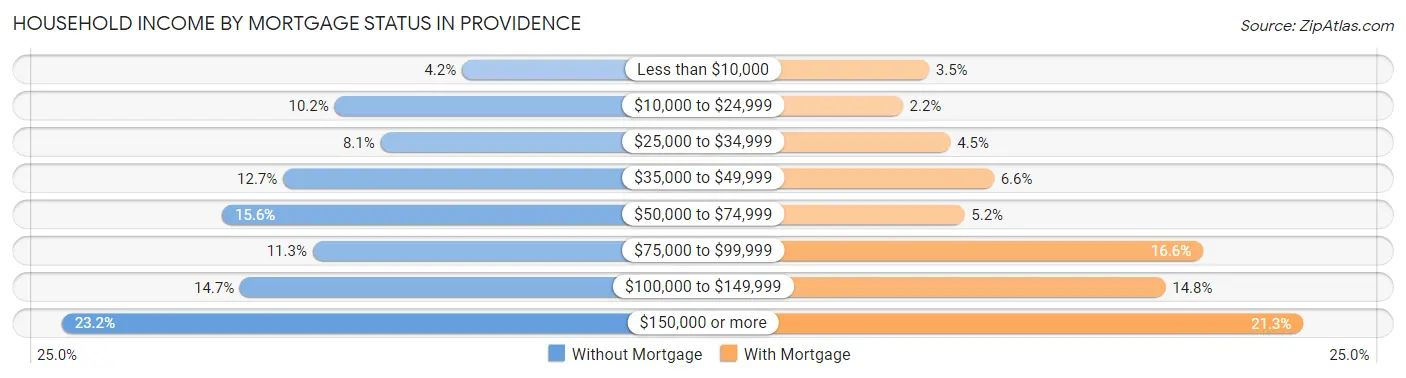
| Household Income | Without Mortgage | With Mortgage |
| Less than $10,000 | 304 (4.2%) | 708 (3.5%) |
| $10,000 to $24,999 | 746 (10.2%) | 456 (2.2%) |
| $25,000 to $34,999 | 587 (8.1%) | 916 (4.5%) |
| $35,000 to $49,999 | 925 (12.7%) | 1,337 (6.6%) |
| $50,000 to $74,999 | 1,137 (15.6%) | 1,053 (5.2%) |
| $75,000 to $99,999 | 822 (11.3%) | 3,363 (16.6%) |
| $100,000 to $149,999 | 1,074 (14.7%) | 2,997 (14.7%) |
| $150,000 or more | 1,693 (23.2%) | 4,331 (21.3%) |
| Total | 7,288 (100.0%) | 20,315 (100.0%) |
Property Value to Household Income Ratio in Providence
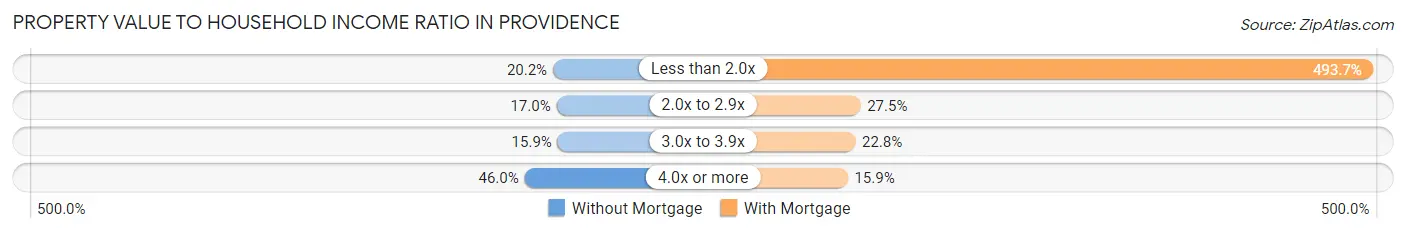
| Value-to-Income Ratio | Without Mortgage | With Mortgage |
| Less than 2.0x | 1,475 (20.2%) | 100,299 (493.7%) |
| 2.0x to 2.9x | 1,241 (17.0%) | 5,595 (27.5%) |
| 3.0x to 3.9x | 1,162 (15.9%) | 4,638 (22.8%) |
| 4.0x or more | 3,354 (46.0%) | 3,238 (15.9%) |
| Total | 7,288 (100.0%) | 20,315 (100.0%) |
Real Estate Taxes by Mortgage Status in Providence
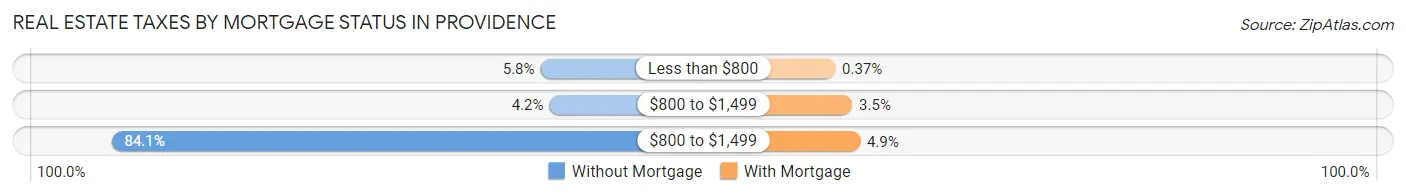
| Property Taxes | Without Mortgage | With Mortgage |
| Less than $800 | 423 (5.8%) | 76 (0.4%) |
| $800 to $1,499 | 303 (4.2%) | 710 (3.5%) |
| $800 to $1,499 | 6,131 (84.1%) | 1,000 (4.9%) |
| Total | 7,288 (100.0%) | 20,315 (100.0%) |
Health & Disability in Providence
Health Insurance Coverage by Age in Providence
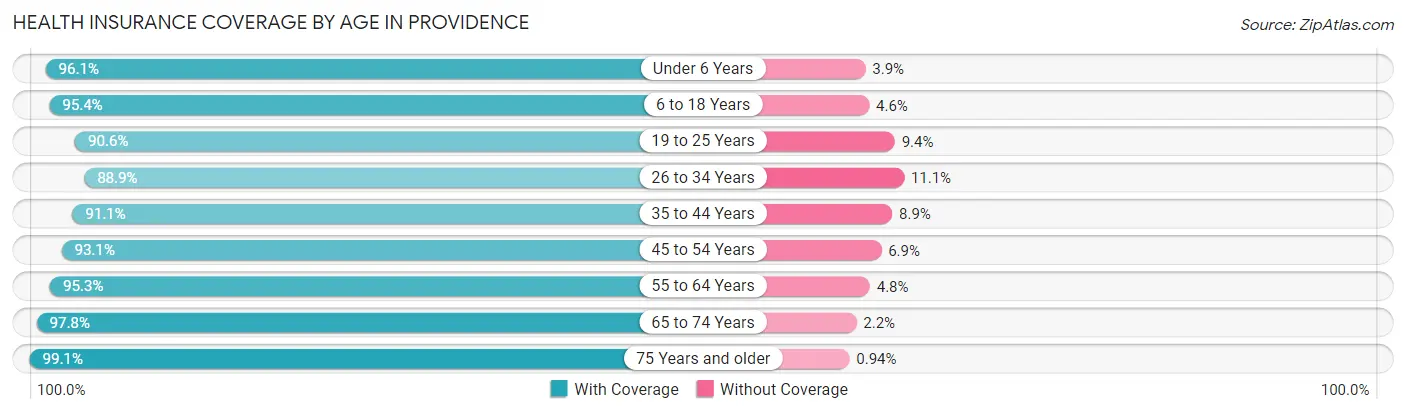
| Age Bracket | With Coverage | Without Coverage |
| Under 6 Years | 12,973 (96.1%) | 530 (3.9%) |
| 6 to 18 Years | 28,936 (95.4%) | 1,404 (4.6%) |
| 19 to 25 Years | 27,873 (90.6%) | 2,896 (9.4%) |
| 26 to 34 Years | 25,522 (88.9%) | 3,192 (11.1%) |
| 35 to 44 Years | 21,117 (91.1%) | 2,066 (8.9%) |
| 45 to 54 Years | 20,209 (93.1%) | 1,496 (6.9%) |
| 55 to 64 Years | 17,377 (95.3%) | 867 (4.8%) |
| 65 to 74 Years | 11,924 (97.8%) | 273 (2.2%) |
| 75 Years and older | 8,438 (99.1%) | 80 (0.9%) |
| Total | 174,369 (93.2%) | 12,804 (6.8%) |
Health Insurance Coverage by Citizenship Status in Providence
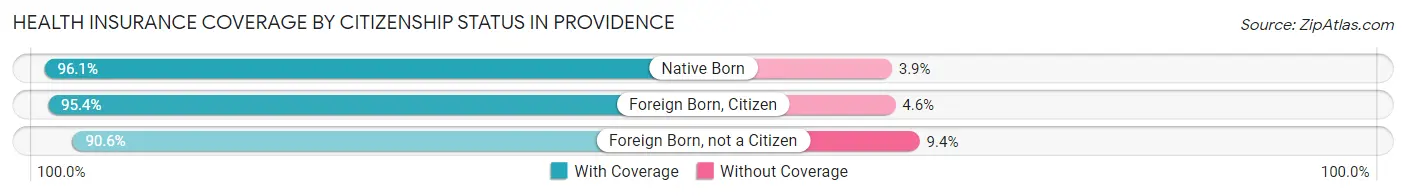
| Citizenship Status | With Coverage | Without Coverage |
| Native Born | 12,973 (96.1%) | 530 (3.9%) |
| Foreign Born, Citizen | 28,936 (95.4%) | 1,404 (4.6%) |
| Foreign Born, not a Citizen | 27,873 (90.6%) | 2,896 (9.4%) |
Health Insurance Coverage by Household Income in Providence

| Household Income | With Coverage | Without Coverage |
| Under $25,000 | 28,569 (95.1%) | 1,458 (4.9%) |
| $25,000 to $49,999 | 26,607 (90.9%) | 2,675 (9.1%) |
| $50,000 to $74,999 | 28,645 (91.2%) | 2,776 (8.8%) |
| $75,000 to $99,999 | 21,842 (92.8%) | 1,701 (7.2%) |
| $100,000 and over | 55,844 (93.8%) | 3,706 (6.2%) |
Public vs Private Health Insurance Coverage by Age in Providence
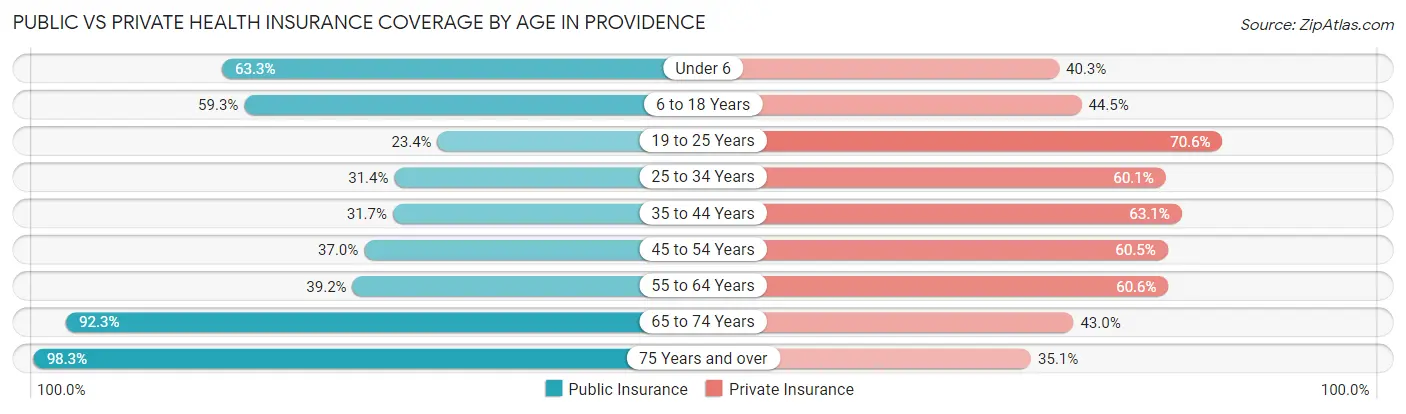
| Age Bracket | Public Insurance | Private Insurance |
| Under 6 | 8,551 (63.3%) | 5,447 (40.3%) |
| 6 to 18 Years | 17,976 (59.3%) | 13,499 (44.5%) |
| 19 to 25 Years | 7,191 (23.4%) | 21,736 (70.6%) |
| 25 to 34 Years | 9,011 (31.4%) | 17,253 (60.1%) |
| 35 to 44 Years | 7,338 (31.7%) | 14,622 (63.1%) |
| 45 to 54 Years | 8,027 (37.0%) | 13,124 (60.5%) |
| 55 to 64 Years | 7,142 (39.2%) | 11,054 (60.6%) |
| 65 to 74 Years | 11,257 (92.3%) | 5,246 (43.0%) |
| 75 Years and over | 8,373 (98.3%) | 2,993 (35.1%) |
| Total | 84,866 (45.3%) | 104,974 (56.1%) |
Disability Status by Sex by Age in Providence
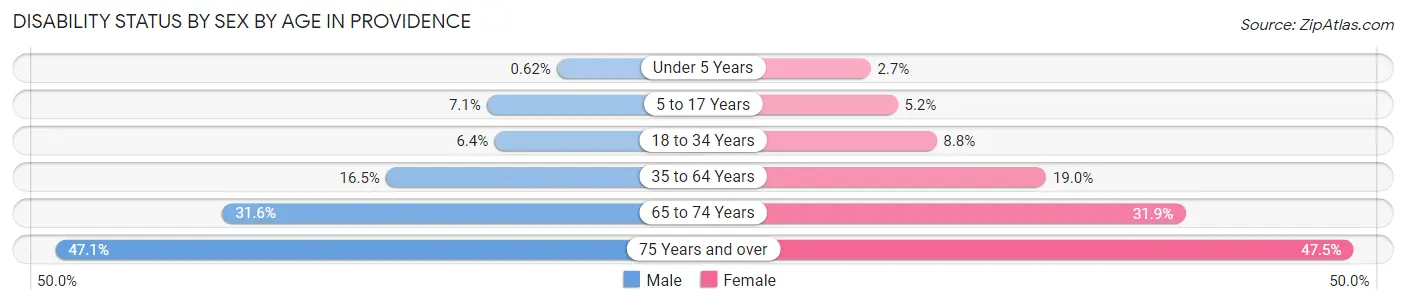
| Age Bracket | Male | Female |
| Under 5 Years | 38 (0.6%) | 129 (2.7%) |
| 5 to 17 Years | 1,004 (7.1%) | 731 (5.2%) |
| 18 to 34 Years | 2,017 (6.4%) | 2,877 (8.8%) |
| 35 to 64 Years | 5,109 (16.5%) | 6,090 (19.0%) |
| 65 to 74 Years | 1,740 (31.6%) | 2,133 (31.9%) |
| 75 Years and over | 1,444 (47.1%) | 2,589 (47.5%) |
Disability Class by Sex by Age in Providence
Disability Class: Hearing Difficulty
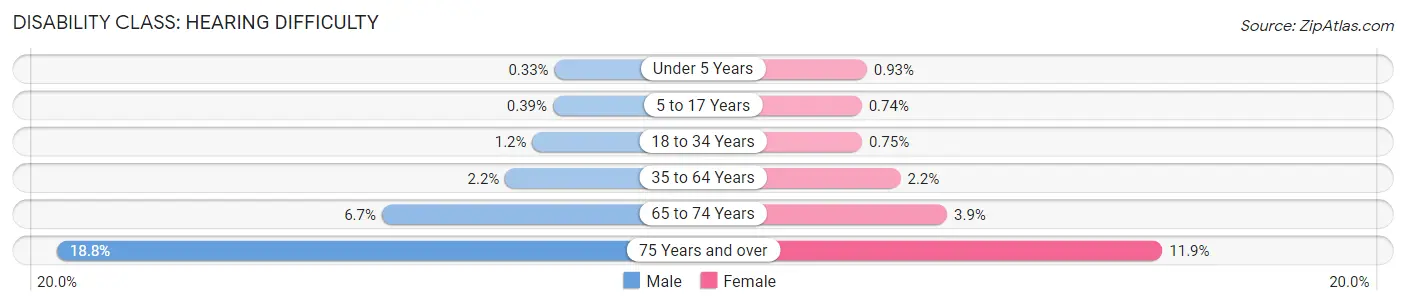
| Age Bracket | Male | Female |
| Under 5 Years | 20 (0.3%) | 45 (0.9%) |
| 5 to 17 Years | 55 (0.4%) | 104 (0.7%) |
| 18 to 34 Years | 361 (1.1%) | 247 (0.7%) |
| 35 to 64 Years | 668 (2.2%) | 700 (2.2%) |
| 65 to 74 Years | 371 (6.7%) | 262 (3.9%) |
| 75 Years and over | 576 (18.8%) | 649 (11.9%) |
Disability Class: Vision Difficulty
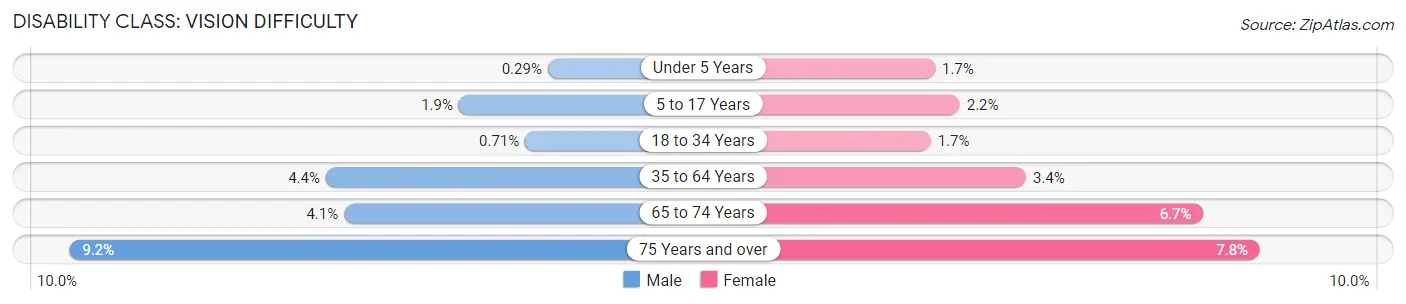
| Age Bracket | Male | Female |
| Under 5 Years | 18 (0.3%) | 84 (1.7%) |
| 5 to 17 Years | 273 (1.9%) | 310 (2.2%) |
| 18 to 34 Years | 224 (0.7%) | 539 (1.7%) |
| 35 to 64 Years | 1,368 (4.4%) | 1,099 (3.4%) |
| 65 to 74 Years | 224 (4.1%) | 449 (6.7%) |
| 75 Years and over | 281 (9.2%) | 423 (7.8%) |
Disability Class: Cognitive Difficulty
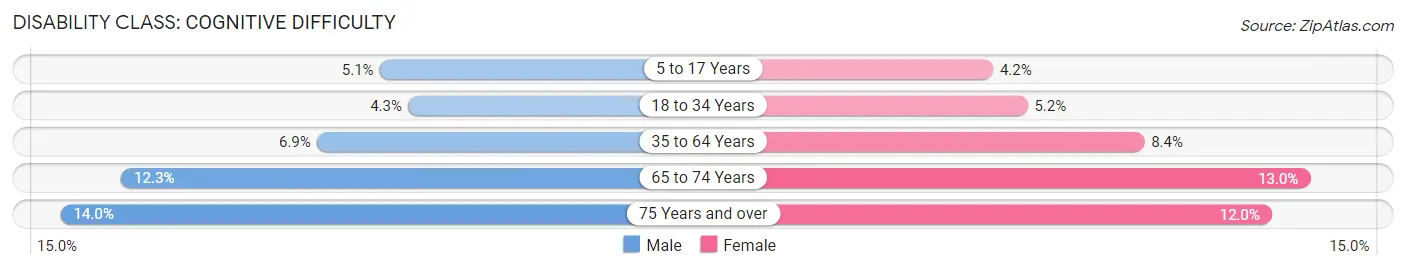
| Age Bracket | Male | Female |
| 5 to 17 Years | 721 (5.1%) | 595 (4.2%) |
| 18 to 34 Years | 1,360 (4.3%) | 1,694 (5.2%) |
| 35 to 64 Years | 2,128 (6.9%) | 2,705 (8.4%) |
| 65 to 74 Years | 677 (12.3%) | 873 (13.0%) |
| 75 Years and over | 429 (14.0%) | 653 (12.0%) |
Disability Class: Ambulatory Difficulty
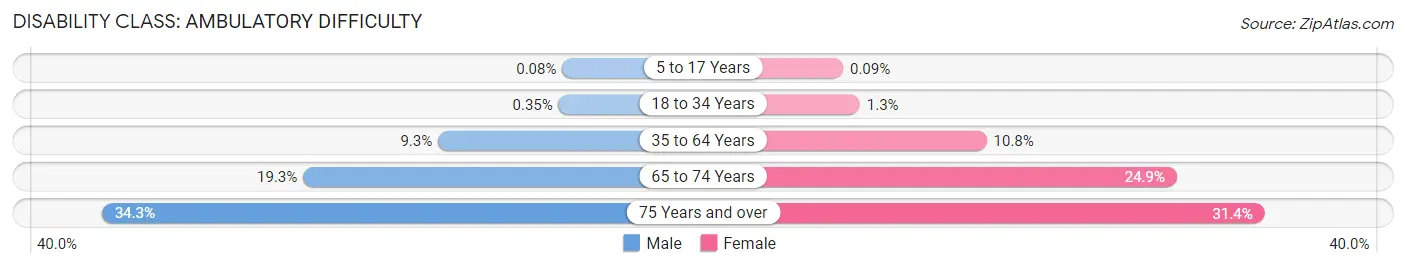
| Age Bracket | Male | Female |
| 5 to 17 Years | 11 (0.1%) | 13 (0.1%) |
| 18 to 34 Years | 110 (0.4%) | 440 (1.3%) |
| 35 to 64 Years | 2,882 (9.3%) | 3,454 (10.7%) |
| 65 to 74 Years | 1,063 (19.3%) | 1,665 (24.9%) |
| 75 Years and over | 1,050 (34.3%) | 1,712 (31.4%) |
Disability Class: Self-Care Difficulty
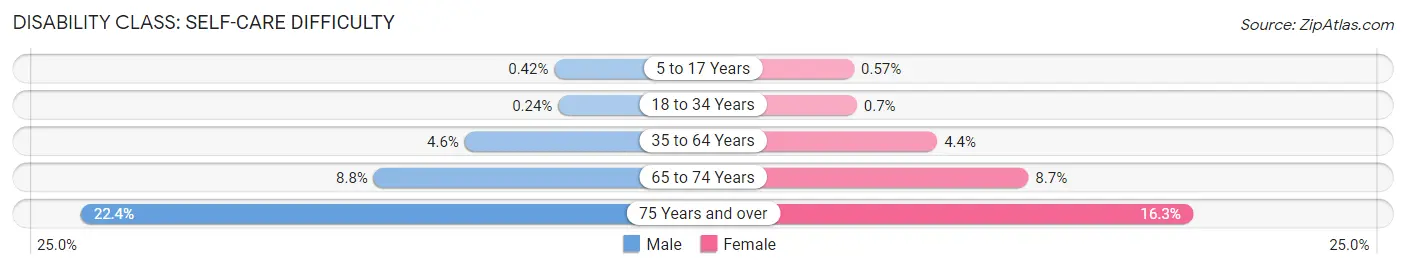
| Age Bracket | Male | Female |
| 5 to 17 Years | 59 (0.4%) | 80 (0.6%) |
| 18 to 34 Years | 74 (0.2%) | 228 (0.7%) |
| 35 to 64 Years | 1,420 (4.6%) | 1,424 (4.4%) |
| 65 to 74 Years | 484 (8.8%) | 580 (8.7%) |
| 75 Years and over | 686 (22.4%) | 888 (16.3%) |
Technology Access in Providence
Computing Device Access in Providence
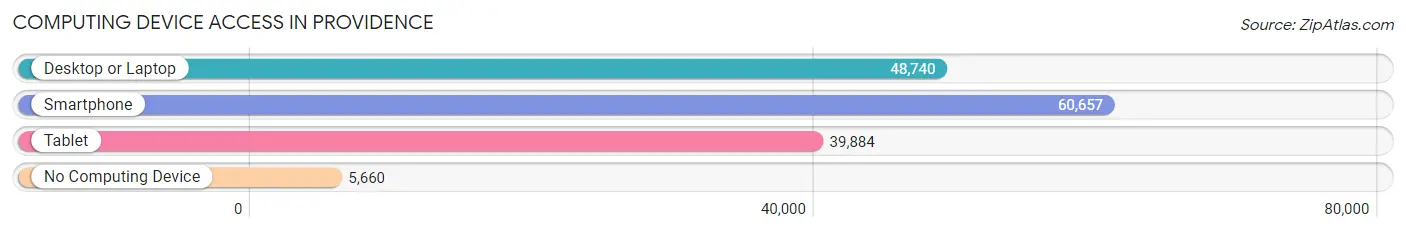
| Device Type | # Households | % Households |
| Desktop or Laptop | 48,740 | 70.5% |
| Smartphone | 60,657 | 87.8% |
| Tablet | 39,884 | 57.7% |
| No Computing Device | 5,660 | 8.2% |
| Total | 69,110 | 100.0% |
Internet Access in Providence
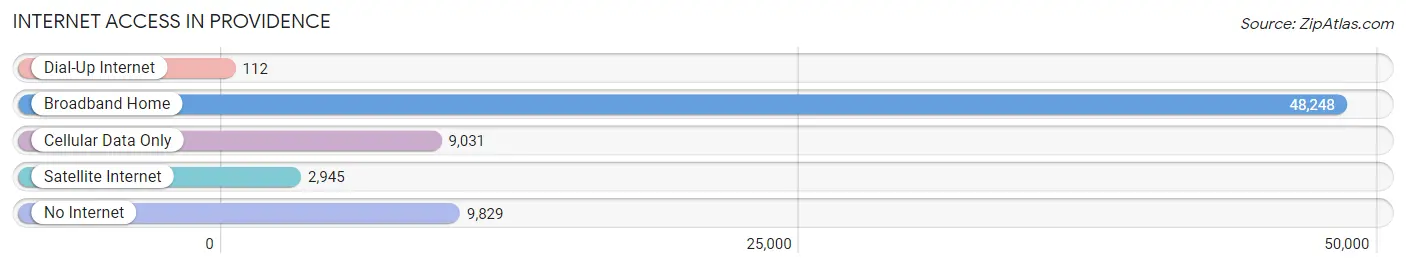
| Internet Type | # Households | % Households |
| Dial-Up Internet | 112 | 0.2% |
| Broadband Home | 48,248 | 69.8% |
| Cellular Data Only | 9,031 | 13.1% |
| Satellite Internet | 2,945 | 4.3% |
| No Internet | 9,829 | 14.2% |
| Total | 69,110 | 100.0% |
Providence Summary
Providence, Rhode Island is the capital and most populous city in the state. It is located in Providence County and is the third largest city in New England. The city has a rich history, diverse geography, and a vibrant economy.
History
Providence was founded in 1636 by Roger Williams, a religious dissenter who had been banished from the Massachusetts Bay Colony. Williams named the city in honor of “God’s merciful Providence” which he believed had guided him there. The city was one of the first cities to be established in the New World and was an important center of trade and commerce in the 18th and 19th centuries.
The city was the site of the first Baptist church in America, founded by Williams in 1638. It was also the site of the first public library in America, founded in 1753. Providence was an important center of the American Revolution and was the first city to declare independence from Britain in 1776.
The city was an important center of the Industrial Revolution and was home to many of the nation’s first factories. It was also an important center of the abolitionist movement and was home to many of the nation’s first African-American churches.
Geography
Providence is located in the northeastern part of the state of Rhode Island. It is situated at the head of Narragansett Bay and is bordered by the cities of Cranston, Warwick, and Pawtucket. The city is located on the Providence River and is home to numerous parks and green spaces.
The city has a total area of 18.5 square miles and is divided into 25 neighborhoods. The city is home to numerous hills, rivers, and lakes, including the Woonasquatucket River, Moshassuck River, and Seekonk River.
Economy
Providence has a diverse economy that is driven by education, healthcare, finance, and tourism. The city is home to several major universities, including Brown University, Rhode Island School of Design, and Providence College. It is also home to several major hospitals, including Rhode Island Hospital and Women & Infants Hospital.
The city is home to several major financial institutions, including Bank of America, Citizens Bank, and Fidelity Investments. Tourism is also an important part of the city’s economy, with numerous attractions, including the Rhode Island State House, Roger Williams Park Zoo, and WaterFire Providence.
Demographics
As of the 2010 census, Providence had a population of 178,042. The city has a diverse population, with the largest ethnic groups being White (54.3%), Hispanic or Latino (25.7%), and Black or African American (14.1%). The city also has a large immigrant population, with the largest groups being from the Dominican Republic (7.2%), Haiti (3.2%), and China (2.2%).
The median household income in Providence is $41,919 and the median home value is $204,400. The city has a poverty rate of 24.3%, which is higher than the national average. The city also has a high unemployment rate of 8.2%.
Conclusion
Providence, Rhode Island is a vibrant city with a rich history, diverse geography, and a diverse economy. The city is home to numerous universities, hospitals, and financial institutions, as well as numerous attractions. The city has a diverse population and a high poverty rate. Despite these challenges, Providence is a vibrant city with a bright future.
Common Questions
What is the Total Population of Providence?
Total Population of Providence is 189,715.
What is the Total Male Population of Providence?
Total Male Population of Providence is 91,997.
What is the Total Female Population of Providence?
Total Female Population of Providence is 97,718.
What is the Ratio of Males per 100 Females in Providence?
There are 94.15 Males per 100 Females in Providence.
What is the Ratio of Females per 100 Males in Providence?
There are 106.22 Females per 100 Males in Providence.
What is the Median Population Age in Providence?
Median Population Age in Providence is 32.3 Years.
What is the Average Family Size in Providence
Average Family Size in Providence is 3.3 People.
What is the Average Household Size in Providence
Average Household Size in Providence is 2.5 People.
What is Per Capita Income in Providence?
Per Capita income in Providence is $34,521.
What is the Median Family Income in Providence?
Median Family Income in Providence is $71,737.
What is the Median Household income in Providence?
Median Household Income in Providence is $61,365.
What is Income or Wage Gap in Providence?
Income or Wage Gap in Providence is 22.4%.
Women in Providence earn 77.6 cents for every dollar earned by a man.
What is Family Income Deficit in Providence?
Family Income Deficit in Providence is $11,534.
Families that are below poverty line in Providence earn $11,534 less on average than the poverty threshold level.
What is Inequality or Gini Index in Providence?
Inequality or Gini Index in Providence is 0.51.
How Large is the Labor Force in Providence?
There are 97,845 People in the Labor Forcein in Providence.
What is the Percentage of People in the Labor Force in Providence?
63.1% of People are in the Labor Force in Providence.
What is the Unemployment Rate in Providence?
Unemployment Rate in Providence is 7.2%.