Chilean vs Immigrants from Northern Africa 4 or more Vehicles in Household
COMPARE
Chilean
Immigrants from Northern Africa
4 or more Vehicles in Household
4 or more Vehicles in Household Comparison
Chileans
Immigrants from Northern Africa
6.4%
4 OR MORE VEHICLES IN HOUSEHOLD
61.2/ 100
METRIC RATING
163rd/ 347
METRIC RANK
5.6%
4 OR MORE VEHICLES IN HOUSEHOLD
1.4/ 100
METRIC RATING
257th/ 347
METRIC RANK
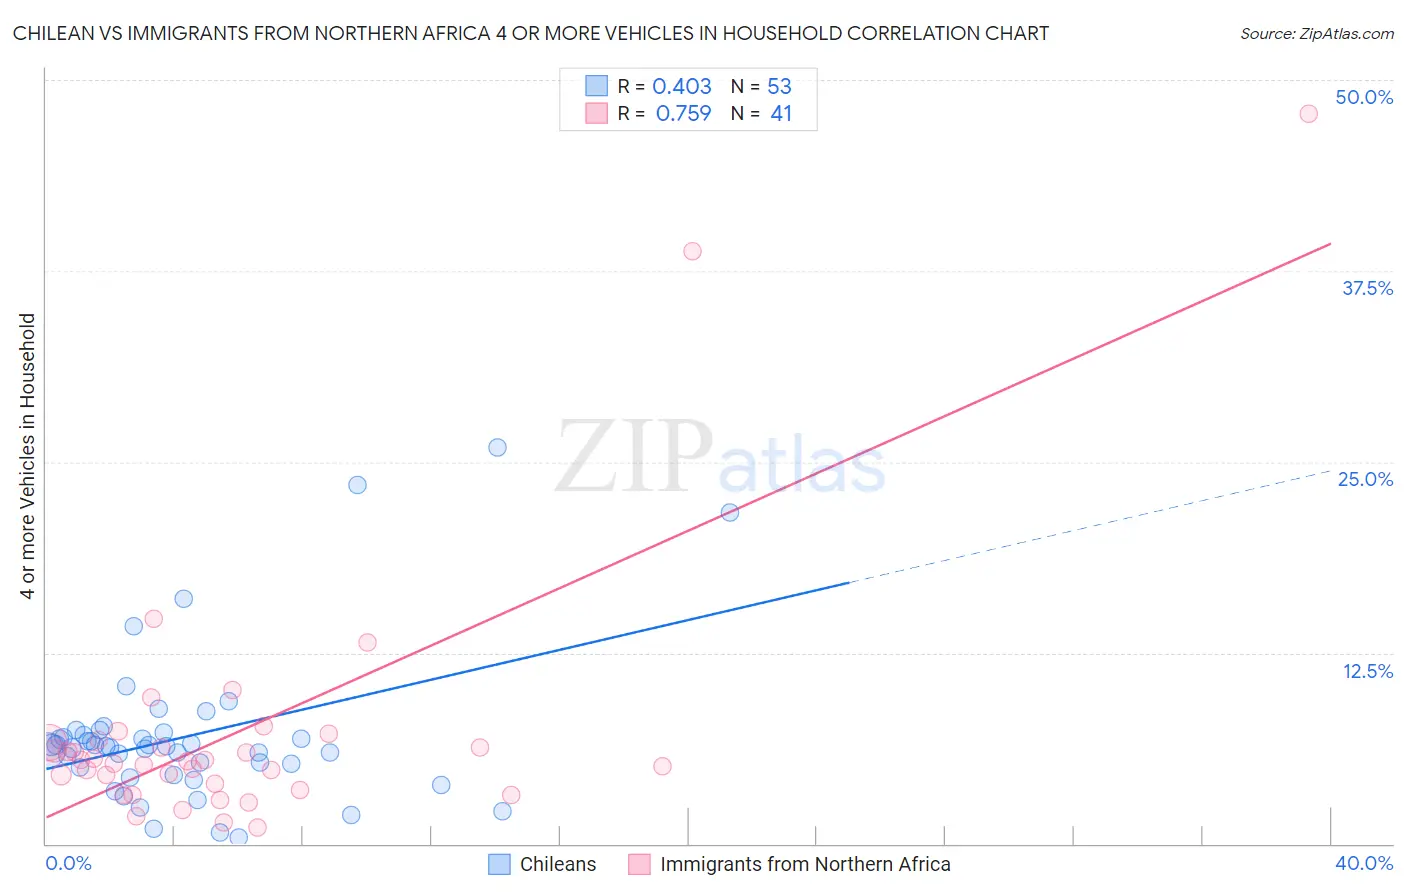
Chilean vs Immigrants from Northern Africa 4 or more Vehicles in Household Correlation Chart
The statistical analysis conducted on geographies consisting of 255,549,782 people shows a moderate positive correlation between the proportion of Chileans and percentage of households with 4 or more vehicles available in the United States with a correlation coefficient (R) of 0.403 and weighted average of 6.4%. Similarly, the statistical analysis conducted on geographies consisting of 319,847,257 people shows a strong positive correlation between the proportion of Immigrants from Northern Africa and percentage of households with 4 or more vehicles available in the United States with a correlation coefficient (R) of 0.759 and weighted average of 5.6%, a difference of 13.3%.
4 or more Vehicles in Household Correlation Summary
| Measurement | Chilean | Immigrants from Northern Africa |
| Minimum | 0.37% | 1.1% |
| Maximum | 25.9% | 47.8% |
| Range | 25.6% | 46.7% |
| Mean | 7.0% | 7.3% |
| Median | 6.4% | 5.4% |
| Interquartile 25% (IQ1) | 4.8% | 3.7% |
| Interquartile 75% (IQ3) | 7.2% | 6.7% |
| Interquartile Range (IQR) | 2.4% | 3.0% |
| Standard Deviation (Sample) | 5.0% | 8.7% |
| Standard Deviation (Population) | 4.9% | 8.6% |
Similar Demographics by 4 or more Vehicles in Household
Demographics Similar to Chileans by 4 or more Vehicles in Household
In terms of 4 or more vehicles in household, the demographic groups most similar to Chileans are Hungarian (6.4%, a difference of 0.010%), Immigrants from Peru (6.4%, a difference of 0.14%), Immigrants from Pakistan (6.4%, a difference of 0.22%), Immigrants from Cameroon (6.4%, a difference of 0.34%), and Immigrants from Denmark (6.4%, a difference of 0.35%).
| Demographics | Rating | Rank | 4 or more Vehicles in Household |
| Iranians | 69.9 /100 | #156 | Good 6.5% |
| Peruvians | 69.4 /100 | #157 | Good 6.5% |
| Zimbabweans | 67.1 /100 | #158 | Good 6.4% |
| Indians (Asian) | 66.3 /100 | #159 | Good 6.4% |
| Palestinians | 65.8 /100 | #160 | Good 6.4% |
| Immigrants | Cameroon | 64.4 /100 | #161 | Good 6.4% |
| Immigrants | Pakistan | 63.2 /100 | #162 | Good 6.4% |
| Chileans | 61.2 /100 | #163 | Good 6.4% |
| Hungarians | 61.1 /100 | #164 | Good 6.4% |
| Immigrants | Peru | 59.8 /100 | #165 | Average 6.4% |
| Immigrants | Denmark | 57.8 /100 | #166 | Average 6.4% |
| Poles | 56.9 /100 | #167 | Average 6.4% |
| Lebanese | 55.8 /100 | #168 | Average 6.4% |
| Estonians | 55.1 /100 | #169 | Average 6.4% |
| Immigrants | Syria | 52.8 /100 | #170 | Average 6.3% |
Demographics Similar to Immigrants from Northern Africa by 4 or more Vehicles in Household
In terms of 4 or more vehicles in household, the demographic groups most similar to Immigrants from Northern Africa are Immigrants from Turkey (5.7%, a difference of 0.080%), Yup'ik (5.7%, a difference of 0.12%), Immigrants from Lithuania (5.6%, a difference of 0.14%), Immigrants from France (5.6%, a difference of 0.17%), and Immigrants from Panama (5.7%, a difference of 0.20%).
| Demographics | Rating | Rank | 4 or more Vehicles in Household |
| Immigrants | Europe | 2.3 /100 | #250 | Tragic 5.7% |
| Ugandans | 2.2 /100 | #251 | Tragic 5.7% |
| Sub-Saharan Africans | 2.1 /100 | #252 | Tragic 5.7% |
| Immigrants | Cuba | 1.6 /100 | #253 | Tragic 5.7% |
| Immigrants | Panama | 1.5 /100 | #254 | Tragic 5.7% |
| Yup'ik | 1.5 /100 | #255 | Tragic 5.7% |
| Immigrants | Turkey | 1.5 /100 | #256 | Tragic 5.7% |
| Immigrants | Northern Africa | 1.4 /100 | #257 | Tragic 5.6% |
| Immigrants | Lithuania | 1.4 /100 | #258 | Tragic 5.6% |
| Immigrants | France | 1.3 /100 | #259 | Tragic 5.6% |
| Uruguayans | 1.3 /100 | #260 | Tragic 5.6% |
| Sudanese | 1.2 /100 | #261 | Tragic 5.6% |
| Bermudans | 1.2 /100 | #262 | Tragic 5.6% |
| Immigrants | Saudi Arabia | 1.1 /100 | #263 | Tragic 5.6% |
| Immigrants | Africa | 1.0 /100 | #264 | Tragic 5.6% |