Zip Codes with the Highest Poverty Level Among Children Under the Age of 5 in Dallas, TX

RELATED REPORTS & OPTIONS

Highest Poverty | Child 0-5
Population
Families and Households
Female Fertility
Female Fertility (Unmarried)
Race (Community Size)
Race (Percentage)
Ancestry (Community Size)
AfghanAfricanAlaska NativeAlbanianAlsatianAmericanApacheArabArgentineanArmenianAssyrian / Chaldean / SyriacAustralianAustrianBahamianBangladeshiBarbadianBasqueBelgianBelizeanBhutaneseBlackfeetBolivianBrazilianBritishBritish West IndianBulgarianBurmeseCajunCambodianCanadianCape VerdeanCelticCentral AmericanCentral American IndianCherokeeChickasawChileanChippewaChoctawColombianComancheCosta RicanCreekCroatianCubanCypriotCzechCzechoslovakianDanishDominicanDutchDutch West IndianEastern EuropeanEcuadorianEgyptianEnglishEstonianEthiopianEuropeanFilipinoFinnishFrenchFrench CanadianGermanGhanaianGreekGuamanian / ChamorroGuatemalanGuyaneseHaitianHonduranHungarianIcelanderIndian (Asian)IndonesianIranianIraqiIrishIroquoisIsraeliItalianJamaicanJapaneseJordanianKenyanKoreanLaotianLatvianLebaneseLiberianLithuanianLuxembourgerMalaysianMalteseMexicanMexican American IndianMongolianMoroccanNative HawaiianNavajoNew ZealanderNicaraguanNigerianNorthern EuropeanNorwegianOkinawanOsagePakistaniPalestinianPanamanianParaguayanPennsylvania GermanPeruvianPolishPortuguesePotawatomiPuebloPuerto RicanRomanianRussianSalvadoranSamoanScandinavianScotch-IrishScottishSeminoleSenegaleseSerbianSierra LeoneanSiouxSlavicSlovakSloveneSomaliSouth AfricanSouth AmericanSouth American IndianSpaniardSpanishSpanish AmericanSpanish American IndianSri LankanSubsaharan AfricanSudaneseSwedishSwissSyrianThaiTohono O'OdhamTonganTrinidadian and TobagonianTurkishUgandanUkrainianUruguayanVenezuelanVietnameseWelshWest IndianYaquiYugoslavianZimbabwean
Ancestry (Percentage)
AfghanAfricanAlaska NativeAlbanianAlsatianAmericanApacheArabArgentineanArmenianAssyrian / Chaldean / SyriacAustralianAustrianBahamianBangladeshiBarbadianBasqueBelgianBelizeanBhutaneseBlackfeetBolivianBrazilianBritishBritish West IndianBulgarianBurmeseCajunCambodianCanadianCape VerdeanCelticCentral AmericanCentral American IndianCherokeeChickasawChileanChippewaChoctawColombianComancheCosta RicanCreekCroatianCubanCypriotCzechCzechoslovakianDanishDominicanDutchDutch West IndianEastern EuropeanEcuadorianEgyptianEnglishEstonianEthiopianEuropeanFilipinoFinnishFrenchFrench CanadianGermanGhanaianGreekGuamanian / ChamorroGuatemalanGuyaneseHaitianHonduranHungarianIcelanderIndian (Asian)IndonesianIranianIraqiIrishIroquoisIsraeliItalianJamaicanJapaneseJordanianKenyanKoreanLaotianLatvianLebaneseLiberianLithuanianLuxembourgerMalaysianMalteseMexicanMexican American IndianMongolianMoroccanNative HawaiianNavajoNew ZealanderNicaraguanNigerianNorthern EuropeanNorwegianOkinawanOsagePakistaniPalestinianPanamanianParaguayanPennsylvania GermanPeruvianPolishPortuguesePotawatomiPuebloPuerto RicanRomanianRussianSalvadoranSamoanScandinavianScotch-IrishScottishSeminoleSenegaleseSerbianSierra LeoneanSiouxSlavicSlovakSloveneSomaliSouth AfricanSouth AmericanSouth American IndianSpaniardSpanishSpanish AmericanSpanish American IndianSri LankanSubsaharan AfricanSudaneseSwedishSwissSyrianThaiTohono O'OdhamTonganTrinidadian and TobagonianTurkishUgandanUkrainianUruguayanVenezuelanVietnameseWelshWest IndianYaquiYugoslavianZimbabwean
Immigrant Origin (Total)
AfghanistanAfricaAlbaniaArgentinaArmeniaAsiaAustraliaAustriaBahamasBangladeshBelarusBelgiumBelizeBoliviaBosnia and HerzegovinaBrazilBulgariaBurma / MyanmarCambodiaCameroonCanadaCaribbeanCentral AmericaChileChinaColombiaCongoCosta RicaCroatiaCubaCzechoslovakiaDenmarkDominicaDominican RepublicEastern AfricaEastern AsiaEastern EuropeEcuadorEgyptEl SalvadorEnglandEritreaEthiopiaEuropeFijiFranceGermanyGhanaGreeceGuatemalaGuyanaHaitiHondurasHong KongHungaryIndiaIndonesiaIranIraqIrelandIsraelItalyJamaicaJapanJordanKazakhstanKenyaKoreaKuwaitLaosLatin AmericaLatviaLebanonLiberiaMalaysiaMexicoMiddle AfricaMoldovaMoroccoNepalNetherlandsNicaraguaNigeriaNorthern AfricaNorthern EuropeNorwayOceaniaPakistanPanamaPeruPhilippinesPolandPortugalRomaniaRussiaSaudi ArabiaScotlandSenegalSerbiaSierra LeoneSingaporeSomaliaSouth AfricaSouth AmericaSouth Central AsiaSouth Eastern AsiaSouthern EuropeSpainSri LankaSudanSwedenSwitzerlandSyriaTaiwanThailandTrinidad and TobagoTurkeyUgandaUkraineUruguayUzbekistanVenezuelaVietnamWest IndiesWestern AfricaWestern AsiaWestern EuropeYemenZaireZimbabwe
Immigrant Origin (Percentage)
AfghanistanAfricaAlbaniaArgentinaArmeniaAsiaAustraliaAustriaBahamasBangladeshBelarusBelgiumBelizeBoliviaBosnia and HerzegovinaBrazilBulgariaBurma / MyanmarCambodiaCameroonCanadaCaribbeanCentral AmericaChileChinaColombiaCongoCosta RicaCroatiaCubaCzechoslovakiaDenmarkDominicaDominican RepublicEastern AfricaEastern AsiaEastern EuropeEcuadorEgyptEl SalvadorEnglandEritreaEthiopiaEuropeFijiFranceGermanyGhanaGreeceGuatemalaGuyanaHaitiHondurasHong KongHungaryIndiaIndonesiaIranIraqIrelandIsraelItalyJamaicaJapanJordanKazakhstanKenyaKoreaKuwaitLaosLatin AmericaLatviaLebanonLiberiaMalaysiaMexicoMiddle AfricaMoldovaMoroccoNepalNetherlandsNicaraguaNigeriaNorthern AfricaNorthern EuropeNorwayOceaniaPakistanPanamaPeruPhilippinesPolandPortugalRomaniaRussiaSaudi ArabiaScotlandSenegalSerbiaSierra LeoneSingaporeSomaliaSouth AfricaSouth AmericaSouth Central AsiaSouth Eastern AsiaSouthern EuropeSpainSri LankaSudanSwedenSwitzerlandSyriaTaiwanThailandTrinidad and TobagoTurkeyUgandaUkraineUruguayUzbekistanVenezuelaVietnamWest IndiesWestern AfricaWestern AsiaWestern EuropeYemenZaireZimbabwe
Income
Income (Families)
Income (Households)
Poverty
Poverty (Families)
Unemployment
Employment Occupations
Employment Industries
Employer Class
Commute Time
Commute Means
School Enrollment
Education by Degree Field
Occupancy
Finances
Physical Characteristics
Dallas
Compare Zip Codes
Comparison Subject

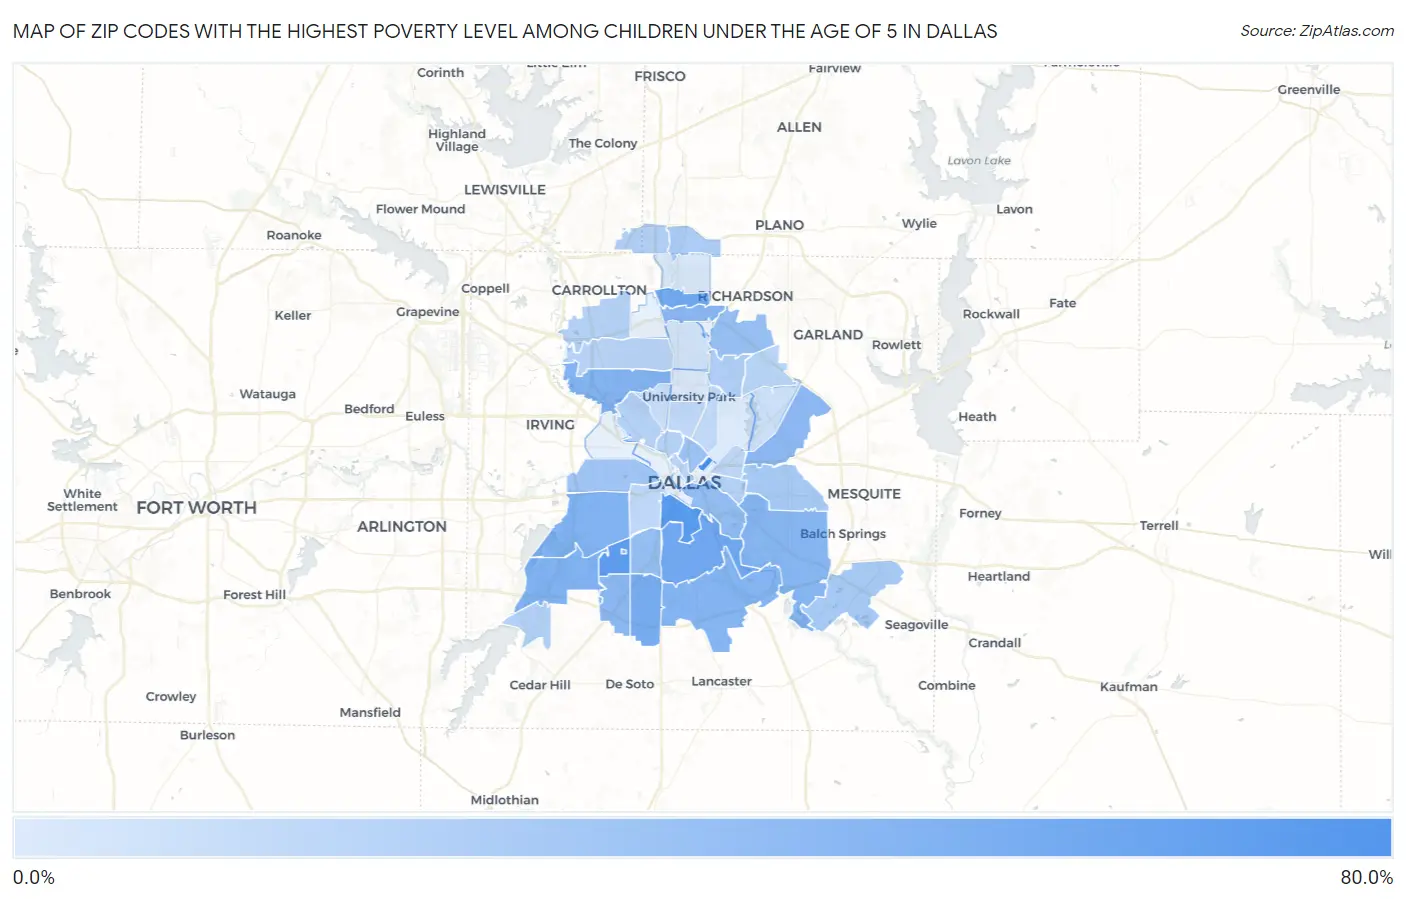
Map of Zip Codes with the Highest Poverty Level Among Children Under the Age of 5 in Dallas

0.0%
80.0%
Zip Codes with the Highest Poverty Level Among Children Under the Age of 5 in Dallas Map

Zip Codes with the Highest Poverty Level Among Children Under the Age of 5 in Dallas, TX

Zip Code Child Poverty vs State vs National
1.7524668.7%21.1%(+47.6)#5518.1%(+50.6)#1,204
2.7520359.3%21.1%(+38.2)#8818.1%(+41.2)#1,743
3.7523355.6%21.1%(+34.5)#10818.1%(+37.6)#2,015
4.7521646.8%21.1%(+25.7)#16518.1%(+28.7)#2,953
5.7525444.8%21.1%(+23.7)#17918.1%(+26.8)#3,199
6.7523242.3%21.1%(+21.2)#20918.1%(+24.3)#3,604
7.7523638.6%21.1%(+17.5)#28118.1%(+20.5)#4,284
8.7521138.1%21.1%(+17.0)#28618.1%(+20.0)#4,397
9.7522036.8%21.1%(+15.7)#30618.1%(+18.7)#4,639
10.7524135.9%21.1%(+14.8)#31818.1%(+17.8)#4,856
11.7521735.5%21.1%(+14.4)#32918.1%(+17.4)#4,961
12.7524034.3%21.1%(+13.2)#34618.1%(+16.3)#5,223
13.7522832.8%21.1%(+11.7)#37818.1%(+14.8)#5,633
14.7523732.7%21.1%(+11.6)#38218.1%(+14.6)#5,673
15.7521529.4%21.1%(+8.33)#46118.1%(+11.3)#6,522
16.7522428.9%21.1%(+7.82)#47718.1%(+10.8)#6,679
17.7524327.8%21.1%(+6.70)#50618.1%(+9.72)#7,022
18.7520427.3%21.1%(+6.20)#52618.1%(+9.22)#7,209
19.7521223.6%21.1%(+2.47)#62118.1%(+5.49)#8,551
20.7522721.0%21.1%(-0.043)#68718.1%(+2.98)#9,581
21.7525321.0%21.1%(-0.085)#68918.1%(+2.94)#9,597
22.7525219.3%21.1%(-1.77)#73418.1%(+1.25)#10,351
23.7523117.2%21.1%(-3.86)#79018.1%(-0.838)#11,323
24.7528716.5%21.1%(-4.61)#80918.1%(-1.58)#11,655
25.7521916.4%21.1%(-4.69)#81218.1%(-1.66)#11,695
26.7524916.4%21.1%(-4.71)#81518.1%(-1.68)#11,702
27.7521016.1%21.1%(-4.94)#82518.1%(-1.92)#11,836
28.7523515.7%21.1%(-5.36)#84518.1%(-2.33)#12,063
29.7523415.5%21.1%(-5.63)#85718.1%(-2.61)#12,188
30.7522914.4%21.1%(-6.71)#89318.1%(-3.68)#12,790
31.7520113.5%21.1%(-7.60)#92318.1%(-4.57)#13,329
32.7523813.5%21.1%(-7.62)#92518.1%(-4.60)#13,345
33.7522312.4%21.1%(-8.71)#96018.1%(-5.69)#13,985
34.7520811.4%21.1%(-9.72)#1,00418.1%(-6.70)#14,605
35.7520511.4%21.1%(-9.73)#1,00518.1%(-6.71)#14,608
36.7520610.6%21.1%(-10.5)#1,03618.1%(-7.49)#15,078
37.752097.3%21.1%(-13.8)#1,14518.1%(-10.8)#17,190
38.752186.1%21.1%(-15.0)#1,19218.1%(-12.0)#18,001
39.752305.1%21.1%(-16.0)#1,22318.1%(-12.9)#18,673
40.752482.5%21.1%(-18.6)#1,31318.1%(-15.6)#20,520
41.752251.4%21.1%(-19.7)#1,34218.1%(-16.7)#21,196
42.752140.76%21.1%(-20.3)#1,35118.1%(-17.3)#21,516

Common Questions

What are the Top 10 Zip Codes with the Highest Poverty Level Among Children Under the Age of 5 in Dallas, TX?
Top 10 Zip Codes with the Highest Poverty Level Among Children Under the Age of 5 in Dallas, TX are:
#1
68.7%
#2
59.3%
#3
55.6%
#4
46.8%
#5
44.8%
#6
42.3%
#7
38.6%
#8
38.1%
#9
36.8%
#10
35.9%
What zip code has the Highest Poverty Level Among Children Under the Age of 5 in Dallas, TX?
75246 has the Highest Poverty Level Among Children Under the Age of 5 in Dallas, TX with 68.7%.
What is the Poverty Level Among Children Under the Age of 5 in Dallas, TX?
Poverty Level Among Children Under the Age of 5 in Dallas is 26.2%.
What is the Poverty Level Among Children Under the Age of 5 in Texas?
Poverty Level Among Children Under the Age of 5 in Texas is 21.1%.
What is the Poverty Level Among Children Under the Age of 5 in the United States?
Poverty Level Among Children Under the Age of 5 in the United States is 18.1%.