Zip Codes with the Highest Percentage of Households Without a Vehicle in Dallas, TX
RELATED REPORTS & OPTIONS
Households without a Cars
Dallas
Compare Zip Codes
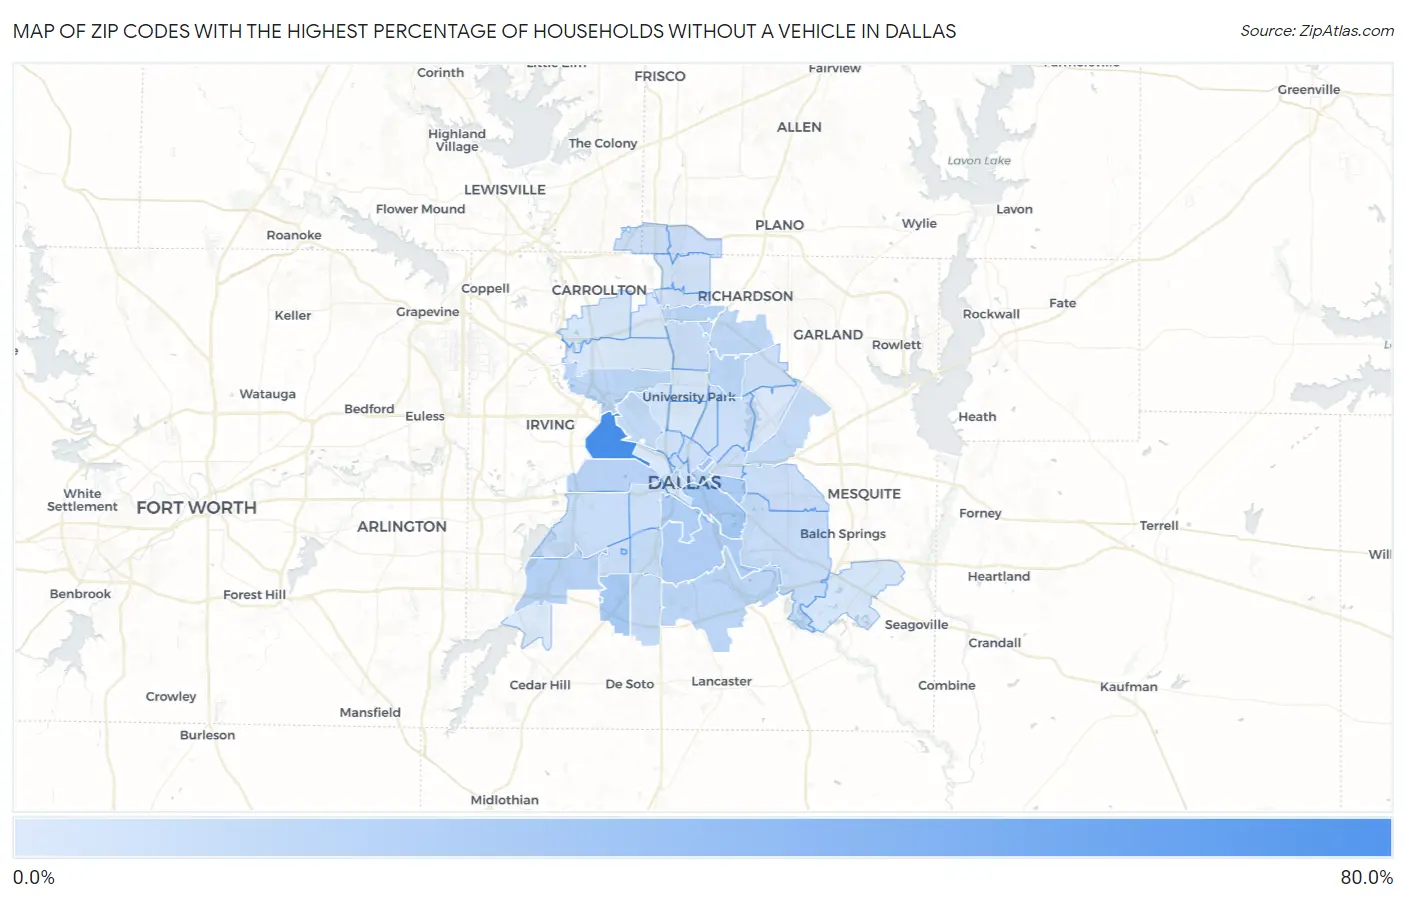
Map of Zip Codes with the Highest Percentage of Households Without a Vehicle in Dallas
0.0%
80.0%
Zip Codes with the Highest Percentage of Households Without a Vehicle in Dallas, TX
| Zip Code | Housholds Without a Car | vs State | vs National | |
| 1. | 75247 | 63.6% | 5.3%(+58.3)#2 | 8.3%(+55.3)#243 |
| 2. | 75246 | 21.8% | 5.3%(+16.5)#30 | 8.3%(+13.5)#1,318 |
| 3. | 75215 | 20.3% | 5.3%(+15.0)#32 | 8.3%(+12.0)#1,465 |
| 4. | 75237 | 20.1% | 5.3%(+14.8)#33 | 8.3%(+11.8)#1,486 |
| 5. | 75210 | 17.8% | 5.3%(+12.5)#49 | 8.3%(+9.50)#1,819 |
| 6. | 75216 | 17.4% | 5.3%(+12.1)#56 | 8.3%(+9.10)#1,872 |
| 7. | 75203 | 17.2% | 5.3%(+11.9)#60 | 8.3%(+8.90)#1,917 |
| 8. | 75212 | 14.1% | 5.3%(+8.80)#97 | 8.3%(+5.80)#2,662 |
| 9. | 75236 | 14.1% | 5.3%(+8.80)#98 | 8.3%(+5.80)#2,665 |
| 10. | 75240 | 13.4% | 5.3%(+8.10)#111 | 8.3%(+5.10)#2,920 |
| 11. | 75231 | 12.9% | 5.3%(+7.60)#121 | 8.3%(+4.60)#3,129 |
| 12. | 75251 | 12.9% | 5.3%(+7.60)#124 | 8.3%(+4.60)#3,152 |
| 13. | 75226 | 12.7% | 5.3%(+7.40)#129 | 8.3%(+4.40)#3,243 |
| 14. | 75241 | 12.1% | 5.3%(+6.80)#151 | 8.3%(+3.80)#3,501 |
| 15. | 75220 | 12.0% | 5.3%(+6.70)#156 | 8.3%(+3.70)#3,547 |
| 16. | 75243 | 11.1% | 5.3%(+5.80)#183 | 8.3%(+2.80)#4,063 |
| 17. | 75235 | 9.7% | 5.3%(+4.40)#237 | 8.3%(+1.40)#5,114 |
| 18. | 75202 | 9.7% | 5.3%(+4.40)#239 | 8.3%(+1.40)#5,140 |
| 19. | 75232 | 9.6% | 5.3%(+4.30)#243 | 8.3%(+1.30)#5,190 |
| 20. | 75228 | 9.4% | 5.3%(+4.10)#250 | 8.3%(+1.10)#5,335 |
| 21. | 75224 | 9.3% | 5.3%(+4.00)#254 | 8.3%(+1.00)#5,424 |
| 22. | 75201 | 8.5% | 5.3%(+3.20)#305 | 8.3%(+0.200)#6,333 |
| 23. | 75217 | 8.3% | 5.3%(+3.00)#314 | 8.3%(=0.000)#6,519 |
| 24. | 75211 | 8.0% | 5.3%(+2.70)#335 | 8.3%(-0.300)#6,892 |
| 25. | 75223 | 7.7% | 5.3%(+2.40)#362 | 8.3%(-0.600)#7,413 |
| 26. | 75230 | 7.5% | 5.3%(+2.20)#373 | 8.3%(-0.800)#7,704 |
| 27. | 75233 | 7.5% | 5.3%(+2.20)#375 | 8.3%(-0.800)#7,728 |
| 28. | 75227 | 7.3% | 5.3%(+2.00)#389 | 8.3%(-1.00)#8,014 |
| 29. | 75204 | 7.3% | 5.3%(+2.00)#392 | 8.3%(-1.00)#8,029 |
| 30. | 75252 | 7.3% | 5.3%(+2.00)#395 | 8.3%(-1.00)#8,038 |
| 31. | 75287 | 6.8% | 5.3%(+1.50)#436 | 8.3%(-1.50)#8,843 |
| 32. | 75208 | 6.7% | 5.3%(+1.40)#446 | 8.3%(-1.60)#9,019 |
| 33. | 75214 | 6.5% | 5.3%(+1.20)#473 | 8.3%(-1.80)#9,378 |
| 34. | 75238 | 6.3% | 5.3%(+1.00)#493 | 8.3%(-2.00)#9,785 |
| 35. | 75219 | 6.1% | 5.3%(+0.800)#518 | 8.3%(-2.20)#10,219 |
| 36. | 75206 | 6.0% | 5.3%(+0.700)#531 | 8.3%(-2.30)#10,428 |
| 37. | 75248 | 4.9% | 5.3%(-0.400)#686 | 8.3%(-3.40)#13,088 |
| 38. | 75254 | 4.7% | 5.3%(-0.600)#727 | 8.3%(-3.60)#13,673 |
| 39. | 75209 | 4.2% | 5.3%(-1.10)#827 | 8.3%(-4.10)#15,170 |
| 40. | 75234 | 3.8% | 5.3%(-1.50)#895 | 8.3%(-4.50)#16,348 |
| 41. | 75253 | 3.7% | 5.3%(-1.60)#911 | 8.3%(-4.60)#16,688 |
| 42. | 75225 | 3.4% | 5.3%(-1.90)#967 | 8.3%(-4.90)#17,653 |
| 43. | 75205 | 3.3% | 5.3%(-2.00)#997 | 8.3%(-5.00)#18,015 |
| 44. | 75218 | 3.0% | 5.3%(-2.30)#1,069 | 8.3%(-5.30)#19,097 |
| 45. | 75244 | 2.8% | 5.3%(-2.50)#1,115 | 8.3%(-5.50)#19,803 |
| 46. | 75229 | 2.4% | 5.3%(-2.90)#1,190 | 8.3%(-5.90)#21,047 |
| 47. | 75207 | 2.4% | 5.3%(-2.90)#1,197 | 8.3%(-5.90)#21,132 |
| 48. | 75249 | 1.2% | 5.3%(-4.10)#1,437 | 8.3%(-7.10)#25,073 |
1
Common Questions
What are the Top 10 Zip Codes with the Highest Percentage of Households Without a Vehicle in Dallas, TX?
Top 10 Zip Codes with the Highest Percentage of Households Without a Vehicle in Dallas, TX are:
What zip code has the Highest Percentage of Households Without a Vehicle in Dallas, TX?
75247 has the Highest Percentage of Households Without a Vehicle in Dallas, TX with 63.6%.
What is the Percentage of Households Without a Vehicle in Dallas, TX?
Percentage of Households Without a Vehicle in Dallas is 9.0%.
What is the Percentage of Households Without a Vehicle in Texas?
Percentage of Households Without a Vehicle in Texas is 5.3%.
What is the Percentage of Households Without a Vehicle in the United States?
Percentage of Households Without a Vehicle in the United States is 8.3%.