Zip Codes with the Highest Percentage of Population Employed in Installation, Maintenance & Repair in Rockwall, TX
RELATED REPORTS & OPTIONS
Installation, Maintenance & Repair
Rockwall
Compare Zip Codes
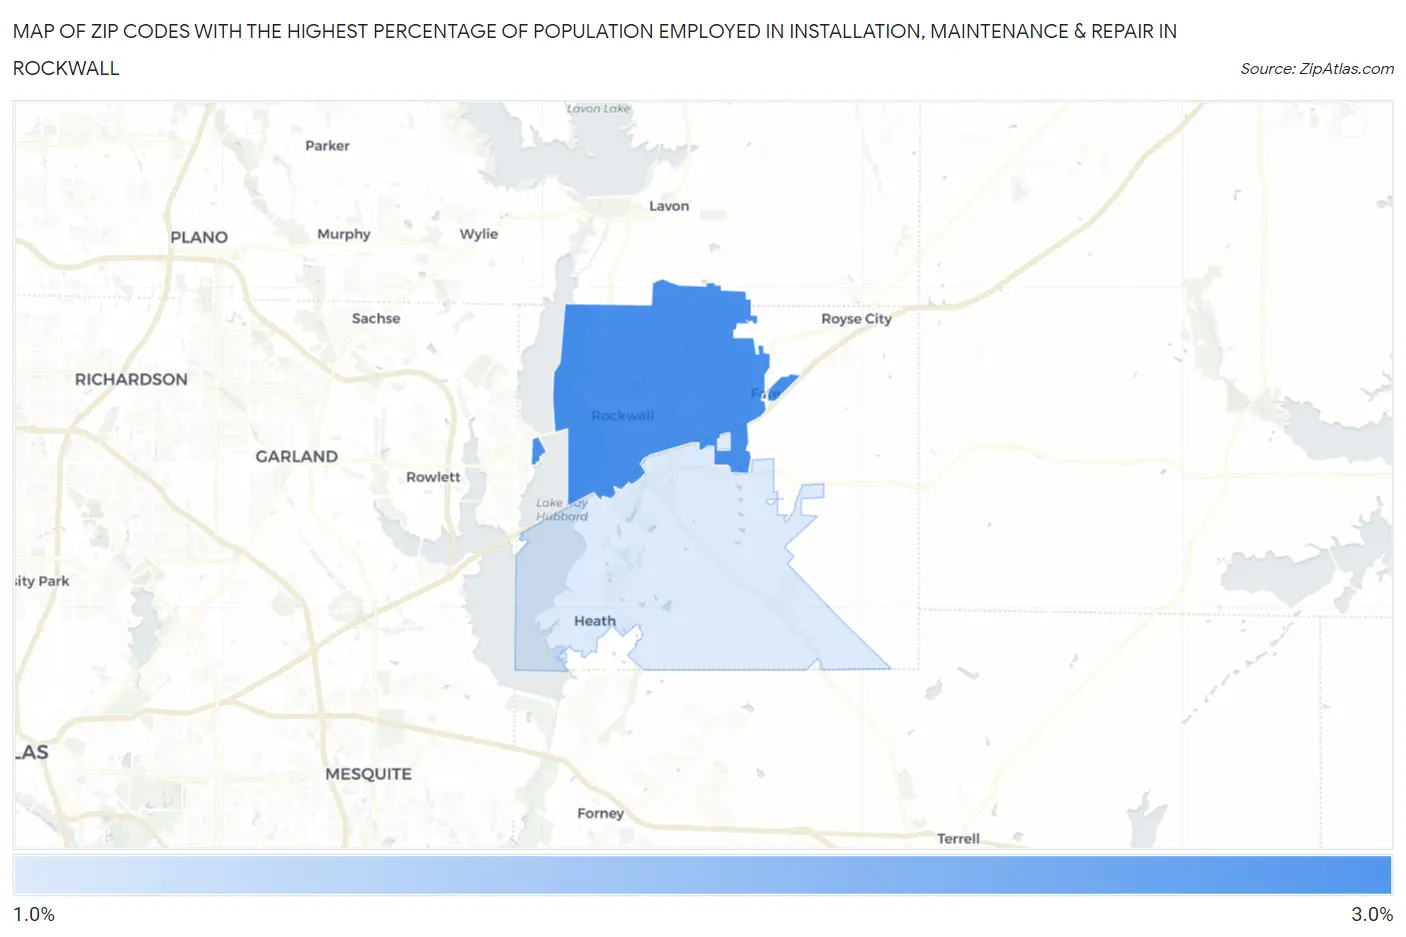
Map of Zip Codes with the Highest Percentage of Population Employed in Installation, Maintenance & Repair in Rockwall
0.0%
3.0%
Zip Codes with the Highest Percentage of Population Employed in Installation, Maintenance & Repair in Rockwall, TX
| Zip Code | % Employed | vs State | vs National | |
| 1. | 75087 | 2.8% | 3.4%(-0.628)#1,122 | 3.1%(-0.293)#18,141 |
| 2. | 75032 | 1.6% | 3.4%(-1.84)#1,442 | 3.1%(-1.50)#23,905 |
1
Common Questions
What are the Top Zip Codes with the Highest Percentage of Population Employed in Installation, Maintenance & Repair in Rockwall, TX?
Top Zip Codes with the Highest Percentage of Population Employed in Installation, Maintenance & Repair in Rockwall, TX are:
What zip code has the Highest Percentage of Population Employed in Installation, Maintenance & Repair in Rockwall, TX?
75087 has the Highest Percentage of Population Employed in Installation, Maintenance & Repair in Rockwall, TX with 2.8%.
What is the Percentage of Population Employed in Installation, Maintenance & Repair in Rockwall, TX?
Percentage of Population Employed in Installation, Maintenance & Repair in Rockwall is 2.1%.
What is the Percentage of Population Employed in Installation, Maintenance & Repair in Texas?
Percentage of Population Employed in Installation, Maintenance & Repair in Texas is 3.4%.
What is the Percentage of Population Employed in Installation, Maintenance & Repair in the United States?
Percentage of Population Employed in Installation, Maintenance & Repair in the United States is 3.1%.