Zip Codes with the Highest Percentage of Population Employed in Installation, Maintenance & Repair in Hurst, TX
RELATED REPORTS & OPTIONS
Installation, Maintenance & Repair
Hurst
Compare Zip Codes
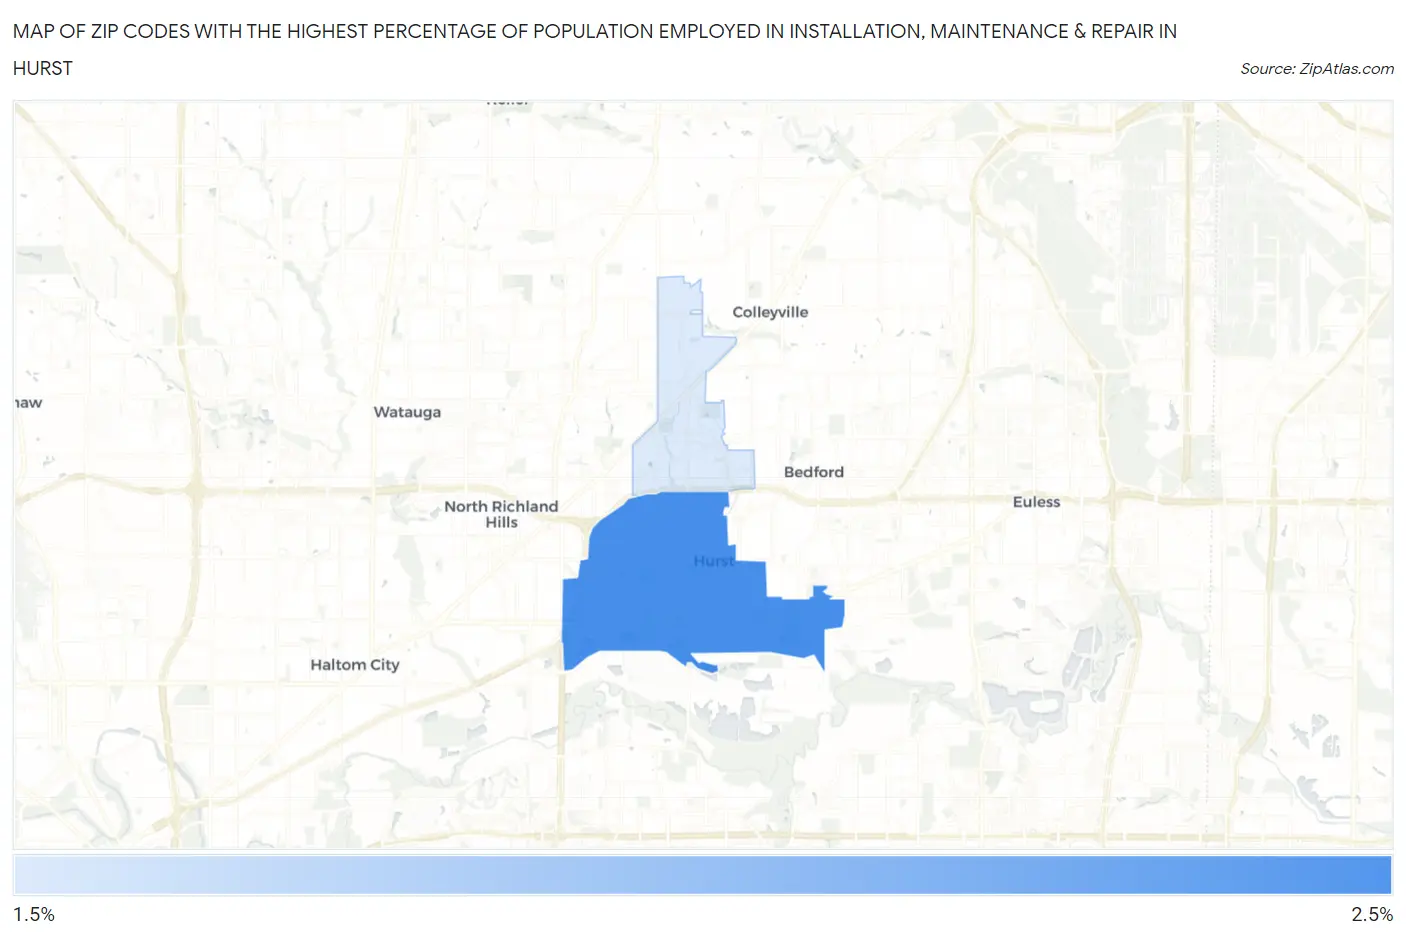
Map of Zip Codes with the Highest Percentage of Population Employed in Installation, Maintenance & Repair in Hurst
0.0%
2.5%
Zip Codes with the Highest Percentage of Population Employed in Installation, Maintenance & Repair in Hurst, TX
| Zip Code | % Employed | vs State | vs National | |
| 1. | 76053 | 2.4% | 3.4%(-0.974)#1,222 | 3.1%(-0.638)#19,910 |
| 2. | 76054 | 1.8% | 3.4%(-1.61)#1,394 | 3.1%(-1.28)#22,942 |
1
Common Questions
What are the Top Zip Codes with the Highest Percentage of Population Employed in Installation, Maintenance & Repair in Hurst, TX?
Top Zip Codes with the Highest Percentage of Population Employed in Installation, Maintenance & Repair in Hurst, TX are:
What zip code has the Highest Percentage of Population Employed in Installation, Maintenance & Repair in Hurst, TX?
76053 has the Highest Percentage of Population Employed in Installation, Maintenance & Repair in Hurst, TX with 2.4%.
What is the Percentage of Population Employed in Installation, Maintenance & Repair in Hurst, TX?
Percentage of Population Employed in Installation, Maintenance & Repair in Hurst is 2.6%.
What is the Percentage of Population Employed in Installation, Maintenance & Repair in Texas?
Percentage of Population Employed in Installation, Maintenance & Repair in Texas is 3.4%.
What is the Percentage of Population Employed in Installation, Maintenance & Repair in the United States?
Percentage of Population Employed in Installation, Maintenance & Repair in the United States is 3.1%.