Zip Codes with the Highest Percentage of Population Employed in Installation, Maintenance & Repair in Beeville, TX
RELATED REPORTS & OPTIONS
Installation, Maintenance & Repair
Beeville
Compare Zip Codes
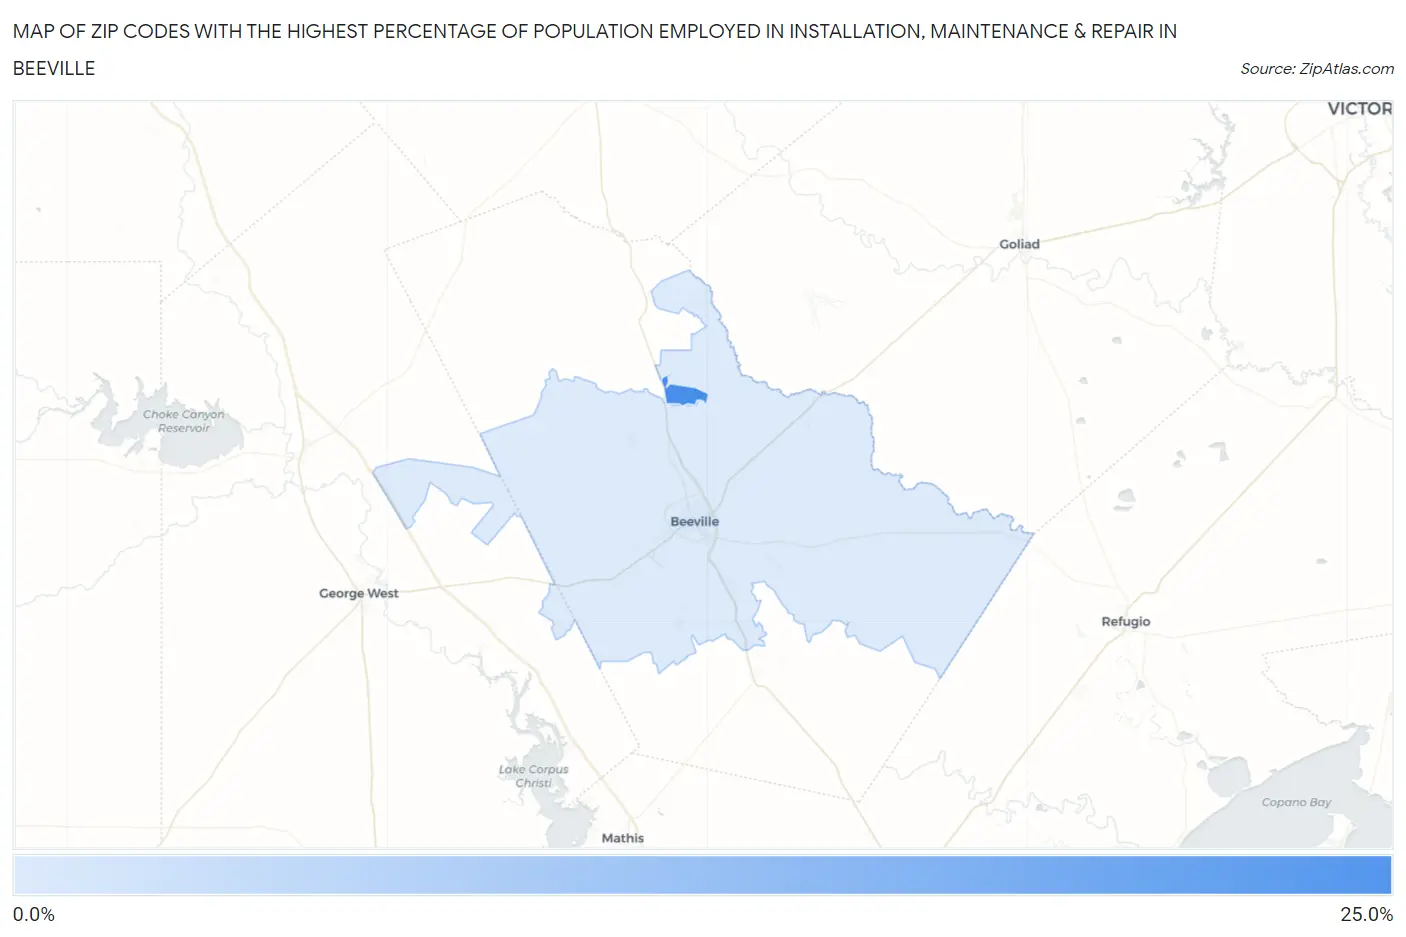
Map of Zip Codes with the Highest Percentage of Population Employed in Installation, Maintenance & Repair in Beeville
0.0%
25.0%
Zip Codes with the Highest Percentage of Population Employed in Installation, Maintenance & Repair in Beeville, TX
| Zip Code | % Employed | vs State | vs National | |
| 1. | 78104 | 22.0% | 3.4%(+18.5)#21 | 3.1%(+18.9)#322 |
| 2. | 78102 | 2.3% | 3.4%(-1.12)#1,262 | 3.1%(-0.787)#20,677 |
1
Common Questions
What are the Top Zip Codes with the Highest Percentage of Population Employed in Installation, Maintenance & Repair in Beeville, TX?
Top Zip Codes with the Highest Percentage of Population Employed in Installation, Maintenance & Repair in Beeville, TX are:
What zip code has the Highest Percentage of Population Employed in Installation, Maintenance & Repair in Beeville, TX?
78104 has the Highest Percentage of Population Employed in Installation, Maintenance & Repair in Beeville, TX with 22.0%.
What is the Percentage of Population Employed in Installation, Maintenance & Repair in Beeville, TX?
Percentage of Population Employed in Installation, Maintenance & Repair in Beeville is 1.9%.
What is the Percentage of Population Employed in Installation, Maintenance & Repair in Texas?
Percentage of Population Employed in Installation, Maintenance & Repair in Texas is 3.4%.
What is the Percentage of Population Employed in Installation, Maintenance & Repair in the United States?
Percentage of Population Employed in Installation, Maintenance & Repair in the United States is 3.1%.