Zip Codes with the Highest Percentage of Population Employed in Installation, Maintenance & Repair in Baytown, TX
RELATED REPORTS & OPTIONS
Installation, Maintenance & Repair
Baytown
Compare Zip Codes
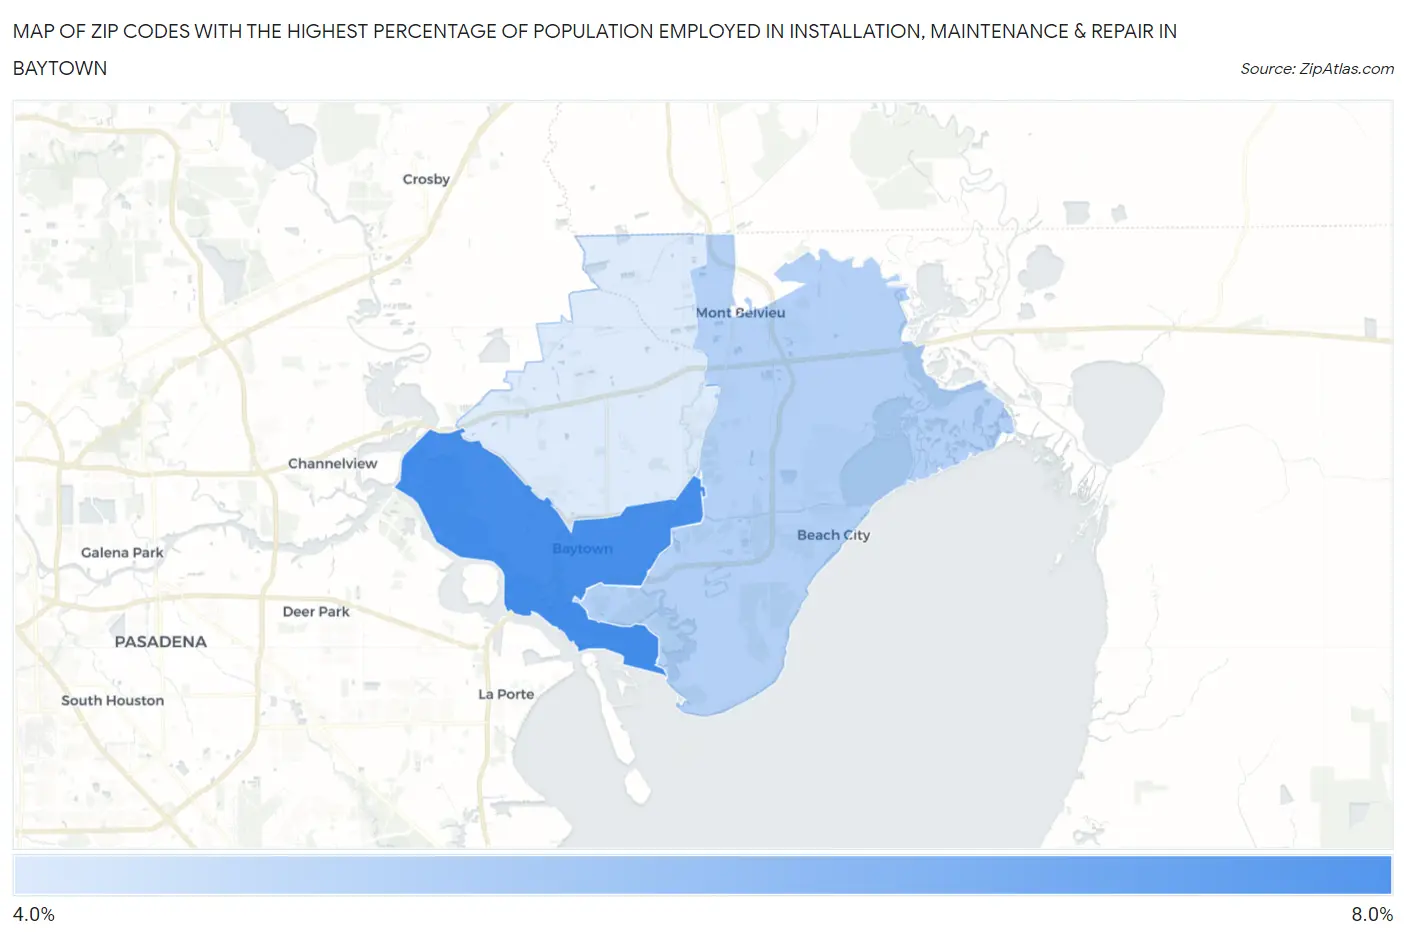
Map of Zip Codes with the Highest Percentage of Population Employed in Installation, Maintenance & Repair in Baytown
0.0%
8.0%
Zip Codes with the Highest Percentage of Population Employed in Installation, Maintenance & Repair in Baytown, TX
| Zip Code | % Employed | vs State | vs National | |
| 1. | 77520 | 7.5% | 3.4%(+4.10)#229 | 3.1%(+4.43)#3,819 |
| 2. | 77523 | 5.0% | 3.4%(+1.62)#524 | 3.1%(+1.95)#8,655 |
| 3. | 77521 | 4.1% | 3.4%(+0.696)#730 | 3.1%(+1.03)#11,923 |
1
Common Questions
What are the Top Zip Codes with the Highest Percentage of Population Employed in Installation, Maintenance & Repair in Baytown, TX?
Top Zip Codes with the Highest Percentage of Population Employed in Installation, Maintenance & Repair in Baytown, TX are:
What zip code has the Highest Percentage of Population Employed in Installation, Maintenance & Repair in Baytown, TX?
77520 has the Highest Percentage of Population Employed in Installation, Maintenance & Repair in Baytown, TX with 7.5%.
What is the Percentage of Population Employed in Installation, Maintenance & Repair in Baytown, TX?
Percentage of Population Employed in Installation, Maintenance & Repair in Baytown is 4.9%.
What is the Percentage of Population Employed in Installation, Maintenance & Repair in Texas?
Percentage of Population Employed in Installation, Maintenance & Repair in Texas is 3.4%.
What is the Percentage of Population Employed in Installation, Maintenance & Repair in the United States?
Percentage of Population Employed in Installation, Maintenance & Repair in the United States is 3.1%.