Zip Codes with the Highest Percentage of Population Employed in Installation, Maintenance & Repair in Tomball, TX
RELATED REPORTS & OPTIONS
Installation, Maintenance & Repair
Tomball
Compare Zip Codes
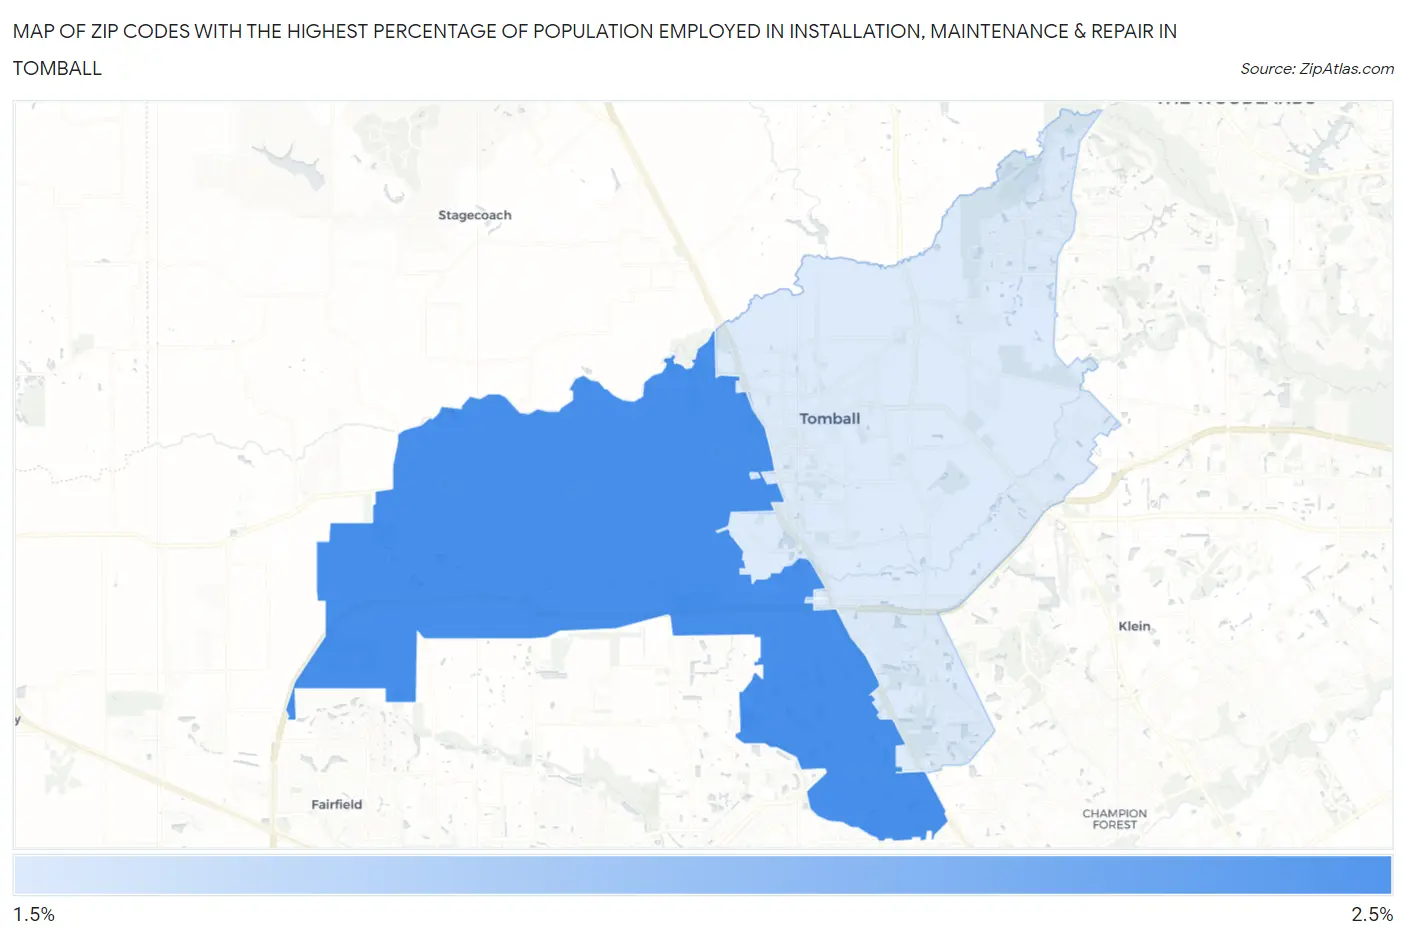
Map of Zip Codes with the Highest Percentage of Population Employed in Installation, Maintenance & Repair in Tomball
0.0%
2.5%
Zip Codes with the Highest Percentage of Population Employed in Installation, Maintenance & Repair in Tomball, TX
| Zip Code | % Employed | vs State | vs National | |
| 1. | 77377 | 2.4% | 3.4%(-1.04)#1,240 | 3.1%(-0.707)#20,266 |
| 2. | 77375 | 2.3% | 3.4%(-1.08)#1,250 | 3.1%(-0.744)#20,460 |
1
Common Questions
What are the Top Zip Codes with the Highest Percentage of Population Employed in Installation, Maintenance & Repair in Tomball, TX?
Top Zip Codes with the Highest Percentage of Population Employed in Installation, Maintenance & Repair in Tomball, TX are:
What zip code has the Highest Percentage of Population Employed in Installation, Maintenance & Repair in Tomball, TX?
77377 has the Highest Percentage of Population Employed in Installation, Maintenance & Repair in Tomball, TX with 2.4%.
What is the Percentage of Population Employed in Installation, Maintenance & Repair in Tomball, TX?
Percentage of Population Employed in Installation, Maintenance & Repair in Tomball is 5.1%.
What is the Percentage of Population Employed in Installation, Maintenance & Repair in Texas?
Percentage of Population Employed in Installation, Maintenance & Repair in Texas is 3.4%.
What is the Percentage of Population Employed in Installation, Maintenance & Repair in the United States?
Percentage of Population Employed in Installation, Maintenance & Repair in the United States is 3.1%.