Zip Codes with the Highest Percentage of Population Employed in Installation, Maintenance & Repair in Round Rock, TX
RELATED REPORTS & OPTIONS
Installation, Maintenance & Repair
Round Rock
Compare Zip Codes
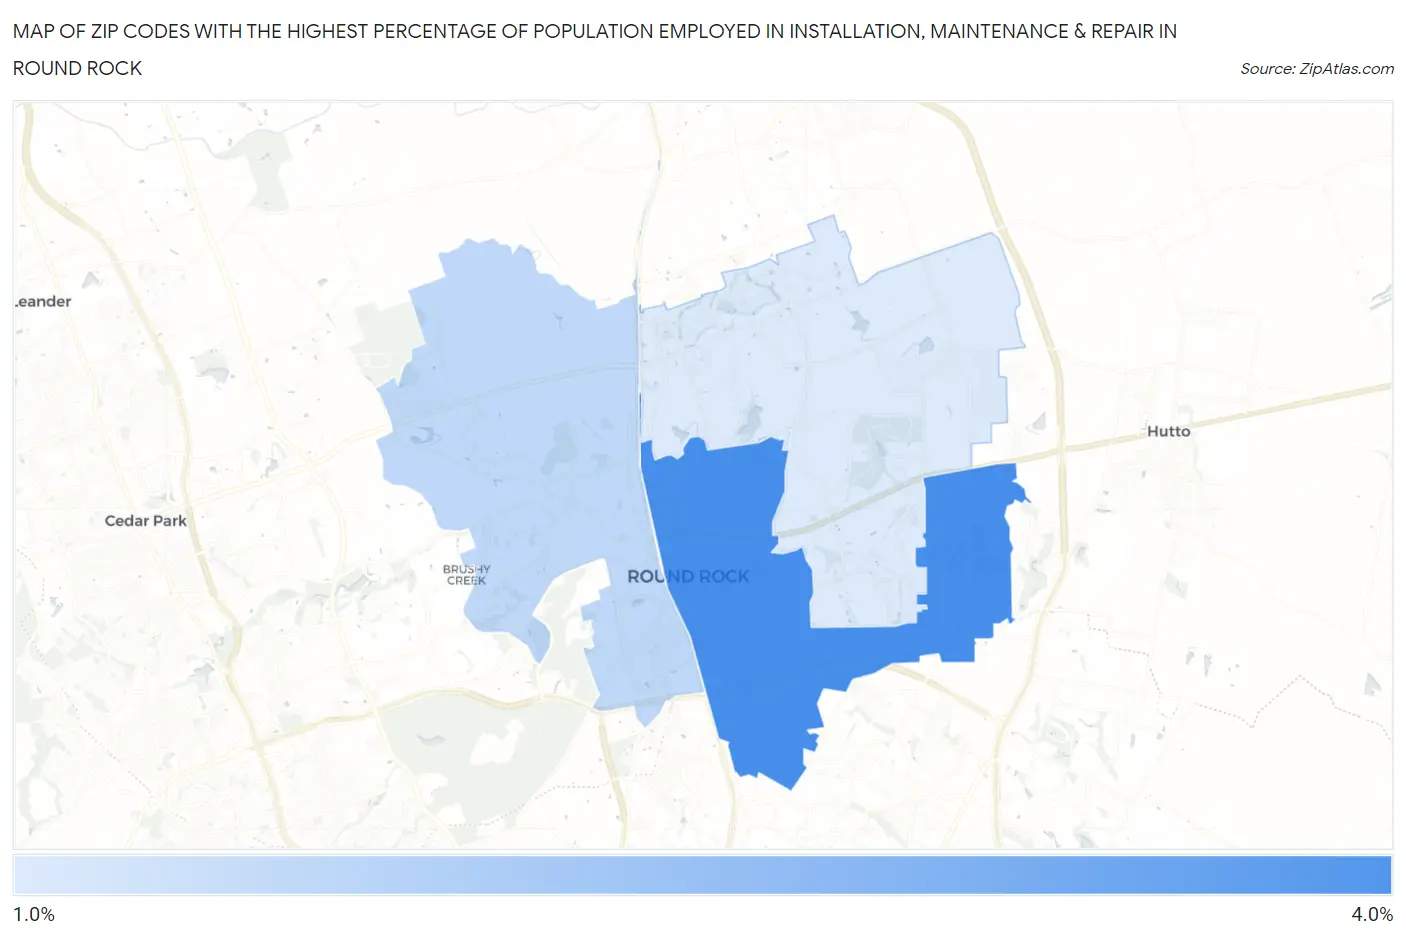
Map of Zip Codes with the Highest Percentage of Population Employed in Installation, Maintenance & Repair in Round Rock
0.0%
4.0%
Zip Codes with the Highest Percentage of Population Employed in Installation, Maintenance & Repair in Round Rock, TX
| Zip Code | % Employed | vs State | vs National | |
| 1. | 78664 | 3.3% | 3.4%(-0.083)#965 | 3.1%(+0.253)#15,456 |
| 2. | 78681 | 1.9% | 3.4%(-1.46)#1,362 | 3.1%(-1.13)#22,276 |
| 3. | 78665 | 1.6% | 3.4%(-1.81)#1,437 | 3.1%(-1.48)#23,803 |
1
Common Questions
What are the Top Zip Codes with the Highest Percentage of Population Employed in Installation, Maintenance & Repair in Round Rock, TX?
Top Zip Codes with the Highest Percentage of Population Employed in Installation, Maintenance & Repair in Round Rock, TX are:
What zip code has the Highest Percentage of Population Employed in Installation, Maintenance & Repair in Round Rock, TX?
78664 has the Highest Percentage of Population Employed in Installation, Maintenance & Repair in Round Rock, TX with 3.3%.
What is the Percentage of Population Employed in Installation, Maintenance & Repair in Round Rock, TX?
Percentage of Population Employed in Installation, Maintenance & Repair in Round Rock is 2.5%.
What is the Percentage of Population Employed in Installation, Maintenance & Repair in Texas?
Percentage of Population Employed in Installation, Maintenance & Repair in Texas is 3.4%.
What is the Percentage of Population Employed in Installation, Maintenance & Repair in the United States?
Percentage of Population Employed in Installation, Maintenance & Repair in the United States is 3.1%.