Zip Codes with the Highest Percentage of Population Employed in Installation, Maintenance & Repair in Irving, TX
RELATED REPORTS & OPTIONS
Installation, Maintenance & Repair
Irving
Compare Zip Codes
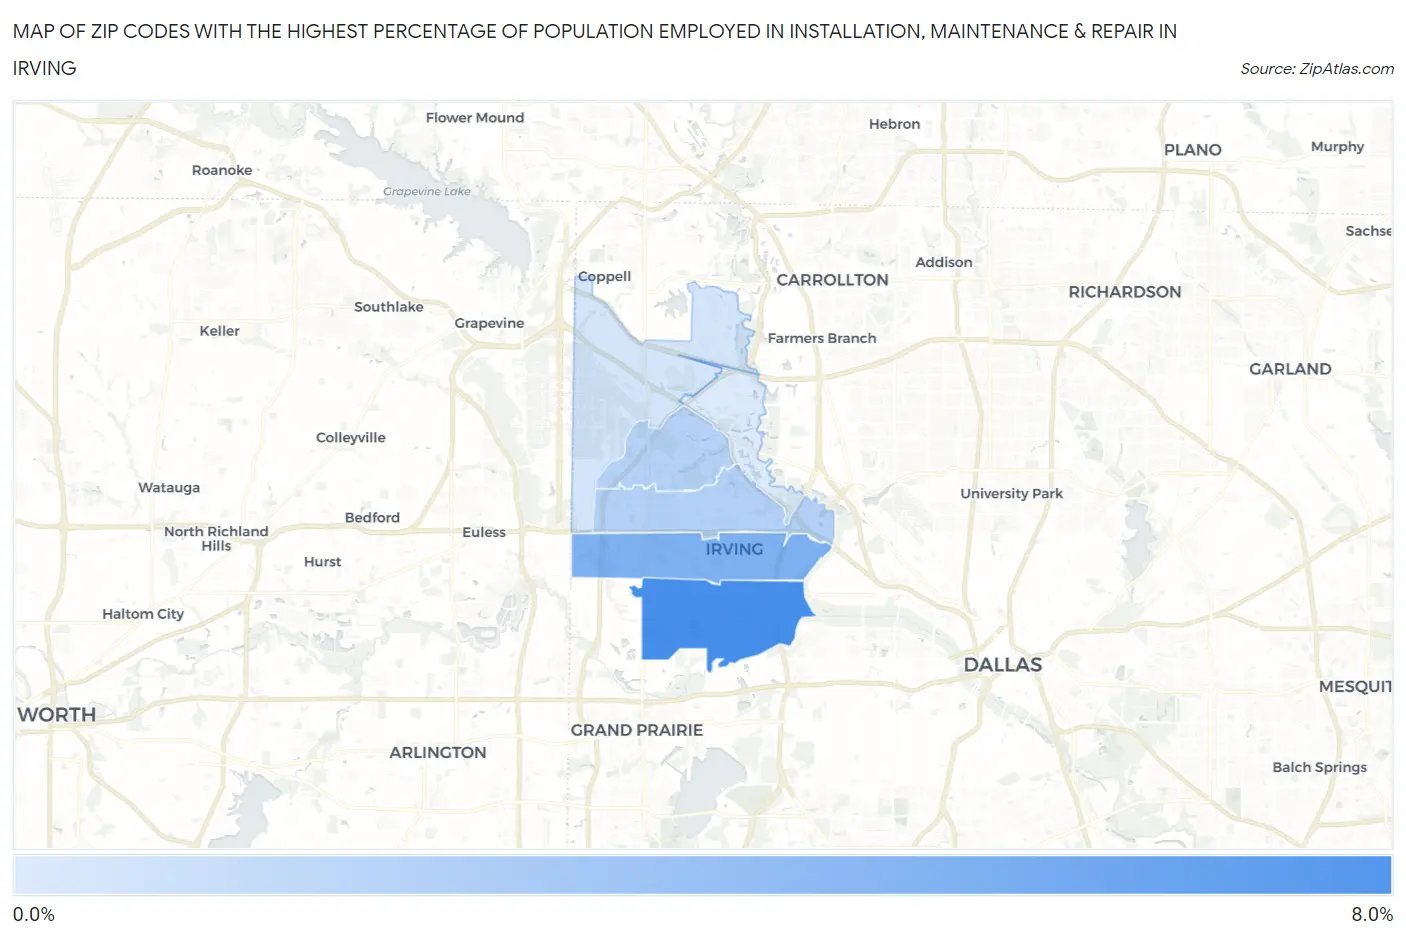
Map of Zip Codes with the Highest Percentage of Population Employed in Installation, Maintenance & Repair in Irving
0.0%
8.0%
Zip Codes with the Highest Percentage of Population Employed in Installation, Maintenance & Repair in Irving, TX
| Zip Code | % Employed | vs State | vs National | |
| 1. | 75060 | 6.2% | 3.4%(+2.80)#330 | 3.1%(+3.14)#5,716 |
| 2. | 75061 | 4.1% | 3.4%(+0.702)#726 | 3.1%(+1.04)#11,897 |
| 3. | 75062 | 2.1% | 3.4%(-1.34)#1,329 | 3.1%(-1.01)#21,733 |
| 4. | 75038 | 2.0% | 3.4%(-1.40)#1,348 | 3.1%(-1.07)#22,008 |
| 5. | 75063 | 0.89% | 3.4%(-2.52)#1,548 | 3.1%(-2.18)#26,235 |
| 6. | 75039 | 0.53% | 3.4%(-2.87)#1,590 | 3.1%(-2.54)#27,155 |
1
Common Questions
What are the Top 5 Zip Codes with the Highest Percentage of Population Employed in Installation, Maintenance & Repair in Irving, TX?
Top 5 Zip Codes with the Highest Percentage of Population Employed in Installation, Maintenance & Repair in Irving, TX are:
What zip code has the Highest Percentage of Population Employed in Installation, Maintenance & Repair in Irving, TX?
75060 has the Highest Percentage of Population Employed in Installation, Maintenance & Repair in Irving, TX with 6.2%.
What is the Percentage of Population Employed in Installation, Maintenance & Repair in Irving, TX?
Percentage of Population Employed in Installation, Maintenance & Repair in Irving is 2.8%.
What is the Percentage of Population Employed in Installation, Maintenance & Repair in Texas?
Percentage of Population Employed in Installation, Maintenance & Repair in Texas is 3.4%.
What is the Percentage of Population Employed in Installation, Maintenance & Repair in the United States?
Percentage of Population Employed in Installation, Maintenance & Repair in the United States is 3.1%.