Zip Codes with the Highest Percentage of Population with a Degree in Visual and Performing Arts in Euclid, OH
RELATED REPORTS & OPTIONS
Visual and Performing Arts
Euclid
Compare Zip Codes
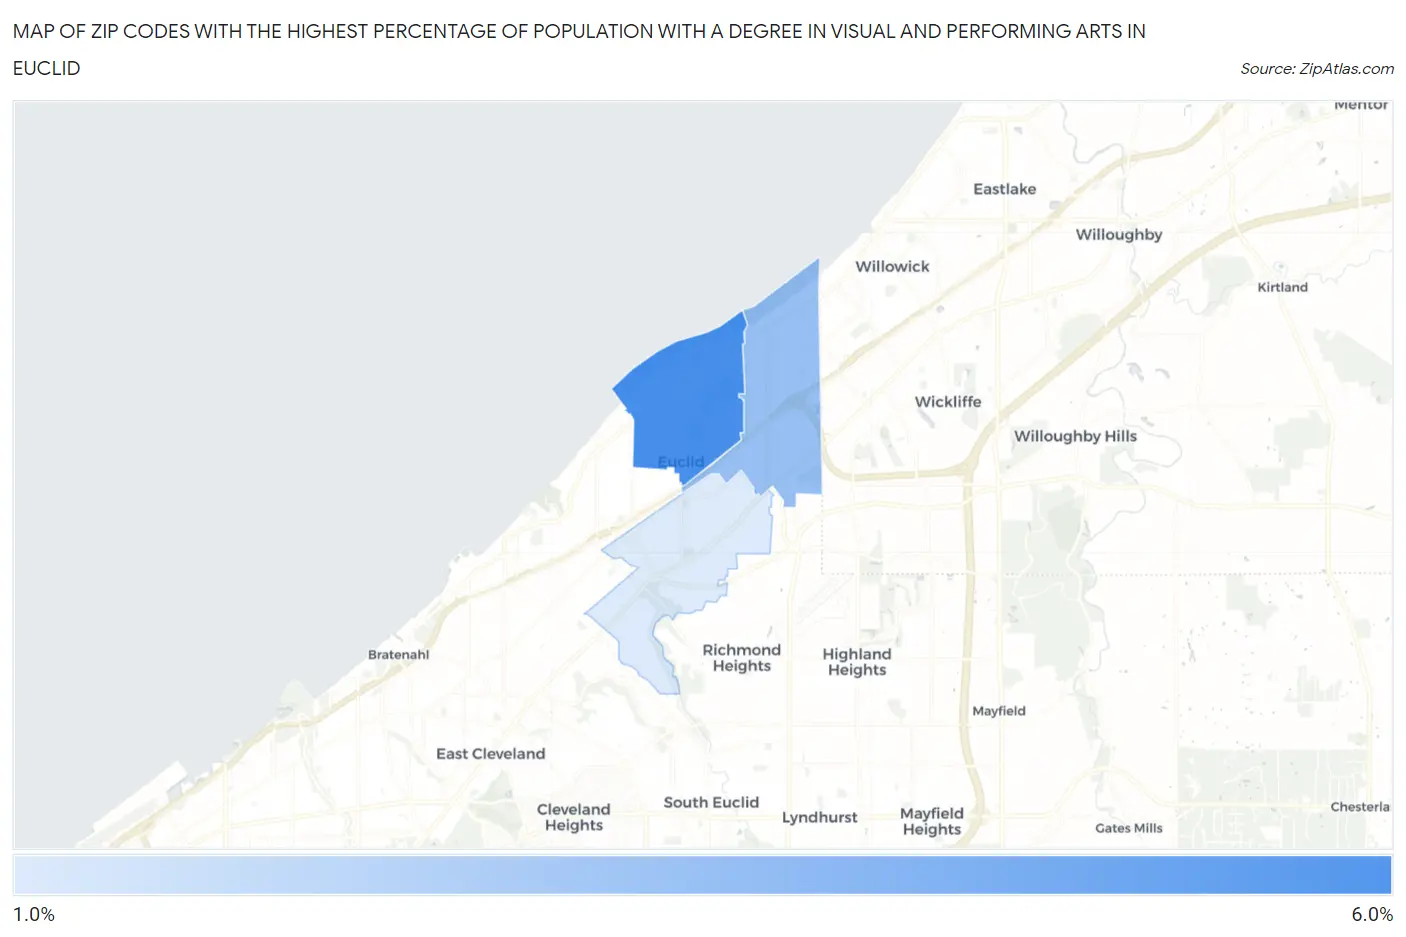
Map of Zip Codes with the Highest Percentage of Population with a Degree in Visual and Performing Arts in Euclid
0.0%
6.0%
Zip Codes with the Highest Percentage of Population with a Degree in Visual and Performing Arts in Euclid, OH
| Zip Code | % Graduates | vs State | vs National | |
| 1. | 44123 | 5.8% | 3.7%(+2.10)#183 | 4.3%(+1.56)#5,154 |
| 2. | 44132 | 3.7% | 3.7%(-0.052)#368 | 4.3%(-0.594)#10,305 |
| 3. | 44117 | 1.9% | 3.7%(-1.86)#622 | 4.3%(-2.40)#16,945 |
1
Common Questions
What are the Top Zip Codes with the Highest Percentage of Population with a Degree in Visual and Performing Arts in Euclid, OH?
Top Zip Codes with the Highest Percentage of Population with a Degree in Visual and Performing Arts in Euclid, OH are:
What zip code has the Highest Percentage of Population with a Degree in Visual and Performing Arts in Euclid, OH?
44123 has the Highest Percentage of Population with a Degree in Visual and Performing Arts in Euclid, OH with 5.8%.
What is the Percentage of Population with a Degree in Visual and Performing Arts in Euclid, OH?
Percentage of Population with a Degree in Visual and Performing Arts in Euclid is 3.9%.
What is the Percentage of Population with a Degree in Visual and Performing Arts in Ohio?
Percentage of Population with a Degree in Visual and Performing Arts in Ohio is 3.7%.
What is the Percentage of Population with a Degree in Visual and Performing Arts in the United States?
Percentage of Population with a Degree in Visual and Performing Arts in the United States is 4.3%.