Zip Codes with the Highest Percentage of Population with a Degree in Visual and Performing Arts in Lima, OH
RELATED REPORTS & OPTIONS
Visual and Performing Arts
Lima
Compare Zip Codes
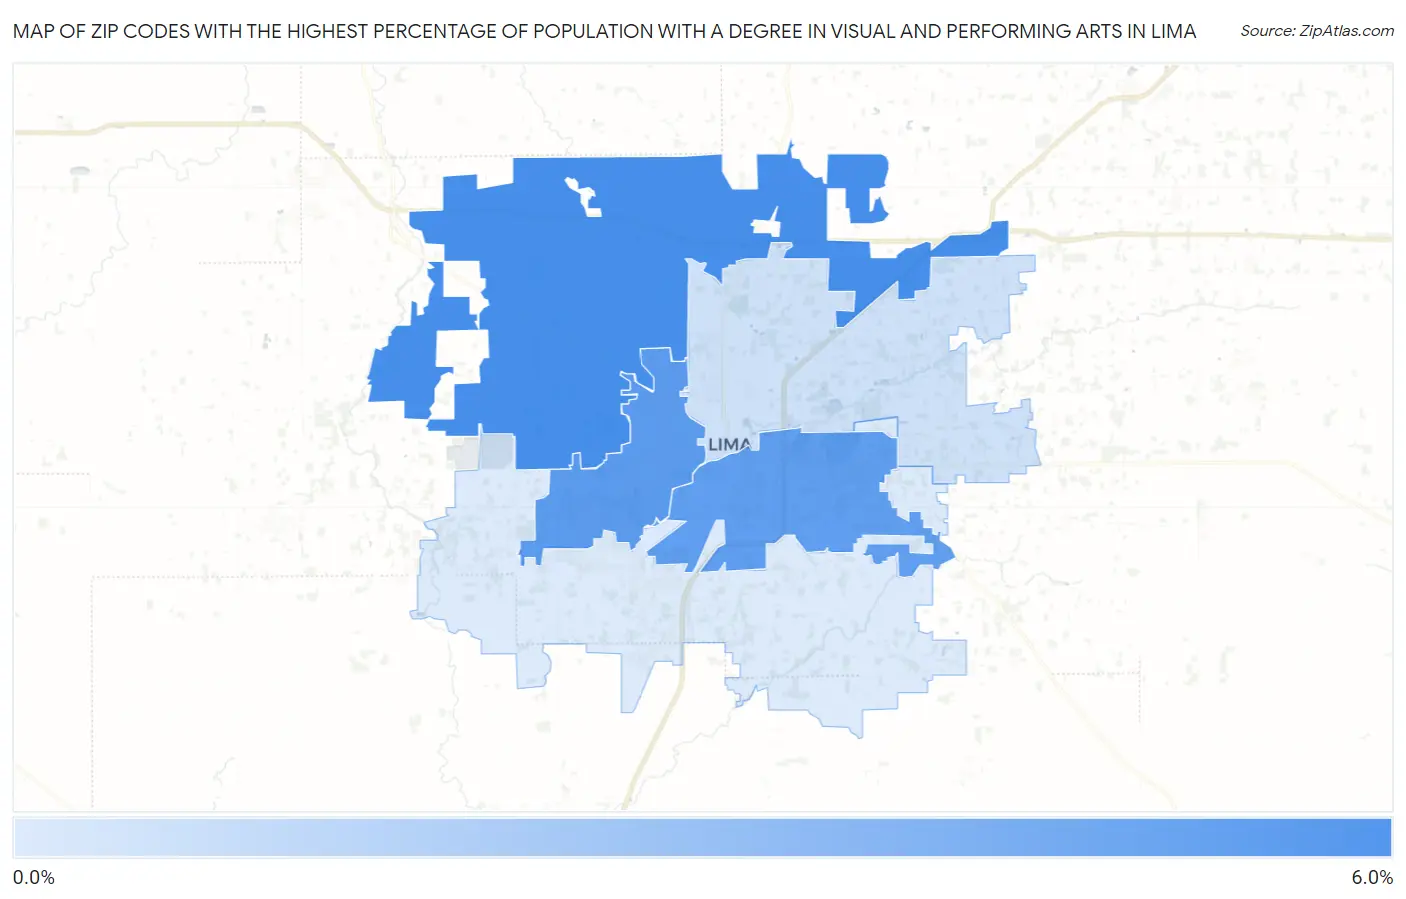
Map of Zip Codes with the Highest Percentage of Population with a Degree in Visual and Performing Arts in Lima
0.0%
6.0%
Zip Codes with the Highest Percentage of Population with a Degree in Visual and Performing Arts in Lima, OH
| Zip Code | % Graduates | vs State | vs National | |
| 1. | 45807 | 5.9% | 3.7%(+2.15)#180 | 4.3%(+1.61)#5,084 |
| 2. | 45805 | 5.0% | 3.7%(+1.32)#231 | 4.3%(+0.779)#6,553 |
| 3. | 45804 | 4.9% | 3.7%(+1.15)#248 | 4.3%(+0.604)#6,956 |
| 4. | 45801 | 0.76% | 3.7%(-2.95)#753 | 4.3%(-3.49)#20,245 |
| 5. | 45806 | 0.27% | 3.7%(-3.45)#789 | 4.3%(-3.99)#21,130 |
1
Common Questions
What are the Top 3 Zip Codes with the Highest Percentage of Population with a Degree in Visual and Performing Arts in Lima, OH?
Top 3 Zip Codes with the Highest Percentage of Population with a Degree in Visual and Performing Arts in Lima, OH are:
What zip code has the Highest Percentage of Population with a Degree in Visual and Performing Arts in Lima, OH?
45807 has the Highest Percentage of Population with a Degree in Visual and Performing Arts in Lima, OH with 5.9%.
What is the Percentage of Population with a Degree in Visual and Performing Arts in Lima, OH?
Percentage of Population with a Degree in Visual and Performing Arts in Lima is 4.7%.
What is the Percentage of Population with a Degree in Visual and Performing Arts in Ohio?
Percentage of Population with a Degree in Visual and Performing Arts in Ohio is 3.7%.
What is the Percentage of Population with a Degree in Visual and Performing Arts in the United States?
Percentage of Population with a Degree in Visual and Performing Arts in the United States is 4.3%.