White Rock, NM
White Rock Map
White Rock Overview
5,592
TOTAL POPULATION
2,708
MALE POPULATION
2,884
FEMALE POPULATION
93.90
MALES / 100 FEMALES
106.50
FEMALES / 100 MALES
41.2
MEDIAN AGE
3.2
AVG FAMILY SIZE
2.8
AVG HOUSEHOLD SIZE
$66,311
PER CAPITA INCOME
$153,801
AVG FAMILY INCOME
$144,661
AVG HOUSEHOLD INCOME
43.1%
WAGE / INCOME GAP [ % ]
56.9¢/ $1
WAGE / INCOME GAP [ $ ]
0.33
INEQUALITY / GINI INDEX
2,660
LABOR FORCE [ PEOPLE ]
63.0%
PERCENT IN LABOR FORCE
2.3%
UNEMPLOYMENT RATE
White Rock Zip Codes
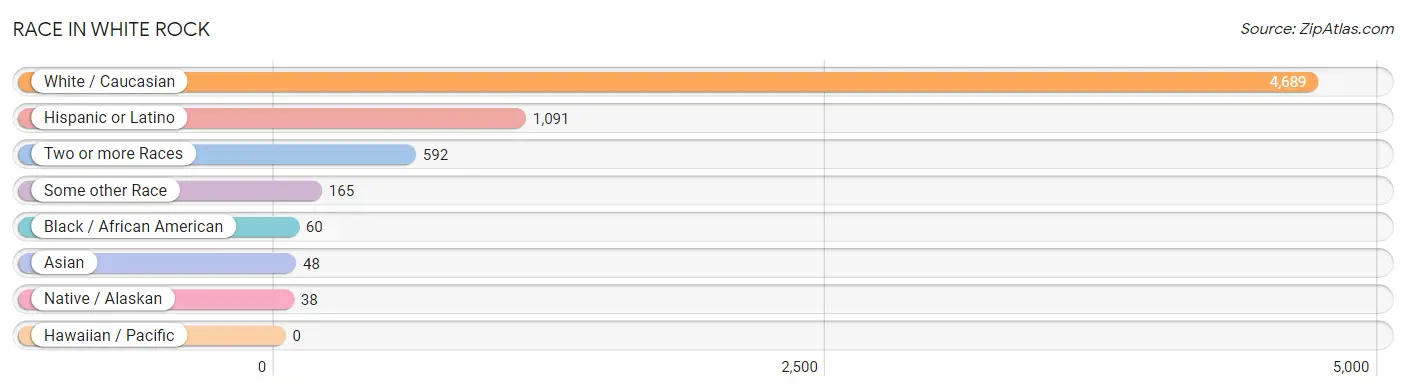
Race in White Rock
The most populous races in White Rock are White / Caucasian (4,689 | 83.9%), Hispanic or Latino (1,091 | 19.5%), and Two or more Races (592 | 10.6%).
| Race | # Population | % Population |
| Asian | 48 | 0.9% |
| Black / African American | 60 | 1.1% |
| Hawaiian / Pacific | 0 | 0.0% |
| Hispanic or Latino | 1,091 | 19.5% |
| Native / Alaskan | 38 | 0.7% |
| White / Caucasian | 4,689 | 83.9% |
| Two or more Races | 592 | 10.6% |
| Some other Race | 165 | 2.9% |
| Total | 5,592 | 100.0% |
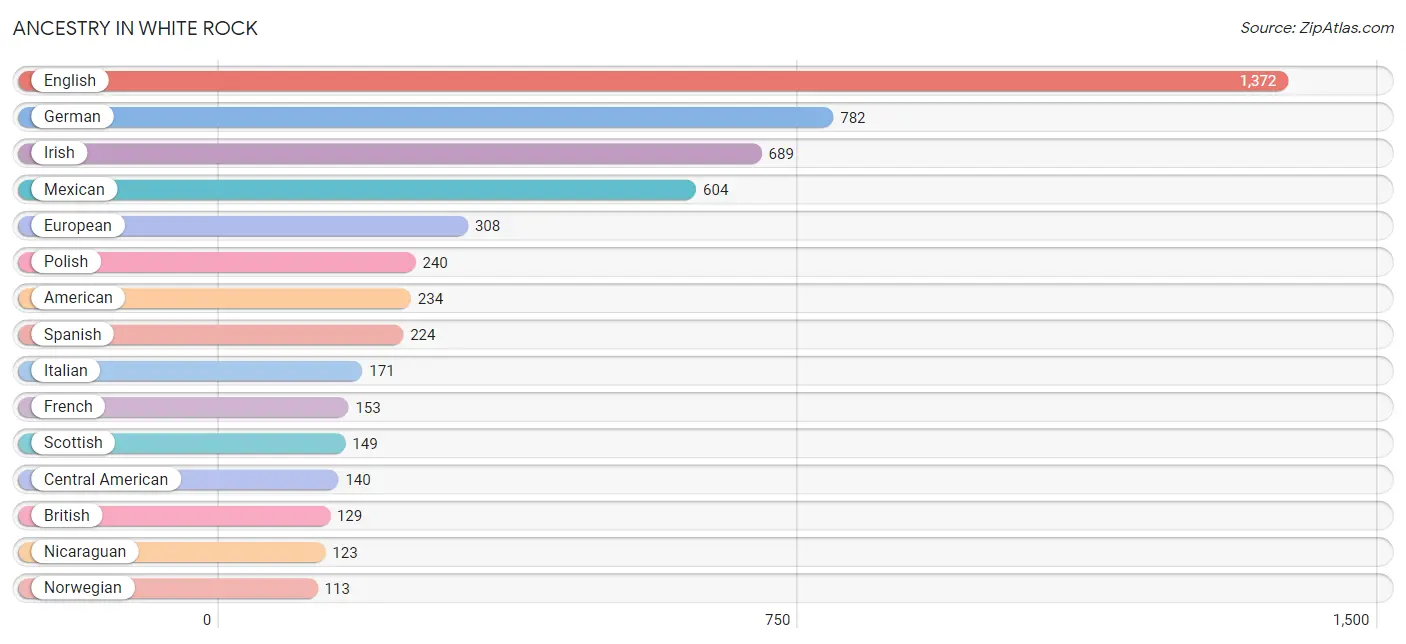
Ancestry in White Rock
The most populous ancestries reported in White Rock are English (1,372 | 24.5%), German (782 | 14.0%), Irish (689 | 12.3%), Mexican (604 | 10.8%), and European (308 | 5.5%), together accounting for 67.1% of all White Rock residents.
| Ancestry | # Population | % Population |
| American | 234 | 4.2% |
| Arab | 24 | 0.4% |
| Armenian | 16 | 0.3% |
| Basque | 4 | 0.1% |
| Belgian | 33 | 0.6% |
| Bhutanese | 103 | 1.8% |
| British | 129 | 2.3% |
| British West Indian | 42 | 0.7% |
| Burmese | 60 | 1.1% |
| Central American | 140 | 2.5% |
| Colombian | 22 | 0.4% |
| Colville | 13 | 0.2% |
| Czech | 31 | 0.5% |
| Danish | 36 | 0.6% |
| Dutch | 33 | 0.6% |
| Eastern European | 63 | 1.1% |
| English | 1,372 | 24.5% |
| European | 308 | 5.5% |
| Finnish | 13 | 0.2% |
| French | 153 | 2.7% |
| French Canadian | 98 | 1.8% |
| German | 782 | 14.0% |
| Hungarian | 33 | 0.6% |
| Indian (Asian) | 99 | 1.8% |
| Irish | 689 | 12.3% |
| Italian | 171 | 3.1% |
| Korean | 18 | 0.3% |
| Laotian | 14 | 0.3% |
| Latvian | 15 | 0.3% |
| Lithuanian | 15 | 0.3% |
| Mexican | 604 | 10.8% |
| Native Hawaiian | 60 | 1.1% |
| Navajo | 38 | 0.7% |
| Nicaraguan | 123 | 2.2% |
| Northern European | 24 | 0.4% |
| Norwegian | 113 | 2.0% |
| Polish | 240 | 4.3% |
| Portuguese | 26 | 0.5% |
| Romanian | 29 | 0.5% |
| Russian | 23 | 0.4% |
| Scandinavian | 80 | 1.4% |
| Scotch-Irish | 49 | 0.9% |
| Scottish | 149 | 2.7% |
| Slovak | 14 | 0.3% |
| Slovene | 17 | 0.3% |
| South American | 22 | 0.4% |
| Spaniard | 37 | 0.7% |
| Spanish | 224 | 4.0% |
| Swedish | 15 | 0.3% |
| Swiss | 57 | 1.0% |
| Ukrainian | 49 | 0.9% |
| Welsh | 41 | 0.7% | View All 52 Rows |
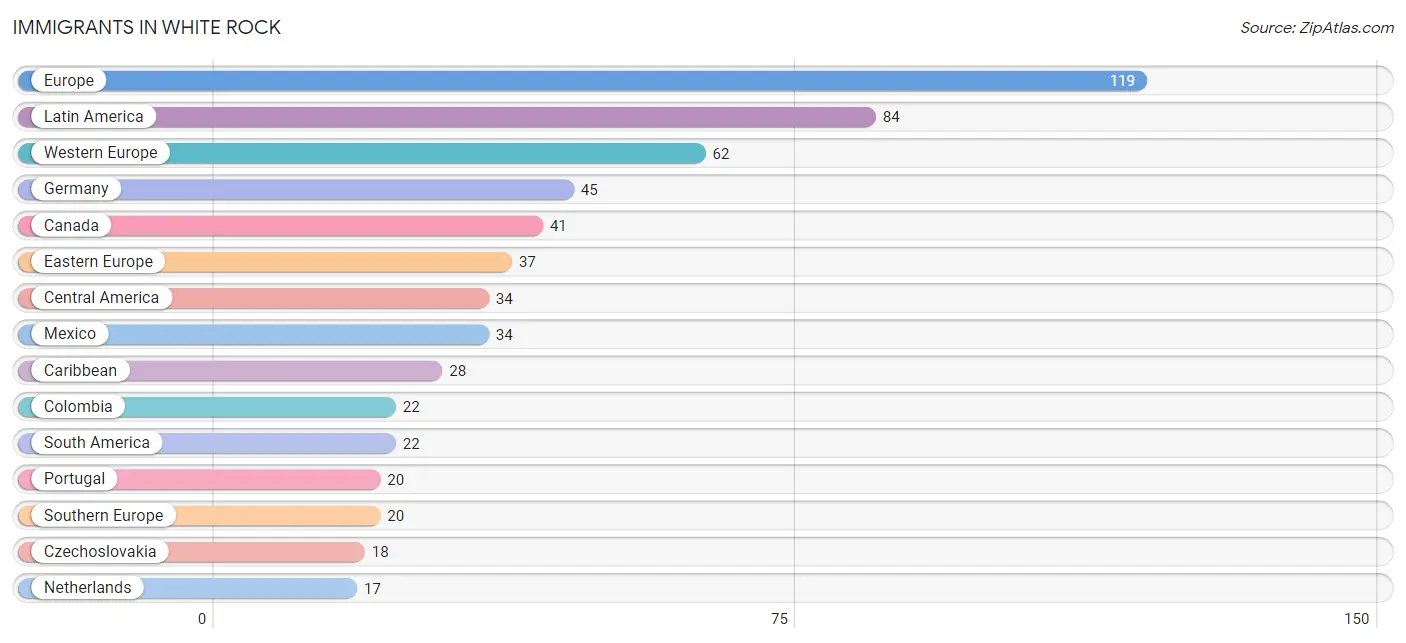
Immigrants in White Rock
The most numerous immigrant groups reported in White Rock came from Europe (119 | 2.1%), Latin America (84 | 1.5%), Western Europe (62 | 1.1%), Germany (45 | 0.8%), and Canada (41 | 0.7%), together accounting for 6.3% of all White Rock residents.
| Immigration Origin | # Population | % Population |
| Asia | 10 | 0.2% |
| Canada | 41 | 0.7% |
| Caribbean | 28 | 0.5% |
| Central America | 34 | 0.6% |
| Colombia | 22 | 0.4% |
| Czechoslovakia | 18 | 0.3% |
| Eastern Asia | 10 | 0.2% |
| Eastern Europe | 37 | 0.7% |
| Europe | 119 | 2.1% |
| Germany | 45 | 0.8% |
| Japan | 10 | 0.2% |
| Latin America | 84 | 1.5% |
| Mexico | 34 | 0.6% |
| Netherlands | 17 | 0.3% |
| Portugal | 20 | 0.4% |
| Romania | 8 | 0.1% |
| Russia | 11 | 0.2% |
| South America | 22 | 0.4% |
| Southern Europe | 20 | 0.4% |
| Western Europe | 62 | 1.1% | View All 20 Rows |
Sex and Age in White Rock
Sex and Age in White Rock
The most populous age groups in White Rock are 5 to 9 Years (334 | 12.3%) for men and 10 to 14 Years (260 | 9.0%) for women.
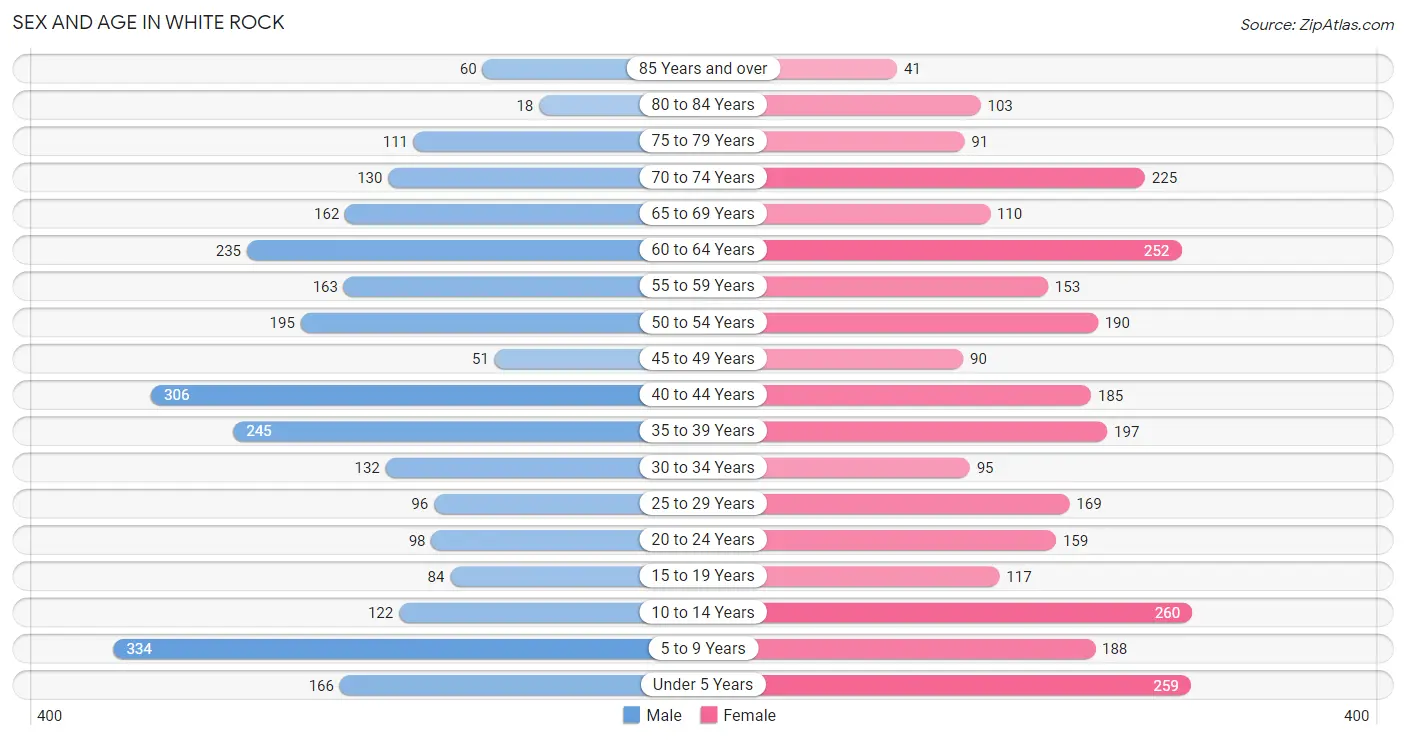
| Age Bracket | Male | Female |
| Under 5 Years | 166 (6.1%) | 259 (9.0%) |
| 5 to 9 Years | 334 (12.3%) | 188 (6.5%) |
| 10 to 14 Years | 122 (4.5%) | 260 (9.0%) |
| 15 to 19 Years | 84 (3.1%) | 117 (4.1%) |
| 20 to 24 Years | 98 (3.6%) | 159 (5.5%) |
| 25 to 29 Years | 96 (3.5%) | 169 (5.9%) |
| 30 to 34 Years | 132 (4.9%) | 95 (3.3%) |
| 35 to 39 Years | 245 (9.0%) | 197 (6.8%) |
| 40 to 44 Years | 306 (11.3%) | 185 (6.4%) |
| 45 to 49 Years | 51 (1.9%) | 90 (3.1%) |
| 50 to 54 Years | 195 (7.2%) | 190 (6.6%) |
| 55 to 59 Years | 163 (6.0%) | 153 (5.3%) |
| 60 to 64 Years | 235 (8.7%) | 252 (8.7%) |
| 65 to 69 Years | 162 (6.0%) | 110 (3.8%) |
| 70 to 74 Years | 130 (4.8%) | 225 (7.8%) |
| 75 to 79 Years | 111 (4.1%) | 91 (3.2%) |
| 80 to 84 Years | 18 (0.7%) | 103 (3.6%) |
| 85 Years and over | 60 (2.2%) | 41 (1.4%) |
| Total | 2,708 (100.0%) | 2,884 (100.0%) |
Families and Households in White Rock
Median Family Size in White Rock
The median family size in White Rock is 3.16 persons per family, with single male/father families (67 | 4.3%) accounting for the largest median family size of 3.49 persons per family. On the other hand, single female/mother families (42 | 2.7%) represent the smallest median family size with 1.88 persons per family.
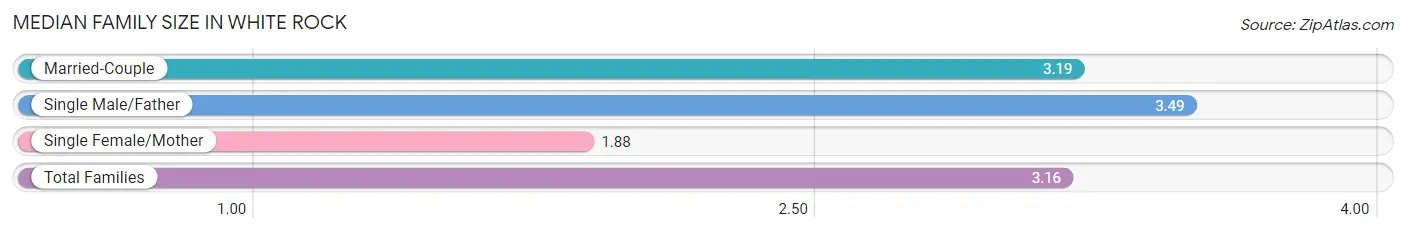
| Family Type | # Families | Family Size |
| Married-Couple | 1,444 (93.0%) | 3.19 |
| Single Male/Father | 67 (4.3%) | 3.49 |
| Single Female/Mother | 42 (2.7%) | 1.88 |
| Total Families | 1,553 (100.0%) | 3.16 |
Median Household Size in White Rock
The median household size in White Rock is 2.75 persons per household, with single male/father households (67 | 3.3%) accounting for the largest median household size of 4.16 persons per household. non-family households (480 | 23.6%) represent the smallest median household size with 1.20 persons per household.
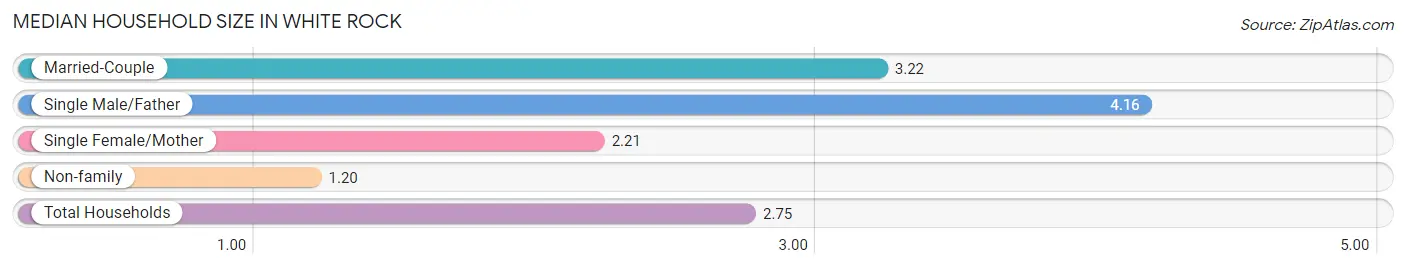
| Household Type | # Households | Household Size |
| Married-Couple | 1,444 (71.0%) | 3.22 |
| Single Male/Father | 67 (3.3%) | 4.16 |
| Single Female/Mother | 42 (2.1%) | 2.21 |
| Non-family | 480 (23.6%) | 1.20 |
| Total Households | 2,033 (100.0%) | 2.75 |
Household Size by Marriage Status in White Rock
Out of a total of 2,033 households in White Rock, 1,553 (76.4%) are family households, while 480 (23.6%) are nonfamily households. The most numerous type of family households are 2-person households, comprising 671, and the most common type of nonfamily households are 1-person households, comprising 398.
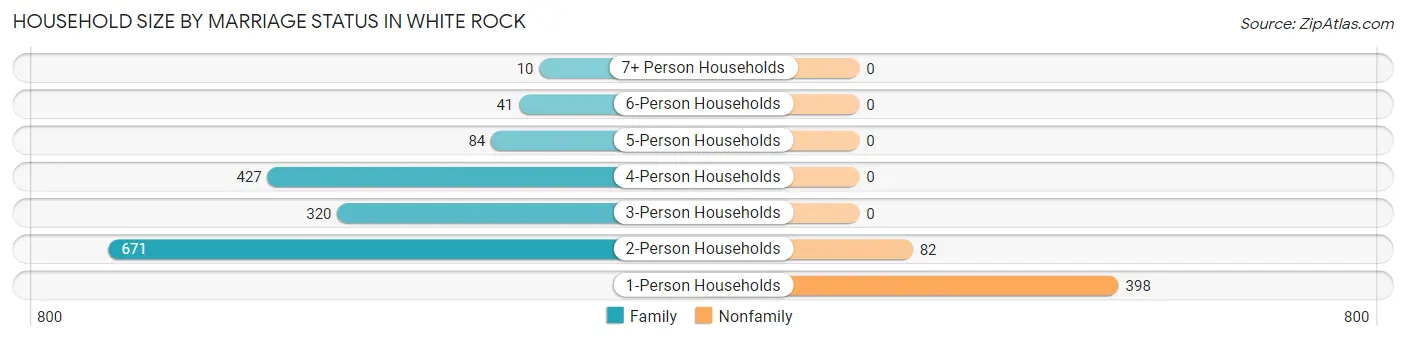
| Household Size | Family Households | Nonfamily Households |
| 1-Person Households | - | 398 (19.6%) |
| 2-Person Households | 671 (33.0%) | 82 (4.0%) |
| 3-Person Households | 320 (15.7%) | 0 (0.0%) |
| 4-Person Households | 427 (21.0%) | 0 (0.0%) |
| 5-Person Households | 84 (4.1%) | 0 (0.0%) |
| 6-Person Households | 41 (2.0%) | 0 (0.0%) |
| 7+ Person Households | 10 (0.5%) | 0 (0.0%) |
| Total | 1,553 (76.4%) | 480 (23.6%) |
Female Fertility in White Rock
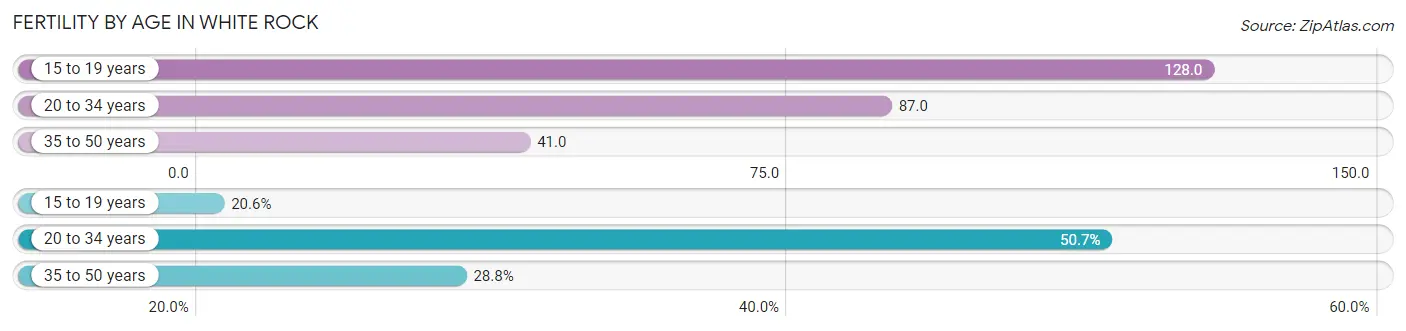
Fertility by Age in White Rock
Average fertility rate in White Rock is 70.0 births per 1,000 women. Women in the age bracket of 15 to 19 years have the highest fertility rate with 128.0 births per 1,000 women. Women in the age bracket of 20 to 34 years acount for 50.7% of all women with births.
| Age Bracket | Women with Births | Births / 1,000 Women |
| 15 to 19 years | 15 (20.5%) | 128.0 |
| 20 to 34 years | 37 (50.7%) | 87.0 |
| 35 to 50 years | 21 (28.8%) | 41.0 |
| Total | 73 (100.0%) | 70.0 |
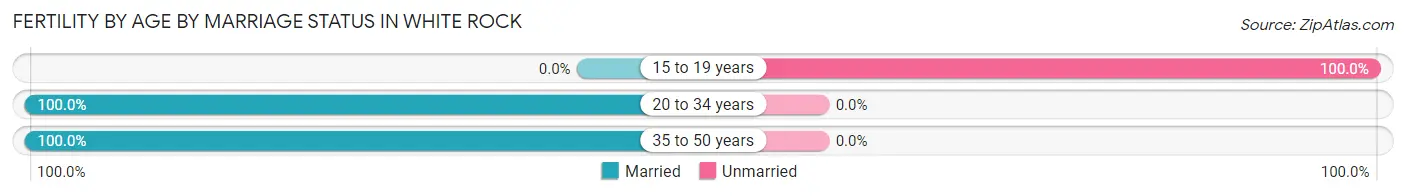
Fertility by Age by Marriage Status in White Rock
79.5% of women with births (73) in White Rock are married. The highest percentage of unmarried women with births falls into 15 to 19 years age bracket with 100.0% of them unmarried at the time of birth, while the lowest percentage of unmarried women with births belong to 20 to 34 years age bracket with 0.0% of them unmarried.
| Age Bracket | Married | Unmarried |
| 15 to 19 years | 0 (0.0%) | 15 (100.0%) |
| 20 to 34 years | 37 (100.0%) | 0 (0.0%) |
| 35 to 50 years | 21 (100.0%) | 0 (0.0%) |
| Total | 58 (79.4%) | 15 (20.5%) |
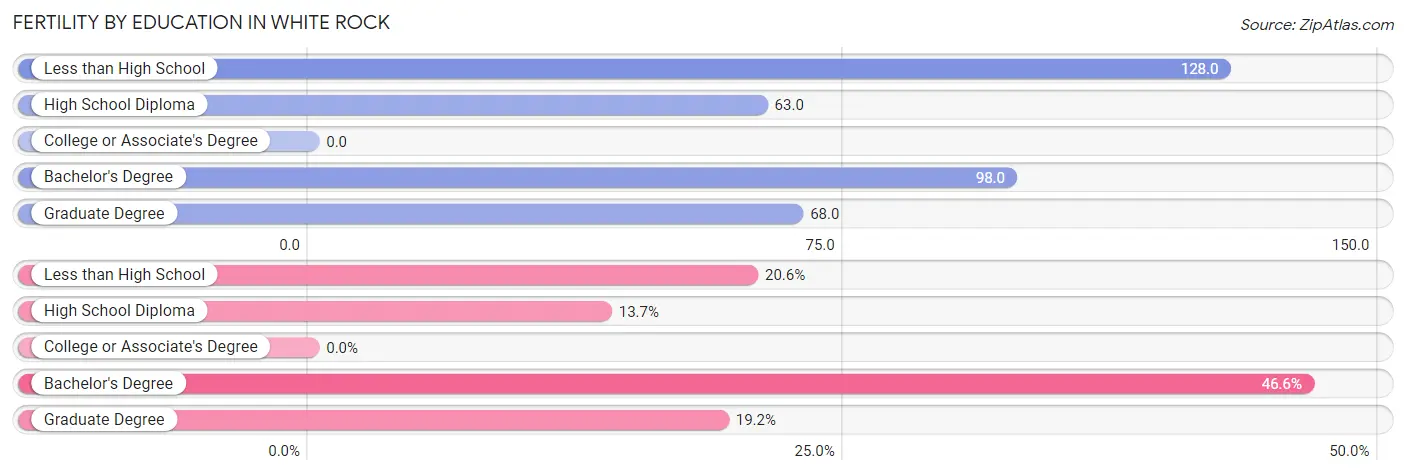
Fertility by Education in White Rock
| Educational Attainment | Women with Births | Births / 1,000 Women |
| Less than High School | 15 (20.5%) | 128.0 |
| High School Diploma | 10 (13.7%) | 63.0 |
| College or Associate's Degree | 0 (0.0%) | 0.0 |
| Bachelor's Degree | 34 (46.6%) | 98.0 |
| Graduate Degree | 14 (19.2%) | 68.0 |
| Total | 73 (100.0%) | 70.0 |
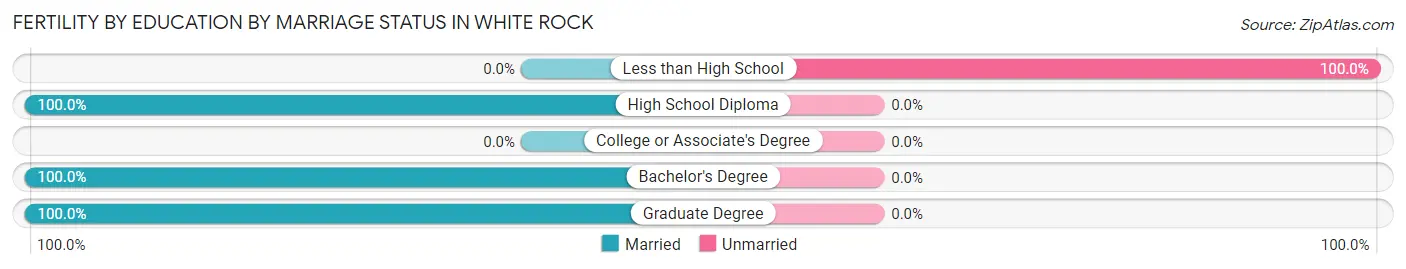
Fertility by Education by Marriage Status in White Rock
20.5% of women with births in White Rock are unmarried. Women with the educational attainment of high school diploma are most likely to be married with 100.0% of them married at childbirth, while women with the educational attainment of less than high school are least likely to be married with 100.0% of them unmarried at childbirth.
| Educational Attainment | Married | Unmarried |
| Less than High School | 0 (0.0%) | 15 (100.0%) |
| High School Diploma | 10 (100.0%) | 0 (0.0%) |
| College or Associate's Degree | 0 (0.0%) | 0 (0.0%) |
| Bachelor's Degree | 34 (100.0%) | 0 (0.0%) |
| Graduate Degree | 14 (100.0%) | 0 (0.0%) |
| Total | 58 (79.4%) | 15 (20.5%) |
Income in White Rock
Income Overview in White Rock
Per Capita Income in White Rock is $66,311, while median incomes of families and households are $153,801 and $144,661 respectively.
| Characteristic | Number | Measure |
| Per Capita Income | 5,592 | $66,311 |
| Median Family Income | 1,553 | $153,801 |
| Mean Family Income | 1,553 | $194,854 |
| Median Household Income | 2,033 | $144,661 |
| Mean Household Income | 2,033 | $178,226 |
| Income Deficit | 1,553 | $0 |
| Wage / Income Gap (%) | 5,592 | 43.05% |
| Wage / Income Gap ($) | 5,592 | 56.95¢ per $1 |
| Gini / Inequality Index | 5,592 | 0.33 |
Earnings by Sex in White Rock
Average Earnings in White Rock are $81,821, $115,083 for men and $65,536 for women, a difference of 43.0%.
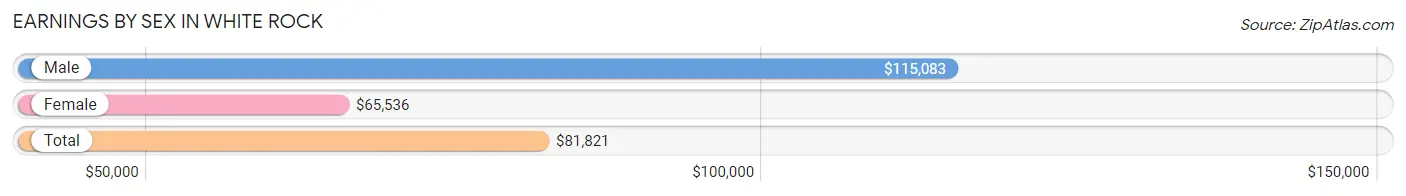
| Sex | Number | Average Earnings |
| Male | 1,498 (54.2%) | $115,083 |
| Female | 1,267 (45.8%) | $65,536 |
| Total | 2,765 (100.0%) | $81,821 |
Earnings by Sex by Income Bracket in White Rock
The most common earnings brackets in White Rock are $100,000+ for men (880 | 58.7%) and $100,000+ for women (267 | 21.1%).
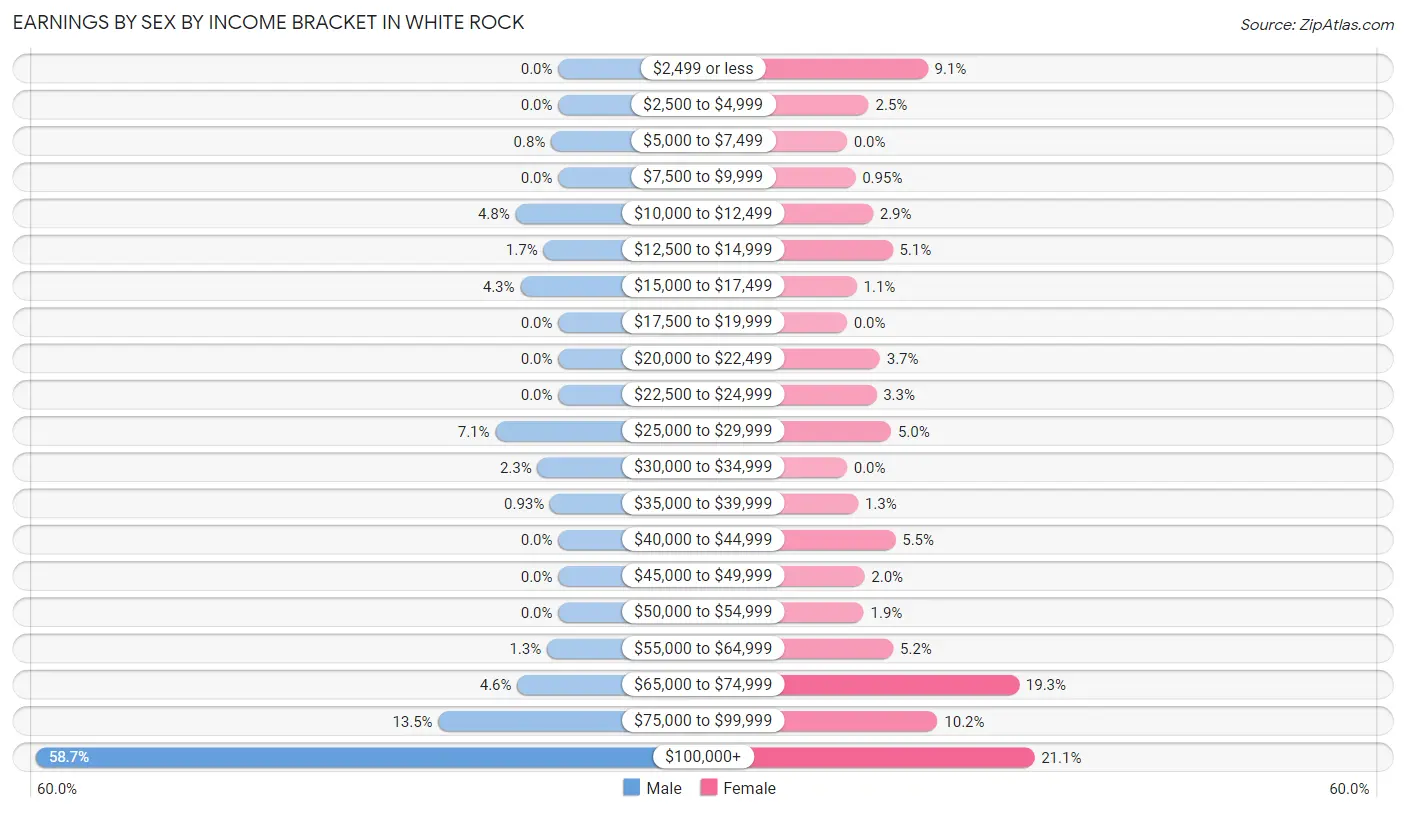
| Income | Male | Female |
| $2,499 or less | 0 (0.0%) | 115 (9.1%) |
| $2,500 to $4,999 | 0 (0.0%) | 31 (2.5%) |
| $5,000 to $7,499 | 12 (0.8%) | 0 (0.0%) |
| $7,500 to $9,999 | 0 (0.0%) | 12 (0.9%) |
| $10,000 to $12,499 | 72 (4.8%) | 37 (2.9%) |
| $12,500 to $14,999 | 25 (1.7%) | 65 (5.1%) |
| $15,000 to $17,499 | 64 (4.3%) | 14 (1.1%) |
| $17,500 to $19,999 | 0 (0.0%) | 0 (0.0%) |
| $20,000 to $22,499 | 0 (0.0%) | 47 (3.7%) |
| $22,500 to $24,999 | 0 (0.0%) | 42 (3.3%) |
| $25,000 to $29,999 | 106 (7.1%) | 63 (5.0%) |
| $30,000 to $34,999 | 35 (2.3%) | 0 (0.0%) |
| $35,000 to $39,999 | 14 (0.9%) | 16 (1.3%) |
| $40,000 to $44,999 | 0 (0.0%) | 69 (5.4%) |
| $45,000 to $49,999 | 0 (0.0%) | 25 (2.0%) |
| $50,000 to $54,999 | 0 (0.0%) | 24 (1.9%) |
| $55,000 to $64,999 | 19 (1.3%) | 66 (5.2%) |
| $65,000 to $74,999 | 69 (4.6%) | 245 (19.3%) |
| $75,000 to $99,999 | 202 (13.5%) | 129 (10.2%) |
| $100,000+ | 880 (58.7%) | 267 (21.1%) |
| Total | 1,498 (100.0%) | 1,267 (100.0%) |
Earnings by Sex by Educational Attainment in White Rock
Average earnings in White Rock are $123,036 for men and $68,050 for women, a difference of 44.7%. Men with an educational attainment of graduate degree enjoy the highest average annual earnings of $139,362, while those with college or associate's degree education earn the least with $94,659. Women with an educational attainment of graduate degree earn the most with the average annual earnings of $80,461, while those with bachelor's degree education have the smallest earnings of $65,069.
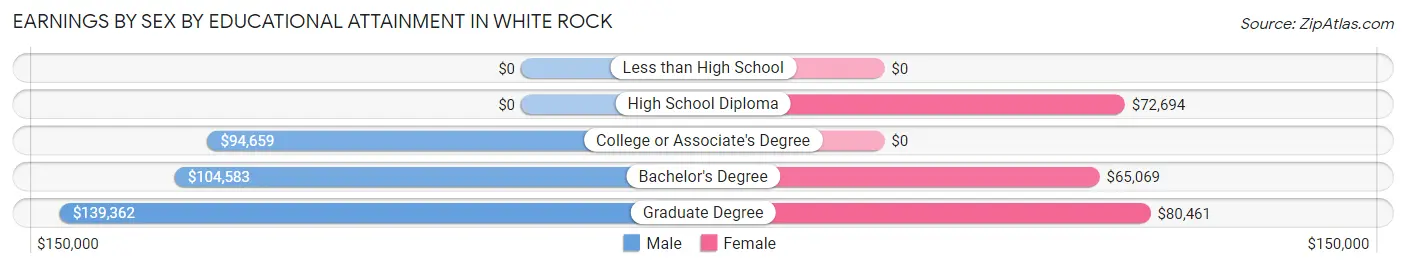
| Educational Attainment | Male Income | Female Income |
| Less than High School | - | - |
| High School Diploma | - | - |
| College or Associate's Degree | $94,659 | $0 |
| Bachelor's Degree | $104,583 | $65,069 |
| Graduate Degree | $139,362 | $80,461 |
| Total | $123,036 | $68,050 |
Family Income in White Rock
Family Income Brackets in White Rock
According to the White Rock family income data, there are 570 families falling into the $200,000+ income range, which is the most common income bracket and makes up 36.7% of all families.
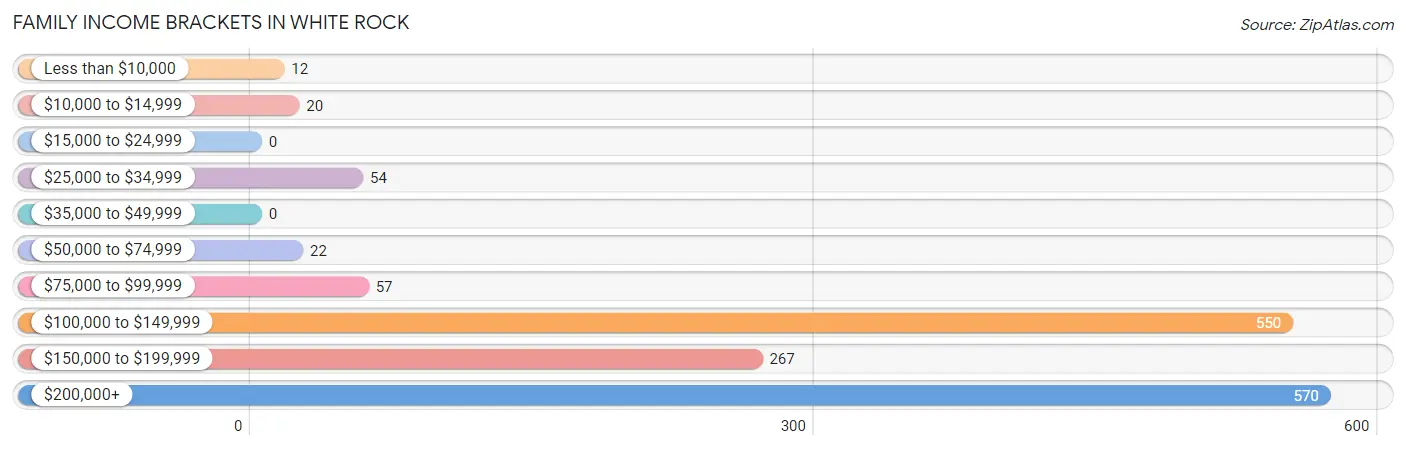
| Income Bracket | # Families | % Families |
| Less than $10,000 | 12 | 0.8% |
| $10,000 to $14,999 | 20 | 1.3% |
| $15,000 to $24,999 | 0 | 0.0% |
| $25,000 to $34,999 | 54 | 3.5% |
| $35,000 to $49,999 | 0 | 0.0% |
| $50,000 to $74,999 | 22 | 1.4% |
| $75,000 to $99,999 | 57 | 3.7% |
| $100,000 to $149,999 | 550 | 35.4% |
| $150,000 to $199,999 | 267 | 17.2% |
| $200,000+ | 570 | 36.7% |
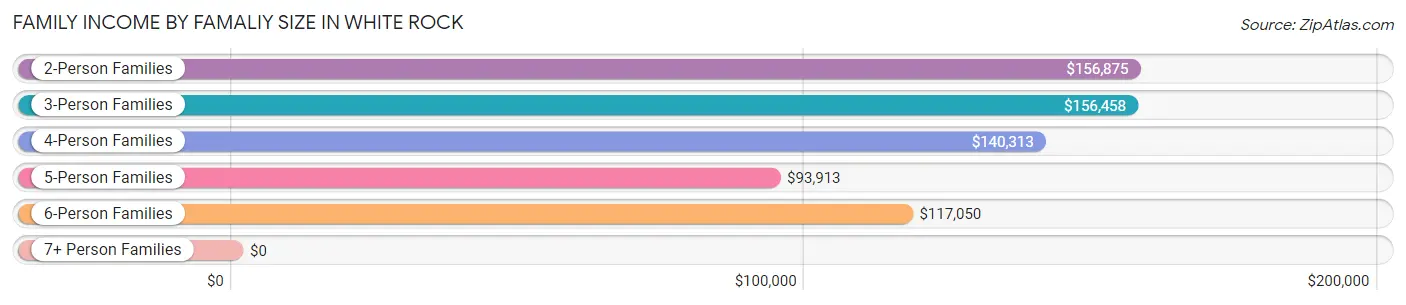
Family Income by Famaliy Size in White Rock
2-person families (722 | 46.5%) account for the highest median family income in White Rock with $156,875 per family, while 2-person families (722 | 46.5%) have the highest median income of $78,438 per family member.
| Income Bracket | # Families | Median Income |
| 2-Person Families | 722 (46.5%) | $156,875 |
| 3-Person Families | 296 (19.1%) | $156,458 |
| 4-Person Families | 400 (25.8%) | $140,313 |
| 5-Person Families | 84 (5.4%) | $93,913 |
| 6-Person Families | 41 (2.6%) | $117,050 |
| 7+ Person Families | 10 (0.6%) | $0 |
| Total | 1,553 (100.0%) | $153,801 |
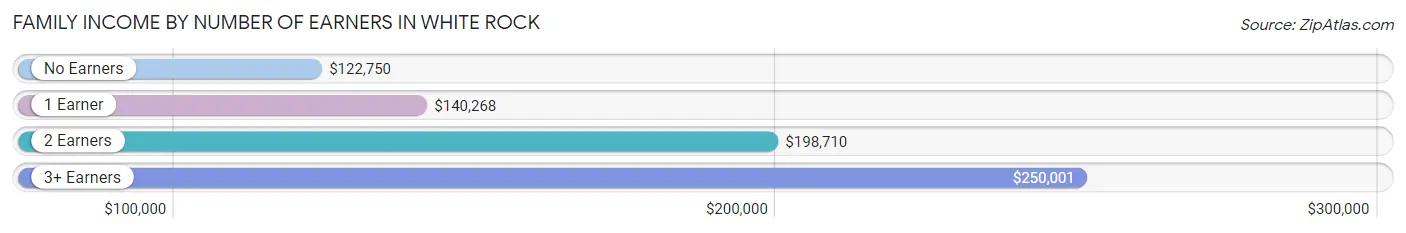
Family Income by Number of Earners in White Rock
The median family income in White Rock is $153,801, with families comprising 3+ earners (27) having the highest median family income of $250,001, while families with no earners (223) have the lowest median family income of $122,750, accounting for 1.7% and 14.4% of families, respectively.
| Number of Earners | # Families | Median Income |
| No Earners | 223 (14.4%) | $122,750 |
| 1 Earner | 421 (27.1%) | $140,268 |
| 2 Earners | 882 (56.8%) | $198,710 |
| 3+ Earners | 27 (1.7%) | $250,001 |
| Total | 1,553 (100.0%) | $153,801 |
Household Income in White Rock
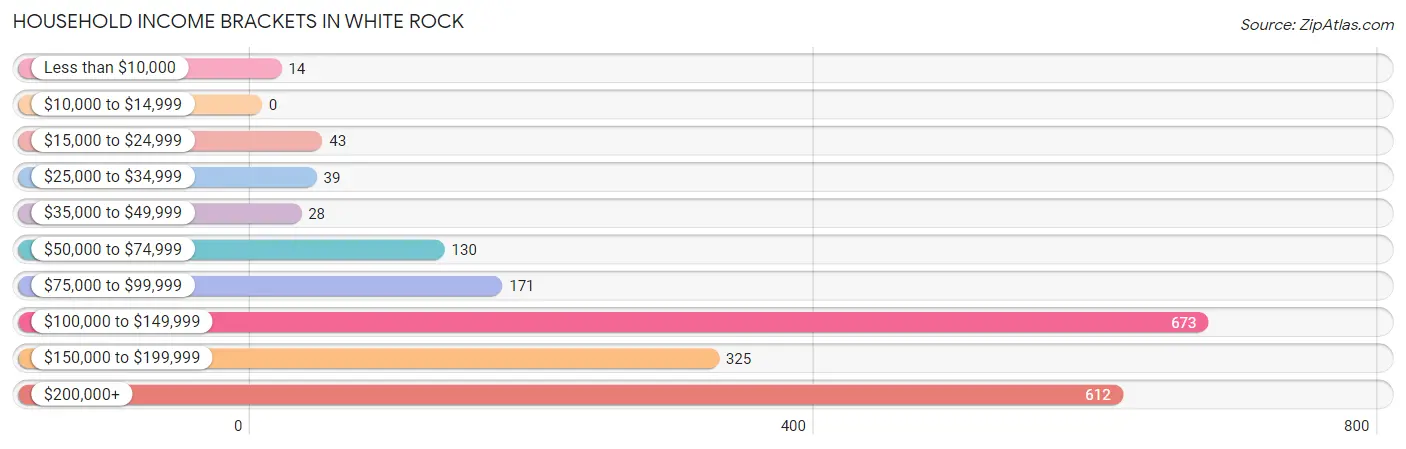
Household Income Brackets in White Rock
With 673 households falling in the category, the $100,000 to $149,999 income range is the most frequent in White Rock, accounting for 33.1% of all households.
| Income Bracket | # Households | % Households |
| Less than $10,000 | 14 | 0.7% |
| $10,000 to $14,999 | 0 | 0.0% |
| $15,000 to $24,999 | 43 | 2.1% |
| $25,000 to $34,999 | 39 | 1.9% |
| $35,000 to $49,999 | 28 | 1.4% |
| $50,000 to $74,999 | 130 | 6.4% |
| $75,000 to $99,999 | 171 | 8.4% |
| $100,000 to $149,999 | 673 | 33.1% |
| $150,000 to $199,999 | 325 | 16.0% |
| $200,000+ | 612 | 30.1% |
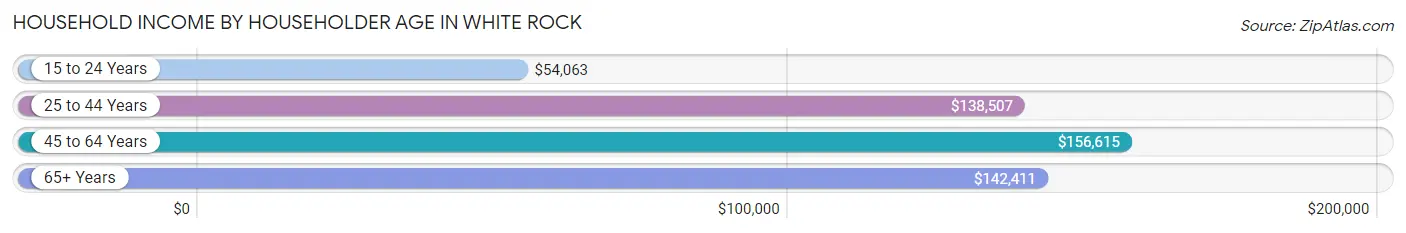
Household Income by Householder Age in White Rock
The median household income in White Rock is $144,661, with the highest median household income of $156,615 found in the 45 to 64 years age bracket for the primary householder. A total of 709 households (34.9%) fall into this category. Meanwhile, the 15 to 24 years age bracket for the primary householder has the lowest median household income of $54,063, with 73 households (3.6%) in this group.
| Income Bracket | # Households | Median Income |
| 15 to 24 Years | 73 (3.6%) | $54,063 |
| 25 to 44 Years | 659 (32.4%) | $138,507 |
| 45 to 64 Years | 709 (34.9%) | $156,615 |
| 65+ Years | 592 (29.1%) | $142,411 |
| Total | 2,033 (100.0%) | $144,661 |
Poverty in White Rock
Income Below Poverty by Sex and Age in White Rock
With 0.6% poverty level for males and 3.3% for females among the residents of White Rock, 35 to 44 year old males and 18 to 24 year old females are the most vulnerable to poverty, with 12 males (2.2%) and 44 females (23.8%) in their respective age groups living below the poverty level.
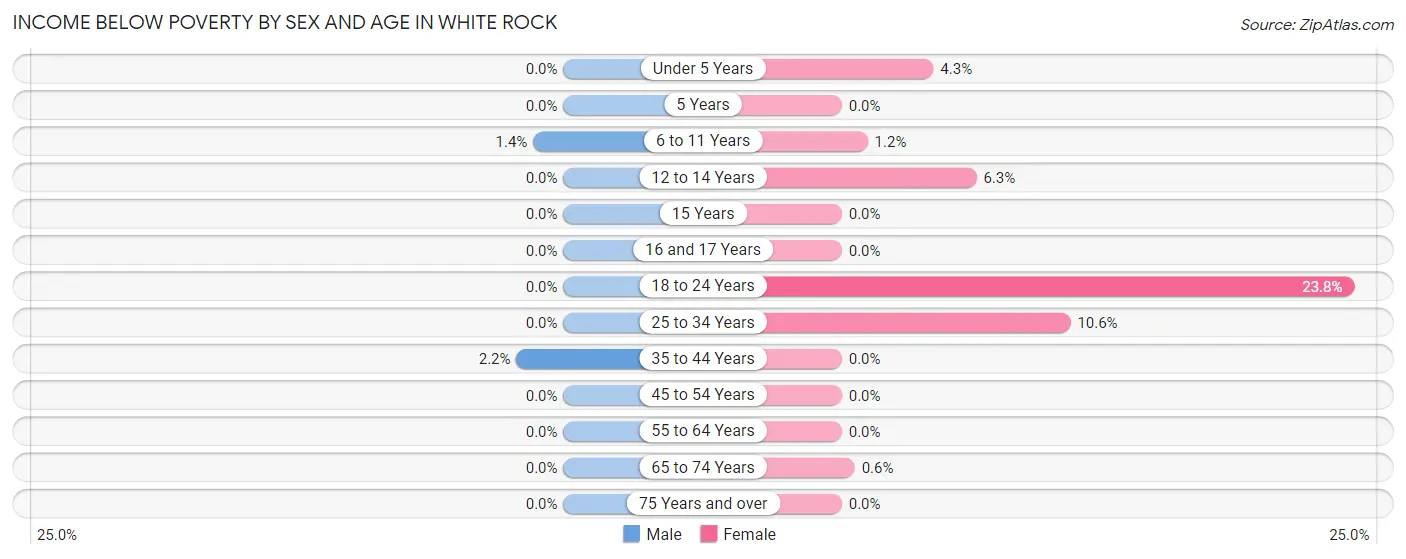
| Age Bracket | Male | Female |
| Under 5 Years | 0 (0.0%) | 11 (4.3%) |
| 5 Years | 0 (0.0%) | 0 (0.0%) |
| 6 to 11 Years | 5 (1.4%) | 4 (1.2%) |
| 12 to 14 Years | 0 (0.0%) | 5 (6.2%) |
| 15 Years | 0 (0.0%) | 0 (0.0%) |
| 16 and 17 Years | 0 (0.0%) | 0 (0.0%) |
| 18 to 24 Years | 0 (0.0%) | 44 (23.8%) |
| 25 to 34 Years | 0 (0.0%) | 28 (10.6%) |
| 35 to 44 Years | 12 (2.2%) | 0 (0.0%) |
| 45 to 54 Years | 0 (0.0%) | 0 (0.0%) |
| 55 to 64 Years | 0 (0.0%) | 0 (0.0%) |
| 65 to 74 Years | 0 (0.0%) | 2 (0.6%) |
| 75 Years and over | 0 (0.0%) | 0 (0.0%) |
| Total | 17 (0.6%) | 94 (3.3%) |
Income Above Poverty by Sex and Age in White Rock
According to the poverty statistics in White Rock, males aged under 5 years and females aged 5 years are the age groups that are most secure financially, with 100.0% of males and 100.0% of females in these age groups living above the poverty line.
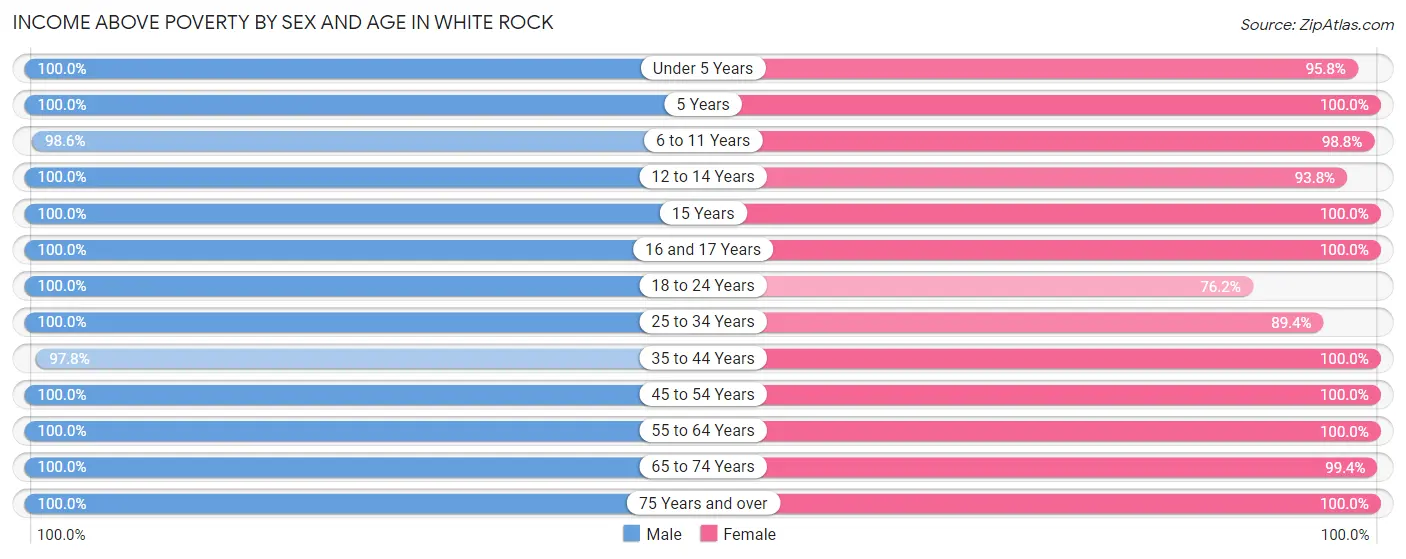
| Age Bracket | Male | Female |
| Under 5 Years | 166 (100.0%) | 248 (95.8%) |
| 5 Years | 41 (100.0%) | 36 (100.0%) |
| 6 to 11 Years | 352 (98.6%) | 328 (98.8%) |
| 12 to 14 Years | 58 (100.0%) | 75 (93.8%) |
| 15 Years | 6 (100.0%) | 34 (100.0%) |
| 16 and 17 Years | 78 (100.0%) | 57 (100.0%) |
| 18 to 24 Years | 98 (100.0%) | 141 (76.2%) |
| 25 to 34 Years | 228 (100.0%) | 236 (89.4%) |
| 35 to 44 Years | 539 (97.8%) | 382 (100.0%) |
| 45 to 54 Years | 246 (100.0%) | 280 (100.0%) |
| 55 to 64 Years | 398 (100.0%) | 405 (100.0%) |
| 65 to 74 Years | 292 (100.0%) | 333 (99.4%) |
| 75 Years and over | 189 (100.0%) | 235 (100.0%) |
| Total | 2,691 (99.4%) | 2,790 (96.7%) |
Income Below Poverty Among Married-Couple Families in White Rock
The poverty statistics for married-couple families in White Rock show that 0.8% or 12 of the total 1,444 families live below the poverty line. Families with 3 or 4 children have the highest poverty rate of 10.3%, comprising of 12 families. On the other hand, families with no children have the lowest poverty rate of 0.0%, which includes 0 families.
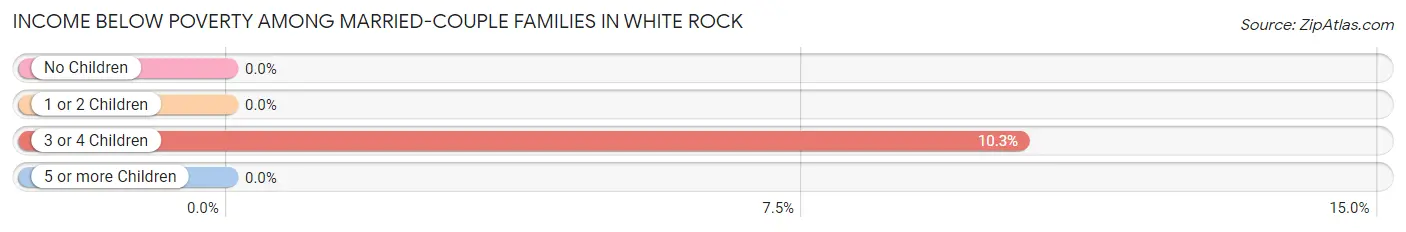
| Children | Above Poverty | Below Poverty |
| No Children | 778 (100.0%) | 0 (0.0%) |
| 1 or 2 Children | 540 (100.0%) | 0 (0.0%) |
| 3 or 4 Children | 104 (89.7%) | 12 (10.3%) |
| 5 or more Children | 10 (100.0%) | 0 (0.0%) |
| Total | 1,432 (99.2%) | 12 (0.8%) |
Income Below Poverty Among Single-Parent Households in White Rock
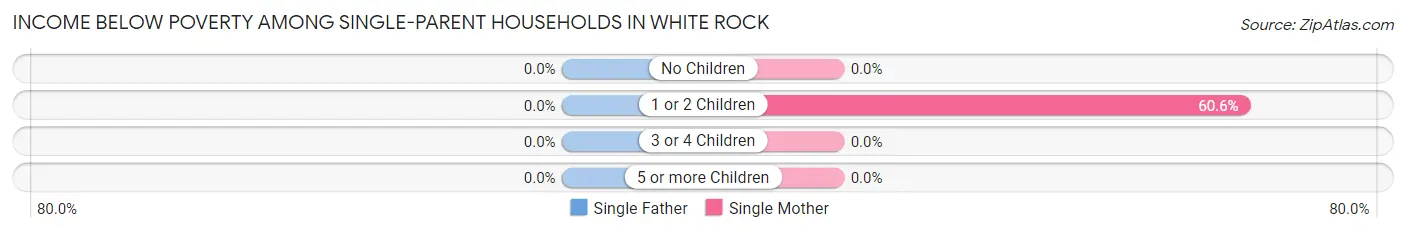
| Children | Single Father | Single Mother |
| No Children | 0 (0.0%) | 0 (0.0%) |
| 1 or 2 Children | 0 (0.0%) | 20 (60.6%) |
| 3 or 4 Children | 0 (0.0%) | 0 (0.0%) |
| 5 or more Children | 0 (0.0%) | 0 (0.0%) |
| Total | 0 (0.0%) | 20 (47.6%) |
Income Below Poverty Among Married-Couple vs Single-Parent Households in White Rock
The poverty data for White Rock shows that 12 of the married-couple family households (0.8%) and 20 of the single-parent households (18.3%) are living below the poverty level. Within the married-couple family households, those with 3 or 4 children have the highest poverty rate, with 12 households (10.3%) falling below the poverty line. Among the single-parent households, those with 1 or 2 children have the highest poverty rate, with 20 household (44.4%) living below poverty.
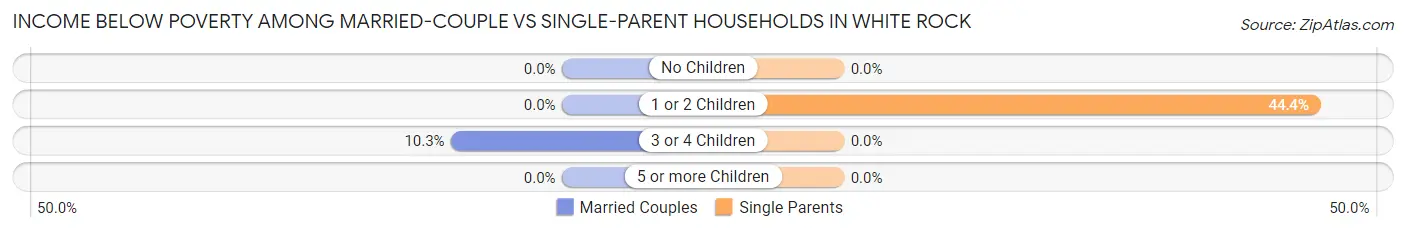
| Children | Married-Couple Families | Single-Parent Households |
| No Children | 0 (0.0%) | 0 (0.0%) |
| 1 or 2 Children | 0 (0.0%) | 20 (44.4%) |
| 3 or 4 Children | 12 (10.3%) | 0 (0.0%) |
| 5 or more Children | 0 (0.0%) | 0 (0.0%) |
| Total | 12 (0.8%) | 20 (18.3%) |
Employment Characteristics in White Rock
Employment by Class of Employer in White Rock
Among the 2,559 employed individuals in White Rock, federal government employees (862 | 33.7%), private company employees (831 | 32.5%), and local government employees (428 | 16.7%) make up the most common classes of employment.
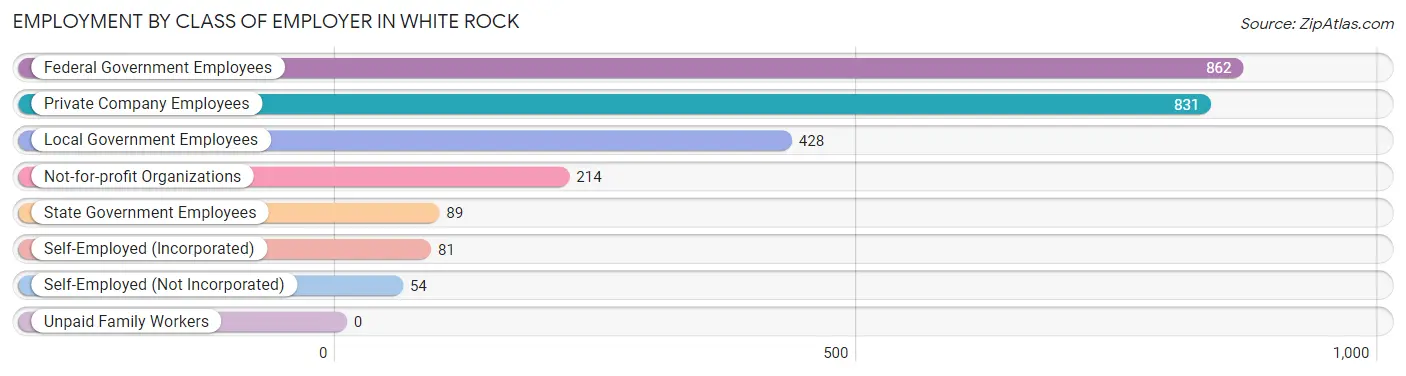
| Employer Class | # Employees | % Employees |
| Private Company Employees | 831 | 32.5% |
| Self-Employed (Incorporated) | 81 | 3.2% |
| Self-Employed (Not Incorporated) | 54 | 2.1% |
| Not-for-profit Organizations | 214 | 8.4% |
| Local Government Employees | 428 | 16.7% |
| State Government Employees | 89 | 3.5% |
| Federal Government Employees | 862 | 33.7% |
| Unpaid Family Workers | 0 | 0.0% |
| Total | 2,559 | 100.0% |
Employment Status by Age in White Rock
According to the labor force statistics for White Rock, out of the total population over 16 years of age (4,223), 63.0% or 2,660 individuals are in the labor force, with 2.3% or 61 of them unemployed. The age group with the highest labor force participation rate is 25 to 29 years, with 91.7% or 243 individuals in the labor force. Within the labor force, the 16 to 19 years age range has the highest percentage of unemployed individuals, with 50.0% or 6 of them being unemployed.
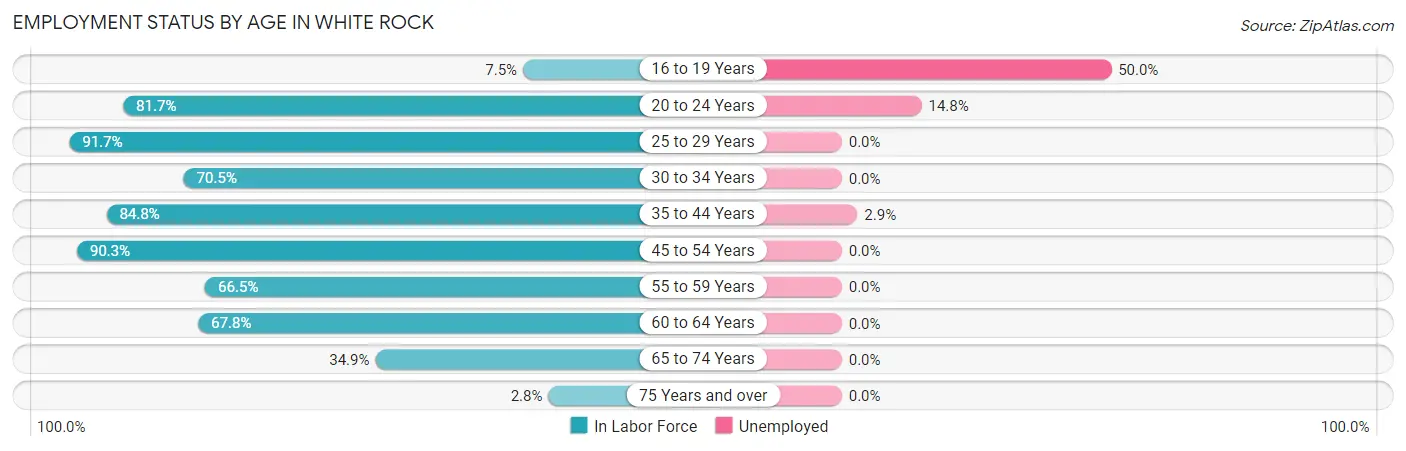
| Age Bracket | In Labor Force | Unemployed |
| 16 to 19 Years | 12 (7.5%) | 6 (50.0%) |
| 20 to 24 Years | 210 (81.7%) | 31 (14.8%) |
| 25 to 29 Years | 243 (91.7%) | 0 (0.0%) |
| 30 to 34 Years | 160 (70.5%) | 0 (0.0%) |
| 35 to 44 Years | 791 (84.8%) | 23 (2.9%) |
| 45 to 54 Years | 475 (90.3%) | 0 (0.0%) |
| 55 to 59 Years | 210 (66.5%) | 0 (0.0%) |
| 60 to 64 Years | 330 (67.8%) | 0 (0.0%) |
| 65 to 74 Years | 219 (34.9%) | 0 (0.0%) |
| 75 Years and over | 12 (2.8%) | 0 (0.0%) |
| Total | 2,660 (63.0%) | 61 (2.3%) |
Employment Status by Educational Attainment in White Rock
According to labor force statistics for White Rock, 80.2% of individuals (2,209) out of the total population between 25 and 64 years of age (2,754) are in the labor force, with 1.0% or 22 of them being unemployed. The group with the highest labor force participation rate are those with the educational attainment of bachelor's degree or higher, with 87.3% or 1,648 individuals in the labor force. Within the labor force, individuals with bachelor's degree or higher education have the highest percentage of unemployment, with 1.4% or 23 of them being unemployed.
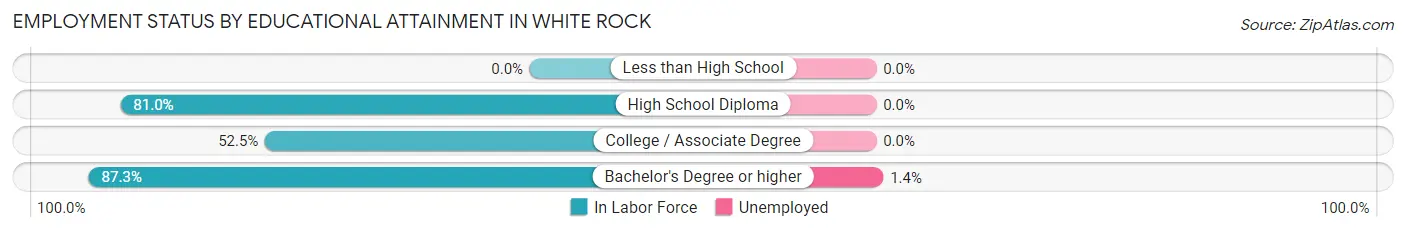
| Educational Attainment | In Labor Force | Unemployed |
| Less than High School | 0 (0.0%) | 0 (0.0%) |
| High School Diploma | 299 (81.0%) | 0 (0.0%) |
| College / Associate Degree | 261 (52.5%) | 0 (0.0%) |
| Bachelor's Degree or higher | 1,648 (87.3%) | 26 (1.4%) |
| Total | 2,209 (80.2%) | 28 (1.0%) |
Employment Occupations by Sex in White Rock
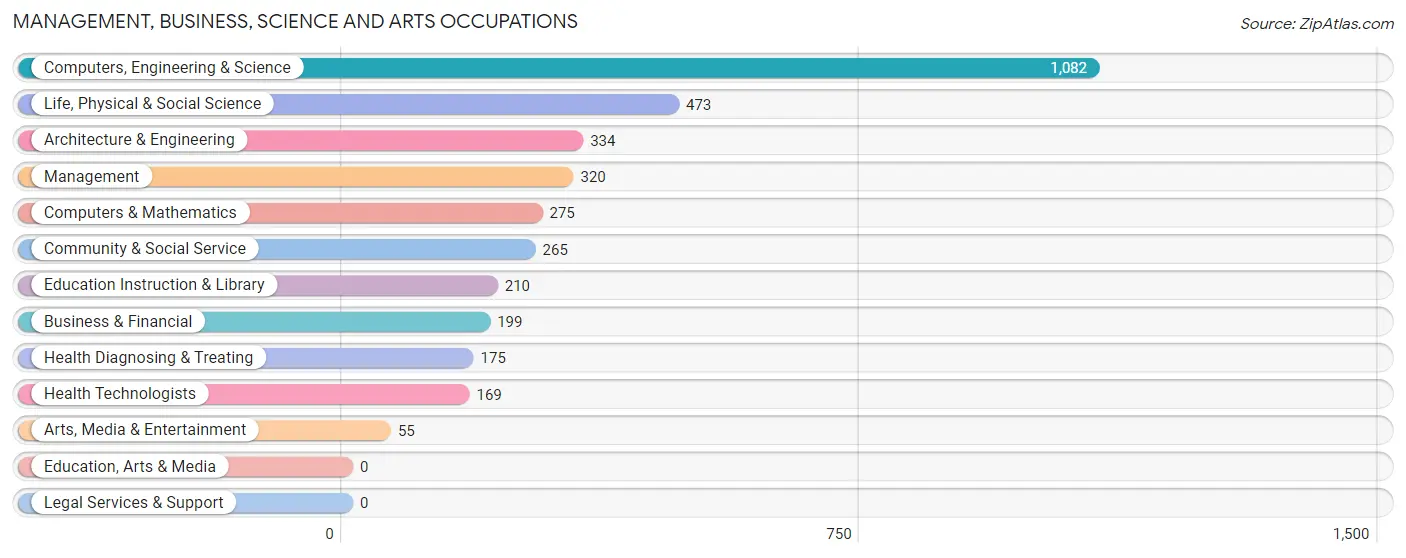
Management, Business, Science and Arts Occupations
The most common Management, Business, Science and Arts occupations in White Rock are Computers, Engineering & Science (1,082 | 41.6%), Life, Physical & Social Science (473 | 18.2%), Architecture & Engineering (334 | 12.8%), Management (320 | 12.3%), and Computers & Mathematics (275 | 10.6%).
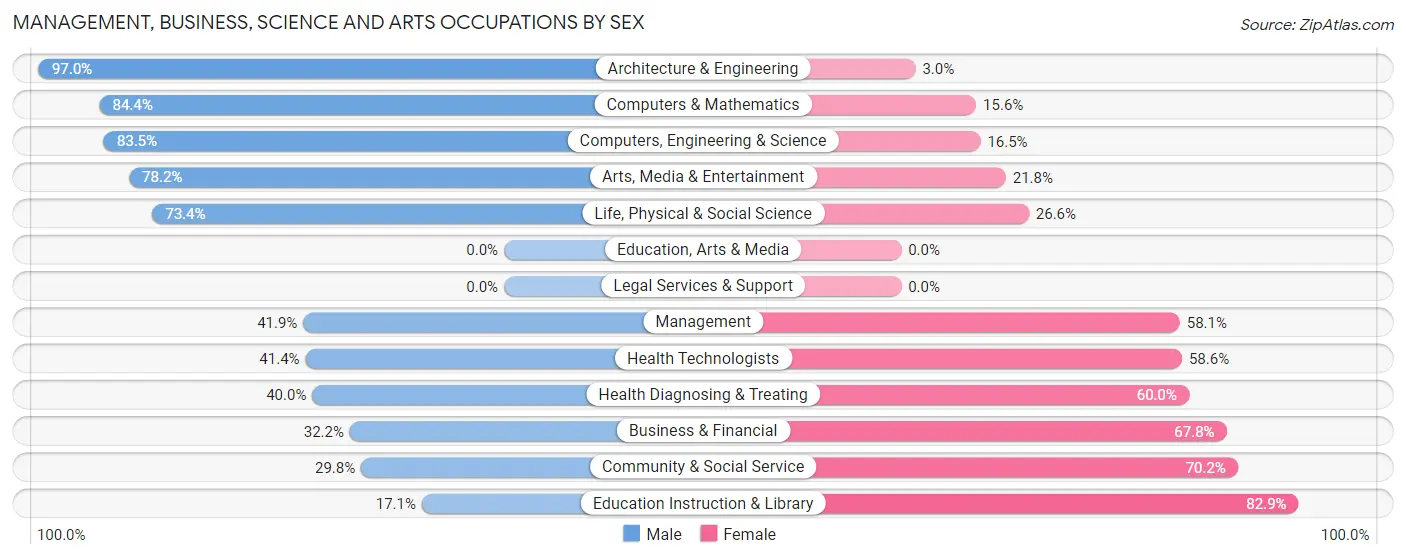
Management, Business, Science and Arts Occupations by Sex
Within the Management, Business, Science and Arts occupations in White Rock, the most male-oriented occupations are Architecture & Engineering (97.0%), Computers & Mathematics (84.4%), and Computers, Engineering & Science (83.5%), while the most female-oriented occupations are Education Instruction & Library (82.9%), Community & Social Service (70.2%), and Business & Financial (67.8%).
| Occupation | Male | Female |
| Management | 134 (41.9%) | 186 (58.1%) |
| Business & Financial | 64 (32.2%) | 135 (67.8%) |
| Computers, Engineering & Science | 903 (83.5%) | 179 (16.5%) |
| Computers & Mathematics | 232 (84.4%) | 43 (15.6%) |
| Architecture & Engineering | 324 (97.0%) | 10 (3.0%) |
| Life, Physical & Social Science | 347 (73.4%) | 126 (26.6%) |
| Community & Social Service | 79 (29.8%) | 186 (70.2%) |
| Education, Arts & Media | 0 (0.0%) | 0 (0.0%) |
| Legal Services & Support | 0 (0.0%) | 0 (0.0%) |
| Education Instruction & Library | 36 (17.1%) | 174 (82.9%) |
| Arts, Media & Entertainment | 43 (78.2%) | 12 (21.8%) |
| Health Diagnosing & Treating | 70 (40.0%) | 105 (60.0%) |
| Health Technologists | 70 (41.4%) | 99 (58.6%) |
| Total (Category) | 1,250 (61.2%) | 791 (38.8%) |
| Total (Overall) | 1,413 (54.3%) | 1,189 (45.7%) |
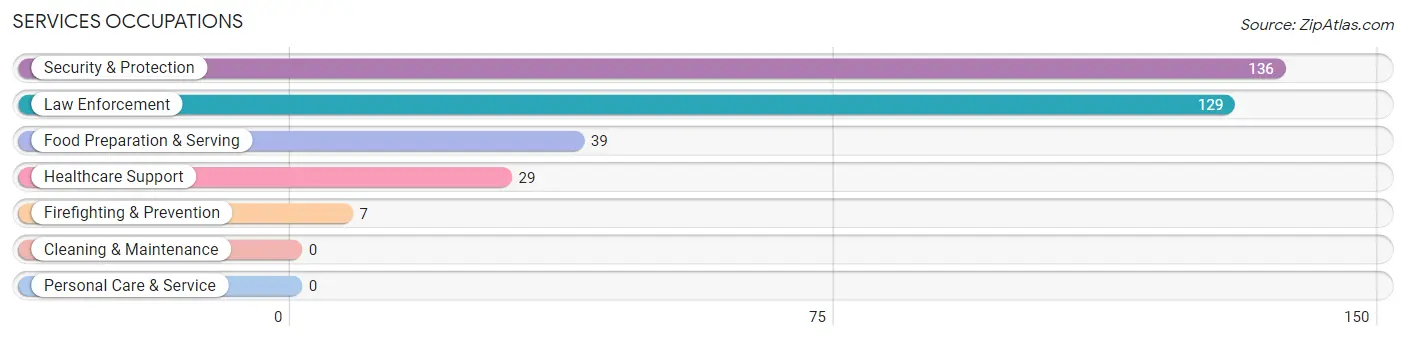
Services Occupations
The most common Services occupations in White Rock are Security & Protection (136 | 5.2%), Law Enforcement (129 | 5.0%), Food Preparation & Serving (39 | 1.5%), Healthcare Support (29 | 1.1%), and Firefighting & Prevention (7 | 0.3%).
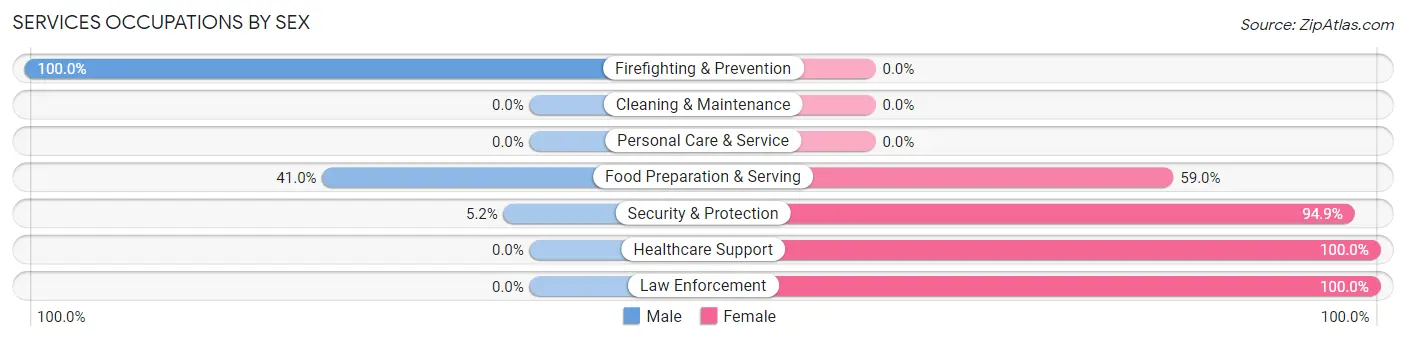
Services Occupations by Sex
Within the Services occupations in White Rock, the most male-oriented occupations are Firefighting & Prevention (100.0%), Food Preparation & Serving (41.0%), and Security & Protection (5.1%), while the most female-oriented occupations are Healthcare Support (100.0%), Law Enforcement (100.0%), and Security & Protection (94.9%).
| Occupation | Male | Female |
| Healthcare Support | 0 (0.0%) | 29 (100.0%) |
| Security & Protection | 7 (5.1%) | 129 (94.9%) |
| Firefighting & Prevention | 7 (100.0%) | 0 (0.0%) |
| Law Enforcement | 0 (0.0%) | 129 (100.0%) |
| Food Preparation & Serving | 16 (41.0%) | 23 (59.0%) |
| Cleaning & Maintenance | 0 (0.0%) | 0 (0.0%) |
| Personal Care & Service | 0 (0.0%) | 0 (0.0%) |
| Total (Category) | 23 (11.3%) | 181 (88.7%) |
| Total (Overall) | 1,413 (54.3%) | 1,189 (45.7%) |
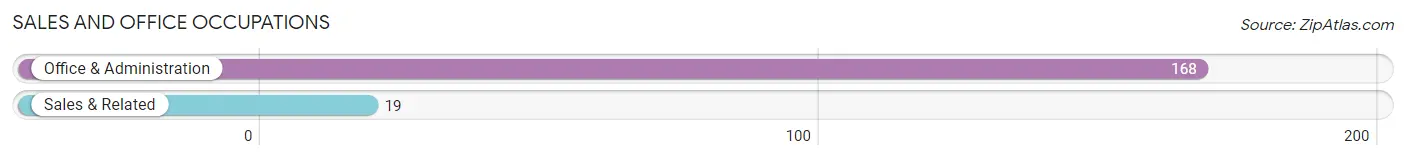
Sales and Office Occupations
The most common Sales and Office occupations in White Rock are Office & Administration (168 | 6.5%), and Sales & Related (19 | 0.7%).
Sales and Office Occupations by Sex
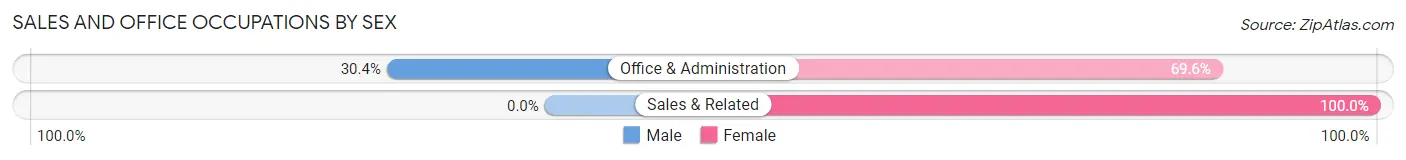
| Occupation | Male | Female |
| Sales & Related | 0 (0.0%) | 19 (100.0%) |
| Office & Administration | 51 (30.4%) | 117 (69.6%) |
| Total (Category) | 51 (27.3%) | 136 (72.7%) |
| Total (Overall) | 1,413 (54.3%) | 1,189 (45.7%) |
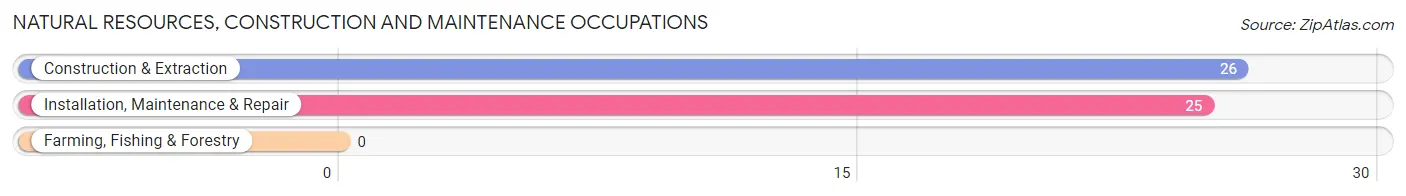
Natural Resources, Construction and Maintenance Occupations
The most common Natural Resources, Construction and Maintenance occupations in White Rock are Construction & Extraction (26 | 1.0%), and Installation, Maintenance & Repair (25 | 1.0%).
Natural Resources, Construction and Maintenance Occupations by Sex
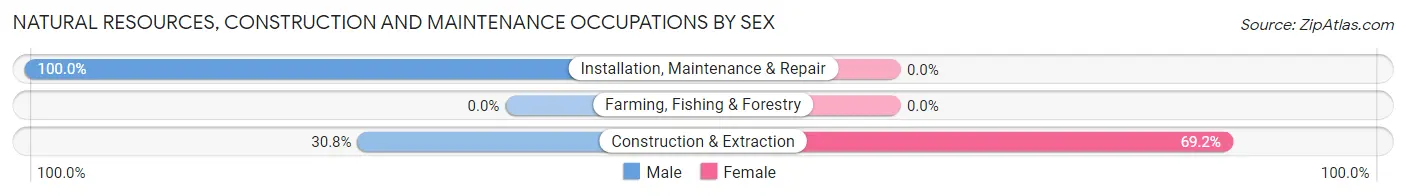
| Occupation | Male | Female |
| Farming, Fishing & Forestry | 0 (0.0%) | 0 (0.0%) |
| Construction & Extraction | 8 (30.8%) | 18 (69.2%) |
| Installation, Maintenance & Repair | 25 (100.0%) | 0 (0.0%) |
| Total (Category) | 33 (64.7%) | 18 (35.3%) |
| Total (Overall) | 1,413 (54.3%) | 1,189 (45.7%) |
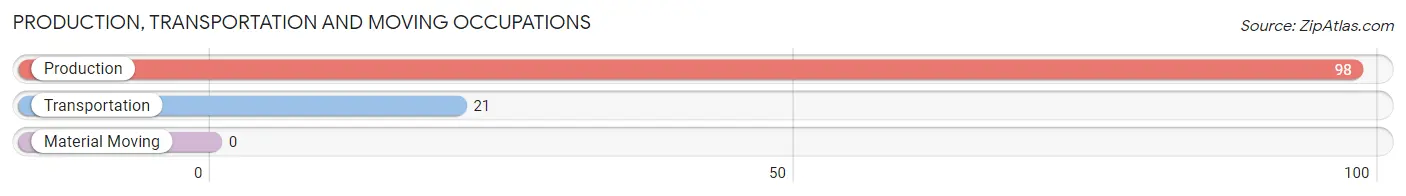
Production, Transportation and Moving Occupations
The most common Production, Transportation and Moving occupations in White Rock are Production (98 | 3.8%), and Transportation (21 | 0.8%).
Production, Transportation and Moving Occupations by Sex
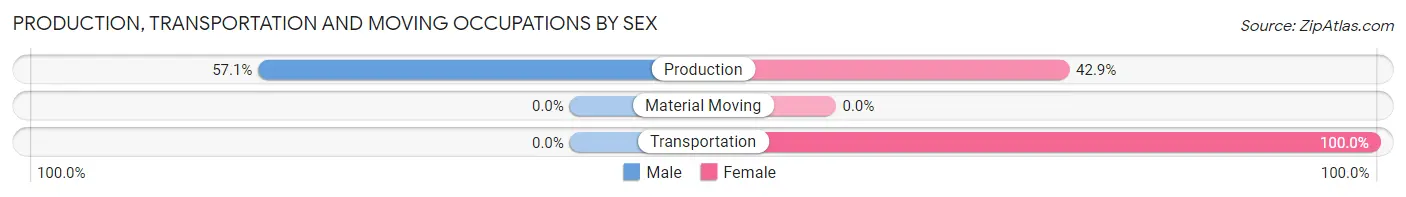
| Occupation | Male | Female |
| Production | 56 (57.1%) | 42 (42.9%) |
| Transportation | 0 (0.0%) | 21 (100.0%) |
| Material Moving | 0 (0.0%) | 0 (0.0%) |
| Total (Category) | 56 (47.1%) | 63 (52.9%) |
| Total (Overall) | 1,413 (54.3%) | 1,189 (45.7%) |
Employment Industries by Sex in White Rock
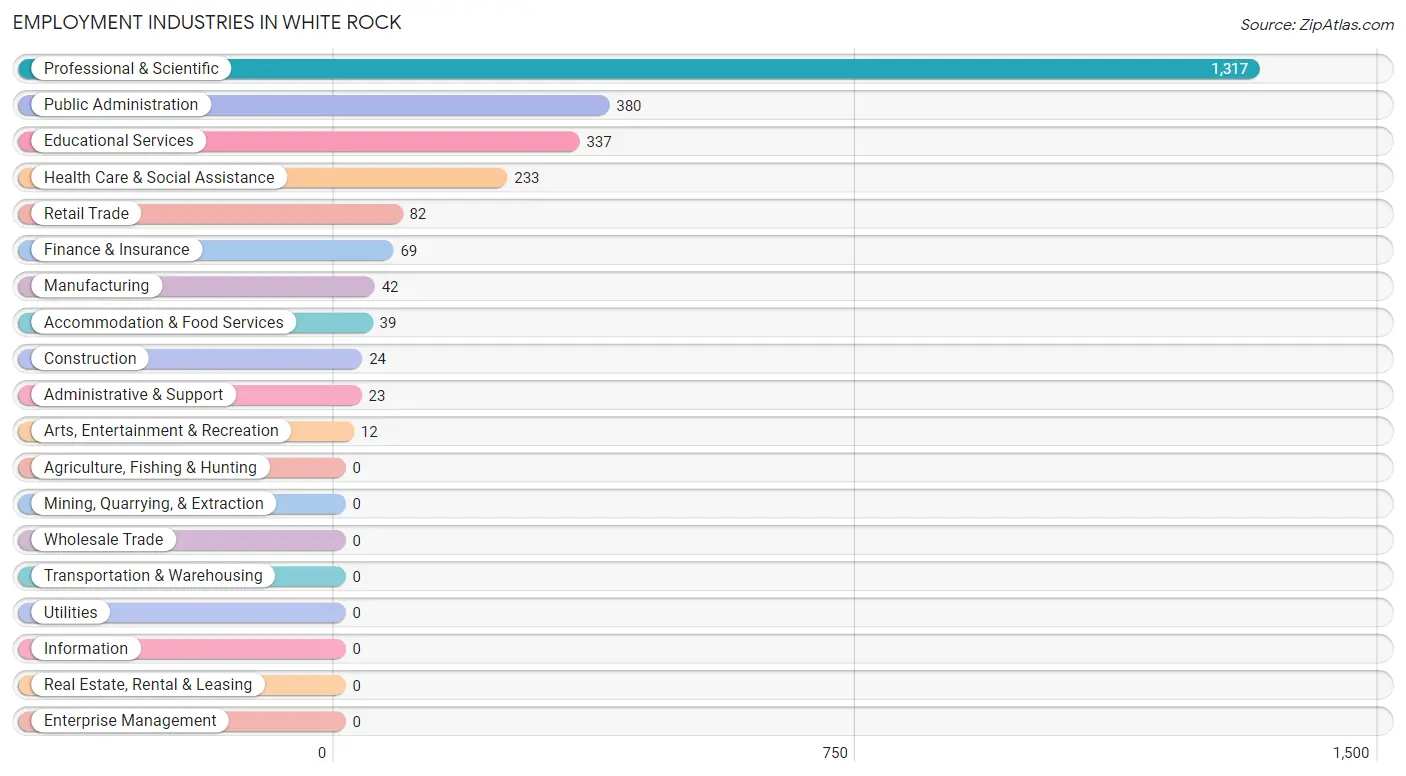
Employment Industries in White Rock
The major employment industries in White Rock include Professional & Scientific (1,317 | 50.6%), Public Administration (380 | 14.6%), Educational Services (337 | 13.0%), Health Care & Social Assistance (233 | 8.9%), and Retail Trade (82 | 3.2%).
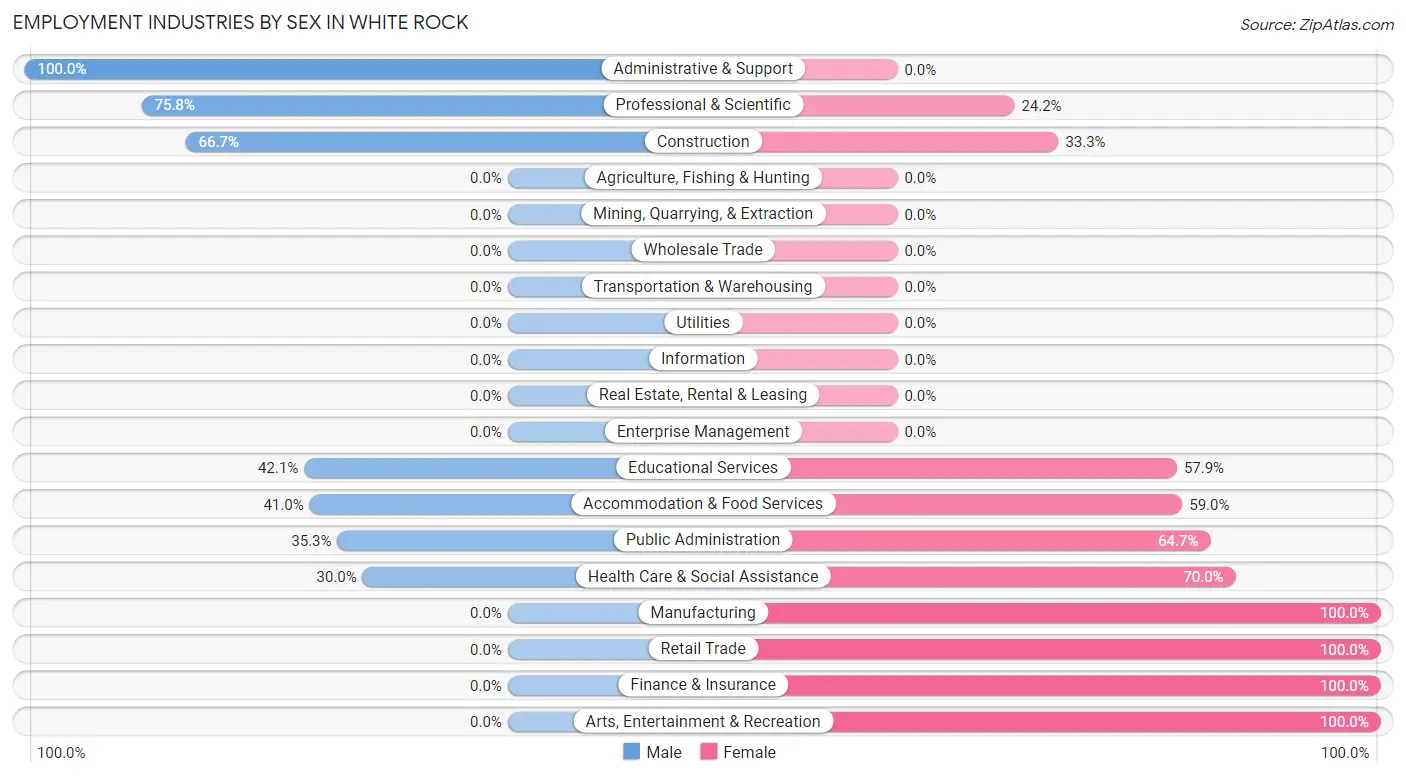
Employment Industries by Sex in White Rock
The White Rock industries that see more men than women are Administrative & Support (100.0%), Professional & Scientific (75.8%), and Construction (66.7%), whereas the industries that tend to have a higher number of women are Manufacturing (100.0%), Retail Trade (100.0%), and Finance & Insurance (100.0%).
| Industry | Male | Female |
| Agriculture, Fishing & Hunting | 0 (0.0%) | 0 (0.0%) |
| Mining, Quarrying, & Extraction | 0 (0.0%) | 0 (0.0%) |
| Construction | 16 (66.7%) | 8 (33.3%) |
| Manufacturing | 0 (0.0%) | 42 (100.0%) |
| Wholesale Trade | 0 (0.0%) | 0 (0.0%) |
| Retail Trade | 0 (0.0%) | 82 (100.0%) |
| Transportation & Warehousing | 0 (0.0%) | 0 (0.0%) |
| Utilities | 0 (0.0%) | 0 (0.0%) |
| Information | 0 (0.0%) | 0 (0.0%) |
| Finance & Insurance | 0 (0.0%) | 69 (100.0%) |
| Real Estate, Rental & Leasing | 0 (0.0%) | 0 (0.0%) |
| Professional & Scientific | 998 (75.8%) | 319 (24.2%) |
| Enterprise Management | 0 (0.0%) | 0 (0.0%) |
| Administrative & Support | 23 (100.0%) | 0 (0.0%) |
| Educational Services | 142 (42.1%) | 195 (57.9%) |
| Health Care & Social Assistance | 70 (30.0%) | 163 (70.0%) |
| Arts, Entertainment & Recreation | 0 (0.0%) | 12 (100.0%) |
| Accommodation & Food Services | 16 (41.0%) | 23 (59.0%) |
| Public Administration | 134 (35.3%) | 246 (64.7%) |
| Total | 1,413 (54.3%) | 1,189 (45.7%) |
Education in White Rock
School Enrollment in White Rock
The most common levels of schooling among the 1,491 students in White Rock are elementary school (429 | 28.8%), middle school (296 | 19.9%), and graduate / professional (258 | 17.3%).
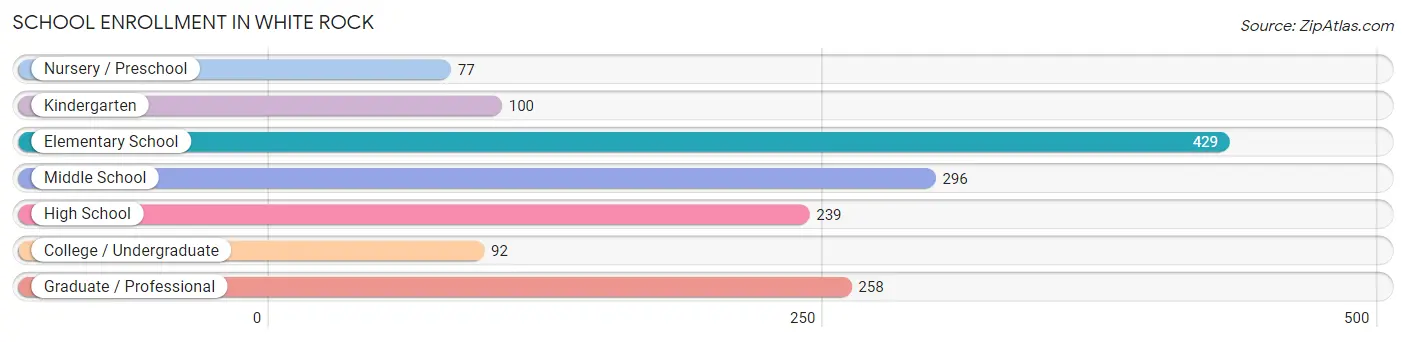
| School Level | # Students | % Students |
| Nursery / Preschool | 77 | 5.2% |
| Kindergarten | 100 | 6.7% |
| Elementary School | 429 | 28.8% |
| Middle School | 296 | 19.9% |
| High School | 239 | 16.0% |
| College / Undergraduate | 92 | 6.2% |
| Graduate / Professional | 258 | 17.3% |
| Total | 1,491 | 100.0% |
School Enrollment by Age by Funding Source in White Rock
Out of a total of 1,491 students who are enrolled in schools in White Rock, 151 (10.1%) attend a private institution, while the remaining 1,340 (89.9%) are enrolled in public schools. The age group of 35 years and over has the highest likelihood of being enrolled in private schools, with 32 (29.6% in the age bracket) enrolled. Conversely, the age group of 10 to 14 year olds has the lowest likelihood of being enrolled in a private school, with 382 (100.0% in the age bracket) attending a public institution.
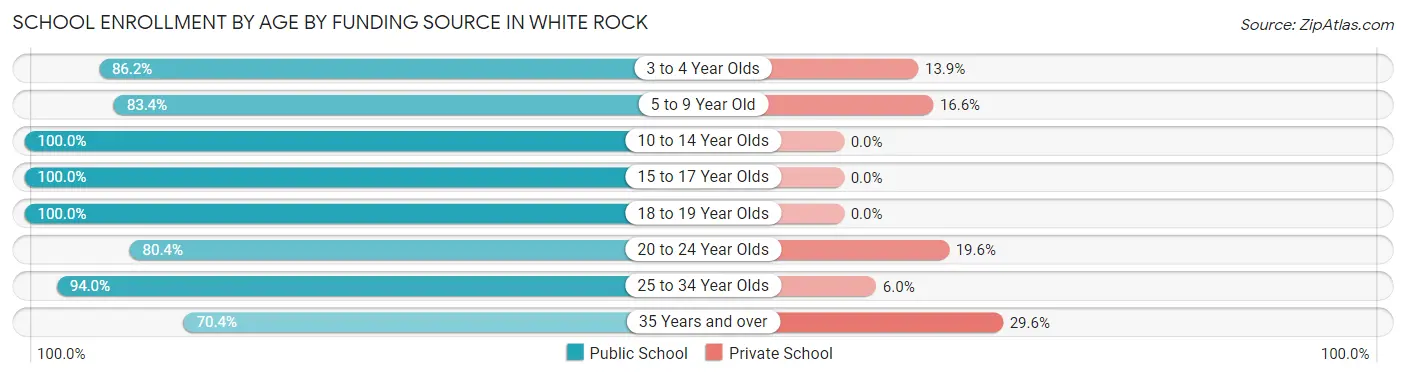
| Age Bracket | Public School | Private School |
| 3 to 4 Year Olds | 56 (86.2%) | 9 (13.9%) |
| 5 to 9 Year Old | 411 (83.4%) | 82 (16.6%) |
| 10 to 14 Year Olds | 382 (100.0%) | 0 (0.0%) |
| 15 to 17 Year Olds | 175 (100.0%) | 0 (0.0%) |
| 18 to 19 Year Olds | 26 (100.0%) | 0 (0.0%) |
| 20 to 24 Year Olds | 74 (80.4%) | 18 (19.6%) |
| 25 to 34 Year Olds | 141 (94.0%) | 9 (6.0%) |
| 35 Years and over | 76 (70.4%) | 32 (29.6%) |
| Total | 1,340 (89.9%) | 151 (10.1%) |
Educational Attainment by Field of Study in White Rock
Physical & health sciences (499 | 16.8%), engineering (466 | 15.7%), computers & mathematics (364 | 12.3%), business (352 | 11.9%), and education (283 | 9.5%) are the most common fields of study among 2,966 individuals in White Rock who have obtained a bachelor's degree or higher.
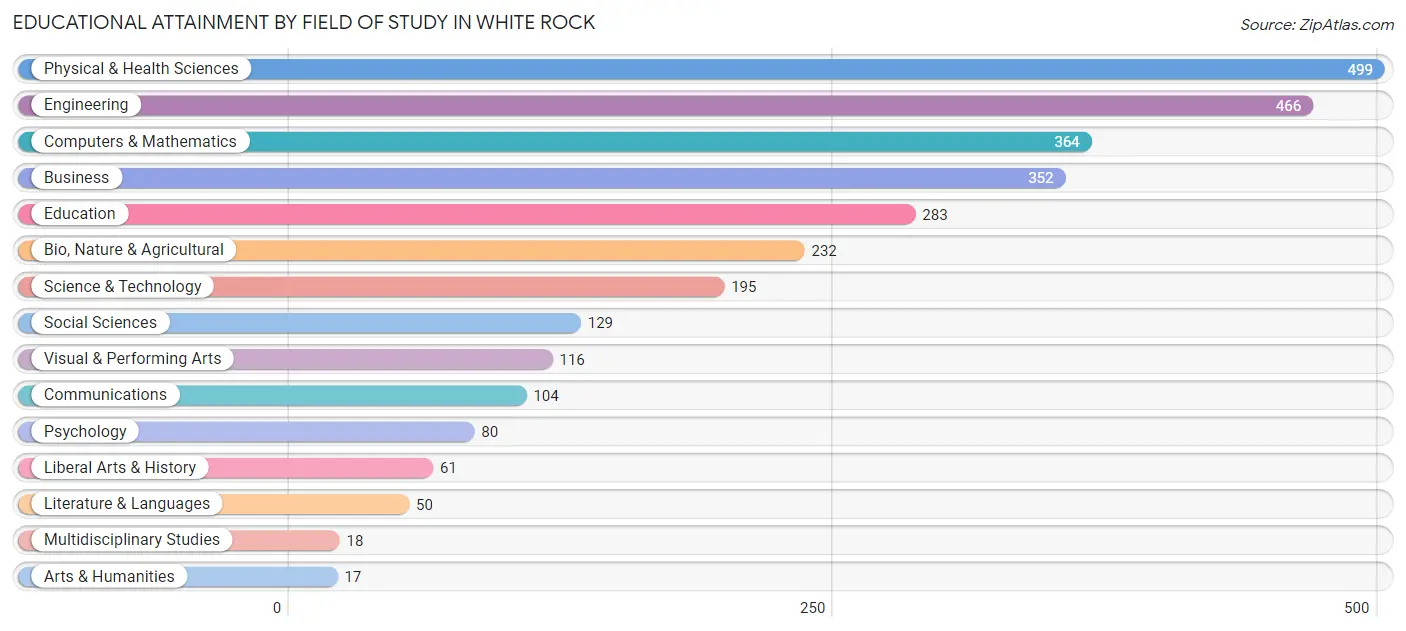
| Field of Study | # Graduates | % Graduates |
| Computers & Mathematics | 364 | 12.3% |
| Bio, Nature & Agricultural | 232 | 7.8% |
| Physical & Health Sciences | 499 | 16.8% |
| Psychology | 80 | 2.7% |
| Social Sciences | 129 | 4.3% |
| Engineering | 466 | 15.7% |
| Multidisciplinary Studies | 18 | 0.6% |
| Science & Technology | 195 | 6.6% |
| Business | 352 | 11.9% |
| Education | 283 | 9.5% |
| Literature & Languages | 50 | 1.7% |
| Liberal Arts & History | 61 | 2.1% |
| Visual & Performing Arts | 116 | 3.9% |
| Communications | 104 | 3.5% |
| Arts & Humanities | 17 | 0.6% |
| Total | 2,966 | 100.0% |
Transportation & Commute in White Rock
Vehicle Availability by Sex in White Rock
The most prevalent vehicle ownership categories in White Rock are males with 2 vehicles (574, accounting for 41.6%) and females with 2 vehicles (328, making up 48.7%).
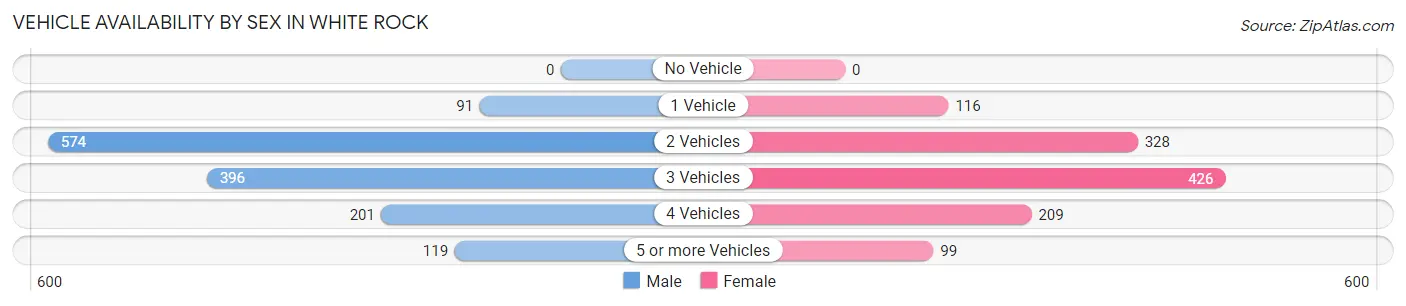
| Vehicles Available | Male | Female |
| No Vehicle | 0 (0.0%) | 0 (0.0%) |
| 1 Vehicle | 91 (6.6%) | 116 (9.9%) |
| 2 Vehicles | 574 (41.6%) | 328 (27.8%) |
| 3 Vehicles | 396 (28.7%) | 426 (36.2%) |
| 4 Vehicles | 201 (14.5%) | 209 (17.7%) |
| 5 or more Vehicles | 119 (8.6%) | 99 (8.4%) |
| Total | 1,381 (100.0%) | 1,178 (100.0%) |
Commute Time in White Rock
The most frequently occuring commute durations in White Rock are 15 to 19 minutes (717 commuters, 31.0%), 20 to 24 minutes (545 commuters, 23.5%), and 30 to 34 minutes (364 commuters, 15.7%).
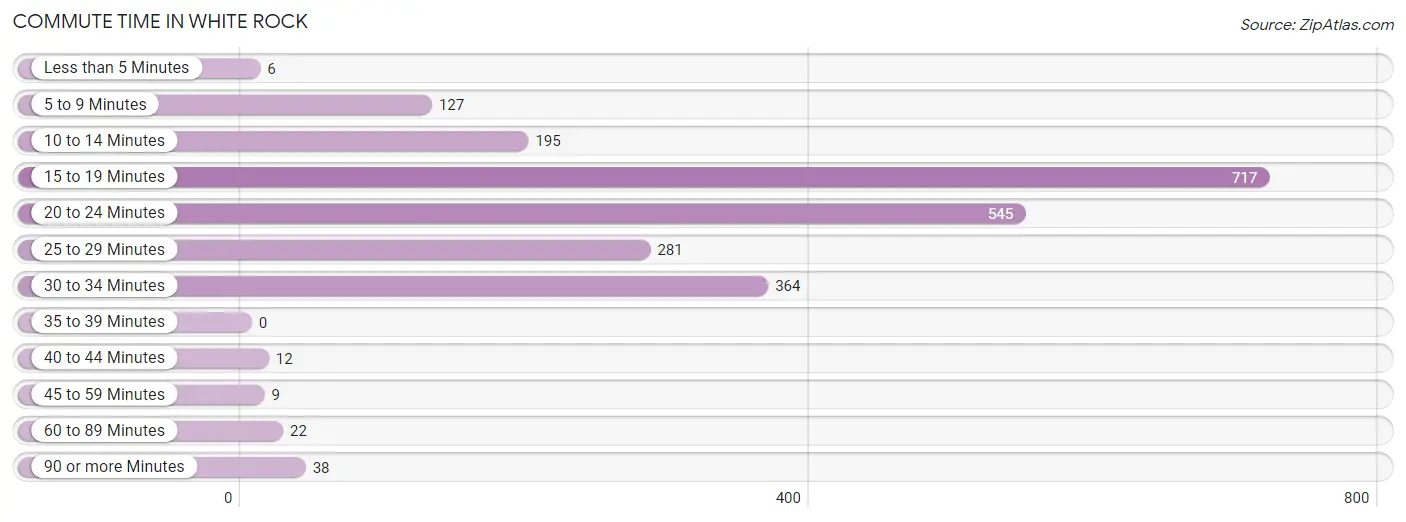
| Commute Time | # Commuters | % Commuters |
| Less than 5 Minutes | 6 | 0.3% |
| 5 to 9 Minutes | 127 | 5.5% |
| 10 to 14 Minutes | 195 | 8.4% |
| 15 to 19 Minutes | 717 | 31.0% |
| 20 to 24 Minutes | 545 | 23.5% |
| 25 to 29 Minutes | 281 | 12.1% |
| 30 to 34 Minutes | 364 | 15.7% |
| 35 to 39 Minutes | 0 | 0.0% |
| 40 to 44 Minutes | 12 | 0.5% |
| 45 to 59 Minutes | 9 | 0.4% |
| 60 to 89 Minutes | 22 | 0.9% |
| 90 or more Minutes | 38 | 1.6% |
Commute Time by Sex in White Rock
The most common commute times in White Rock are 15 to 19 minutes (455 commuters, 34.2%) for males and 15 to 19 minutes (262 commuters, 26.6%) for females.
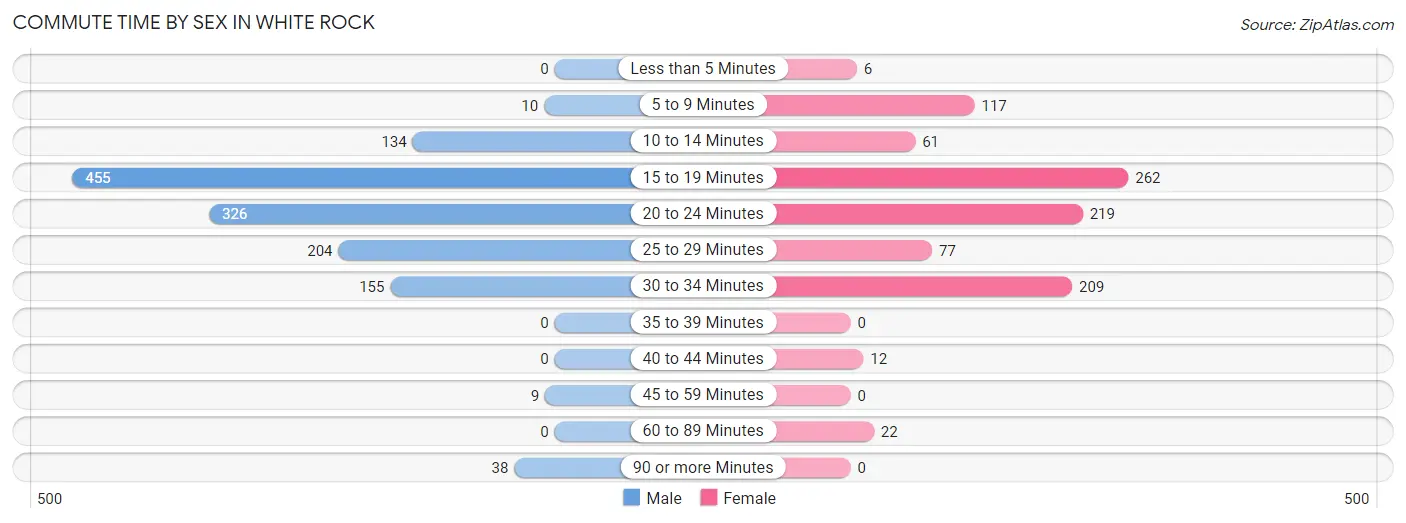
| Commute Time | Male | Female |
| Less than 5 Minutes | 0 (0.0%) | 6 (0.6%) |
| 5 to 9 Minutes | 10 (0.7%) | 117 (11.9%) |
| 10 to 14 Minutes | 134 (10.1%) | 61 (6.2%) |
| 15 to 19 Minutes | 455 (34.2%) | 262 (26.6%) |
| 20 to 24 Minutes | 326 (24.5%) | 219 (22.2%) |
| 25 to 29 Minutes | 204 (15.3%) | 77 (7.8%) |
| 30 to 34 Minutes | 155 (11.7%) | 209 (21.2%) |
| 35 to 39 Minutes | 0 (0.0%) | 0 (0.0%) |
| 40 to 44 Minutes | 0 (0.0%) | 12 (1.2%) |
| 45 to 59 Minutes | 9 (0.7%) | 0 (0.0%) |
| 60 to 89 Minutes | 0 (0.0%) | 22 (2.2%) |
| 90 or more Minutes | 38 (2.9%) | 0 (0.0%) |
Time of Departure to Work by Sex in White Rock
The most frequent times of departure to work in White Rock are 7:00 AM to 7:29 AM (378, 28.4%) for males and 8:00 AM to 8:29 AM (268, 27.2%) for females.
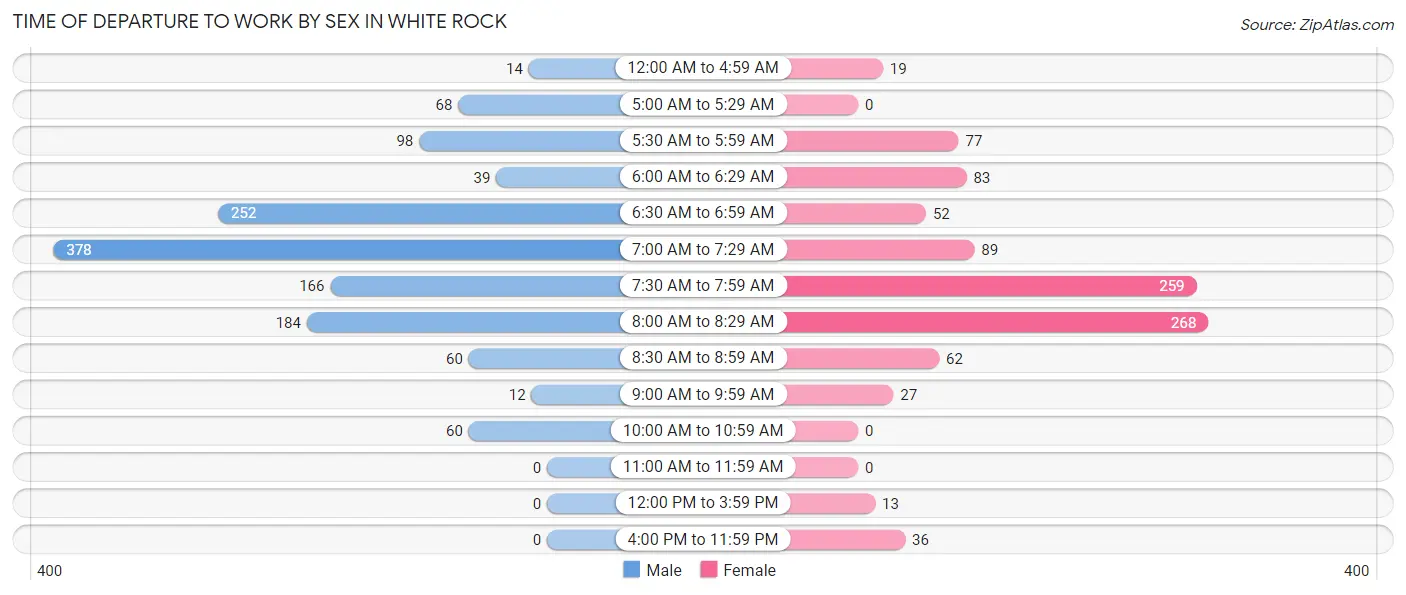
| Time of Departure | Male | Female |
| 12:00 AM to 4:59 AM | 14 (1.1%) | 19 (1.9%) |
| 5:00 AM to 5:29 AM | 68 (5.1%) | 0 (0.0%) |
| 5:30 AM to 5:59 AM | 98 (7.4%) | 77 (7.8%) |
| 6:00 AM to 6:29 AM | 39 (2.9%) | 83 (8.4%) |
| 6:30 AM to 6:59 AM | 252 (18.9%) | 52 (5.3%) |
| 7:00 AM to 7:29 AM | 378 (28.4%) | 89 (9.0%) |
| 7:30 AM to 7:59 AM | 166 (12.5%) | 259 (26.3%) |
| 8:00 AM to 8:29 AM | 184 (13.8%) | 268 (27.2%) |
| 8:30 AM to 8:59 AM | 60 (4.5%) | 62 (6.3%) |
| 9:00 AM to 9:59 AM | 12 (0.9%) | 27 (2.7%) |
| 10:00 AM to 10:59 AM | 60 (4.5%) | 0 (0.0%) |
| 11:00 AM to 11:59 AM | 0 (0.0%) | 0 (0.0%) |
| 12:00 PM to 3:59 PM | 0 (0.0%) | 13 (1.3%) |
| 4:00 PM to 11:59 PM | 0 (0.0%) | 36 (3.6%) |
| Total | 1,331 (100.0%) | 985 (100.0%) |
Housing Occupancy in White Rock
Occupancy by Ownership in White Rock
Of the total 2,033 dwellings in White Rock, owner-occupied units account for 1,968 (96.8%), while renter-occupied units make up 65 (3.2%).
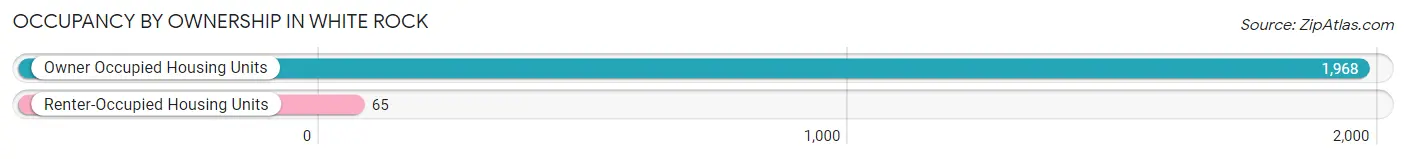
| Occupancy | # Housing Units | % Housing Units |
| Owner Occupied Housing Units | 1,968 | 96.8% |
| Renter-Occupied Housing Units | 65 | 3.2% |
| Total Occupied Housing Units | 2,033 | 100.0% |
Occupancy by Household Size in White Rock
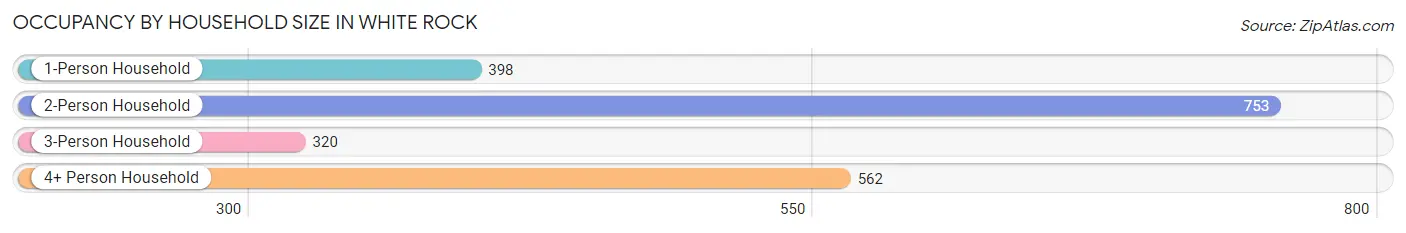
| Household Size | # Housing Units | % Housing Units |
| 1-Person Household | 398 | 19.6% |
| 2-Person Household | 753 | 37.0% |
| 3-Person Household | 320 | 15.7% |
| 4+ Person Household | 562 | 27.6% |
| Total Housing Units | 2,033 | 100.0% |
Occupancy by Ownership by Household Size in White Rock
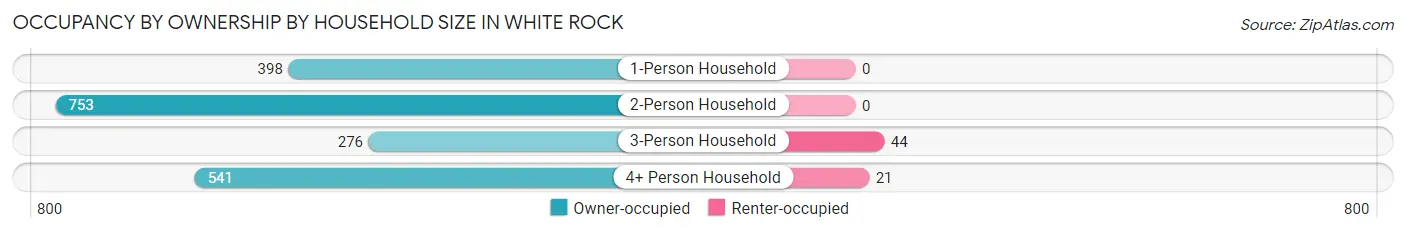
| Household Size | Owner-occupied | Renter-occupied |
| 1-Person Household | 398 (100.0%) | 0 (0.0%) |
| 2-Person Household | 753 (100.0%) | 0 (0.0%) |
| 3-Person Household | 276 (86.3%) | 44 (13.8%) |
| 4+ Person Household | 541 (96.3%) | 21 (3.7%) |
| Total Housing Units | 1,968 (96.8%) | 65 (3.2%) |
Occupancy by Educational Attainment in White Rock
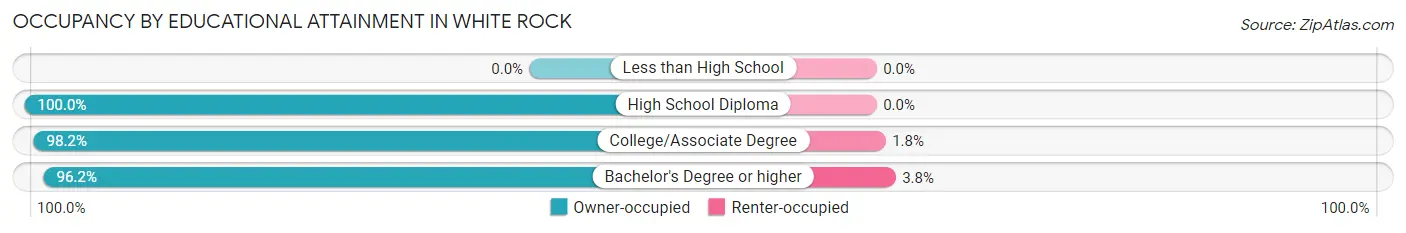
| Household Size | Owner-occupied | Renter-occupied |
| Less than High School | 0 (0.0%) | 0 (0.0%) |
| High School Diploma | 73 (100.0%) | 0 (0.0%) |
| College/Associate Degree | 439 (98.2%) | 8 (1.8%) |
| Bachelor's Degree or higher | 1,456 (96.2%) | 57 (3.8%) |
Occupancy by Age of Householder in White Rock
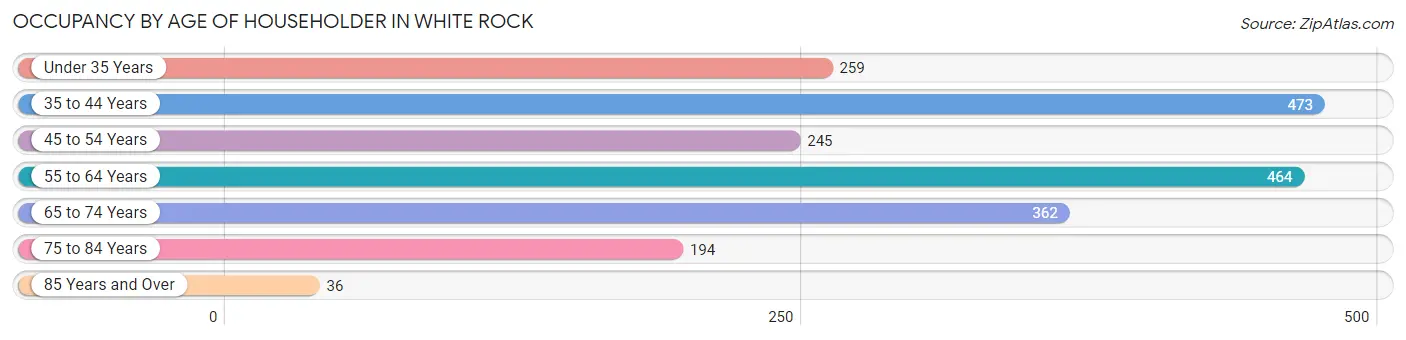
| Age Bracket | # Households | % Households |
| Under 35 Years | 259 | 12.7% |
| 35 to 44 Years | 473 | 23.3% |
| 45 to 54 Years | 245 | 12.0% |
| 55 to 64 Years | 464 | 22.8% |
| 65 to 74 Years | 362 | 17.8% |
| 75 to 84 Years | 194 | 9.5% |
| 85 Years and Over | 36 | 1.8% |
| Total | 2,033 | 100.0% |
Housing Finances in White Rock
Median Income by Occupancy in White Rock
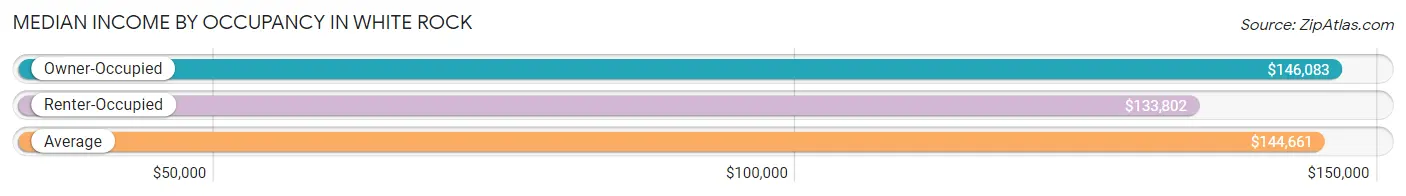
| Occupancy Type | # Households | Median Income |
| Owner-Occupied | 1,968 (96.8%) | $146,083 |
| Renter-Occupied | 65 (3.2%) | $133,802 |
| Average | 2,033 (100.0%) | $144,661 |
Occupancy by Householder Income Bracket in White Rock
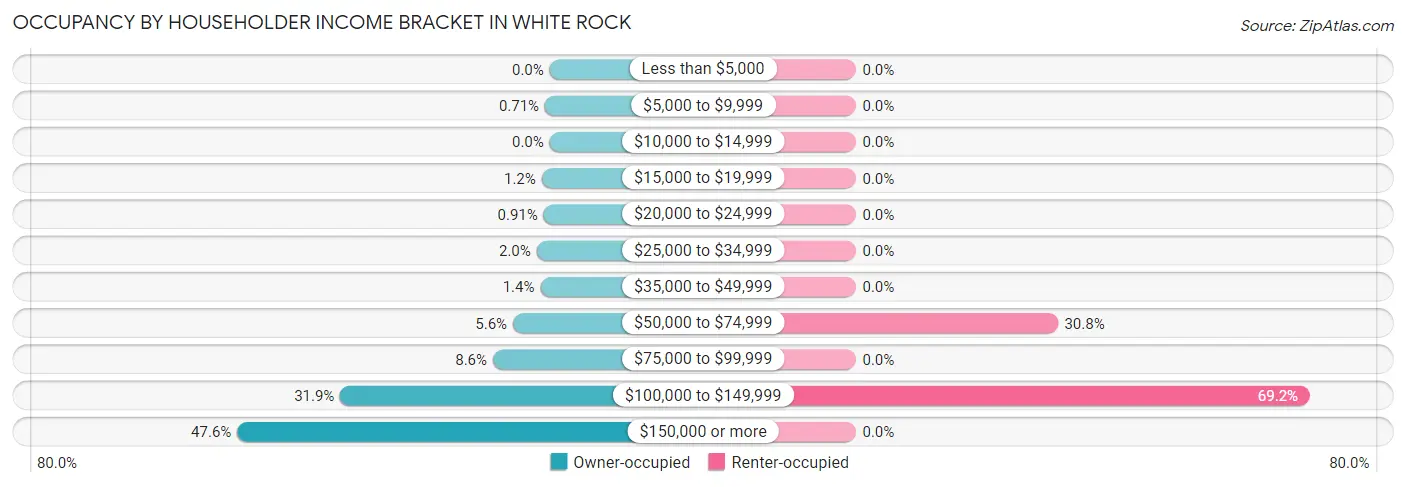
| Income Bracket | Owner-occupied | Renter-occupied |
| Less than $5,000 | 0 (0.0%) | 0 (0.0%) |
| $5,000 to $9,999 | 14 (0.7%) | 0 (0.0%) |
| $10,000 to $14,999 | 0 (0.0%) | 0 (0.0%) |
| $15,000 to $19,999 | 24 (1.2%) | 0 (0.0%) |
| $20,000 to $24,999 | 18 (0.9%) | 0 (0.0%) |
| $25,000 to $34,999 | 39 (2.0%) | 0 (0.0%) |
| $35,000 to $49,999 | 28 (1.4%) | 0 (0.0%) |
| $50,000 to $74,999 | 110 (5.6%) | 20 (30.8%) |
| $75,000 to $99,999 | 170 (8.6%) | 0 (0.0%) |
| $100,000 to $149,999 | 628 (31.9%) | 45 (69.2%) |
| $150,000 or more | 937 (47.6%) | 0 (0.0%) |
| Total | 1,968 (100.0%) | 65 (100.0%) |
Monthly Housing Cost Tiers in White Rock
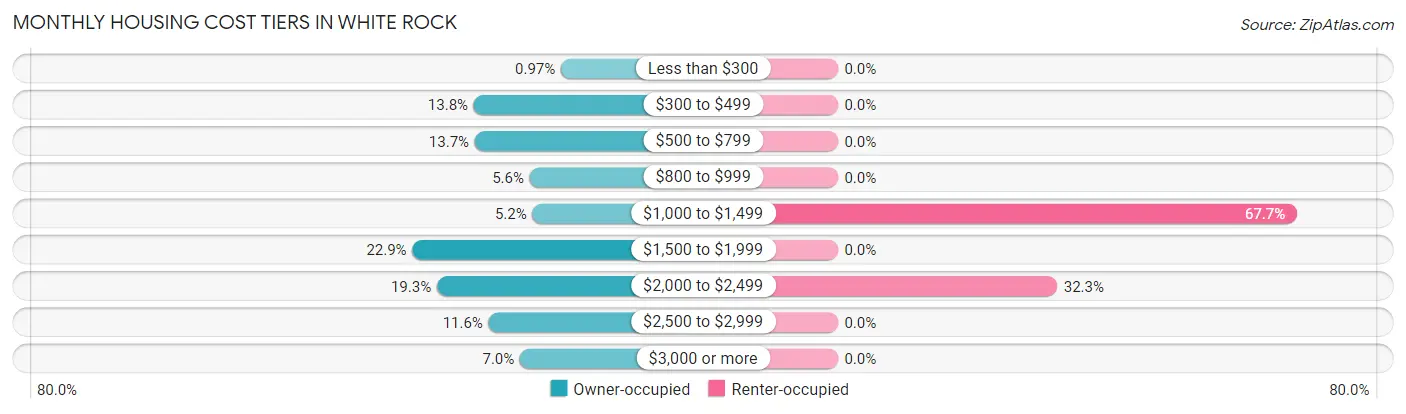
| Monthly Cost | Owner-occupied | Renter-occupied |
| Less than $300 | 19 (1.0%) | 0 (0.0%) |
| $300 to $499 | 272 (13.8%) | 0 (0.0%) |
| $500 to $799 | 269 (13.7%) | 0 (0.0%) |
| $800 to $999 | 110 (5.6%) | 0 (0.0%) |
| $1,000 to $1,499 | 102 (5.2%) | 44 (67.7%) |
| $1,500 to $1,999 | 450 (22.9%) | 0 (0.0%) |
| $2,000 to $2,499 | 379 (19.3%) | 21 (32.3%) |
| $2,500 to $2,999 | 229 (11.6%) | 0 (0.0%) |
| $3,000 or more | 138 (7.0%) | 0 (0.0%) |
| Total | 1,968 (100.0%) | 65 (100.0%) |
Physical Housing Characteristics in White Rock
Housing Structures in White Rock
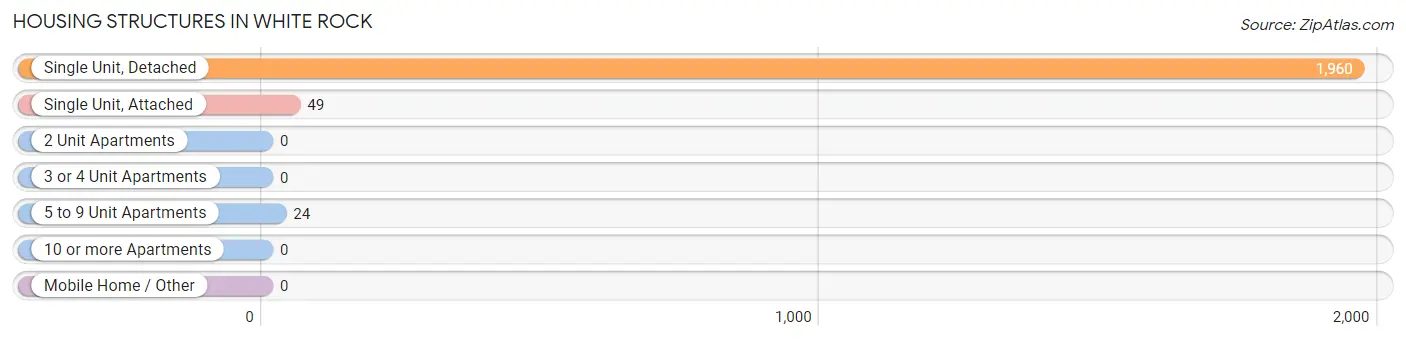
| Structure Type | # Housing Units | % Housing Units |
| Single Unit, Detached | 1,960 | 96.4% |
| Single Unit, Attached | 49 | 2.4% |
| 2 Unit Apartments | 0 | 0.0% |
| 3 or 4 Unit Apartments | 0 | 0.0% |
| 5 to 9 Unit Apartments | 24 | 1.2% |
| 10 or more Apartments | 0 | 0.0% |
| Mobile Home / Other | 0 | 0.0% |
| Total | 2,033 | 100.0% |
Housing Structures by Occupancy in White Rock
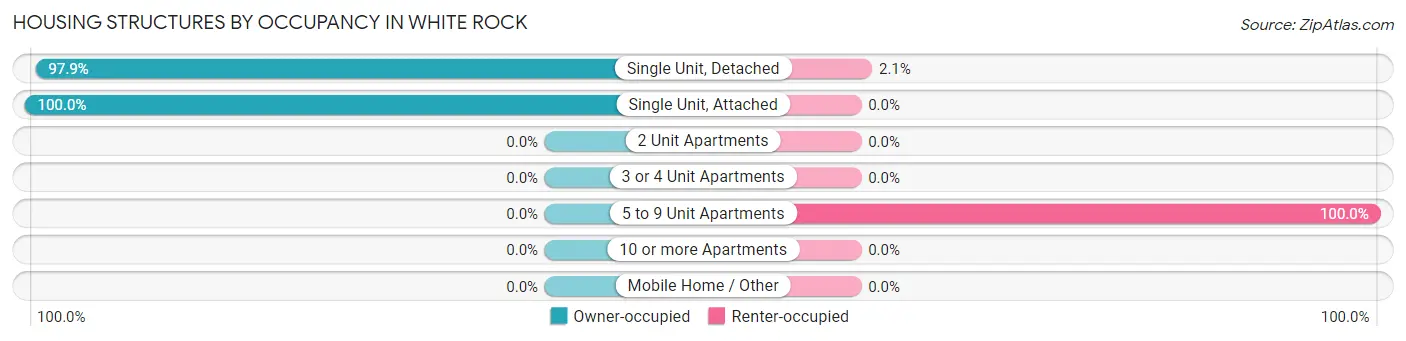
| Structure Type | Owner-occupied | Renter-occupied |
| Single Unit, Detached | 1,919 (97.9%) | 41 (2.1%) |
| Single Unit, Attached | 49 (100.0%) | 0 (0.0%) |
| 2 Unit Apartments | 0 (0.0%) | 0 (0.0%) |
| 3 or 4 Unit Apartments | 0 (0.0%) | 0 (0.0%) |
| 5 to 9 Unit Apartments | 0 (0.0%) | 24 (100.0%) |
| 10 or more Apartments | 0 (0.0%) | 0 (0.0%) |
| Mobile Home / Other | 0 (0.0%) | 0 (0.0%) |
| Total | 1,968 (96.8%) | 65 (3.2%) |
Housing Structures by Number of Rooms in White Rock
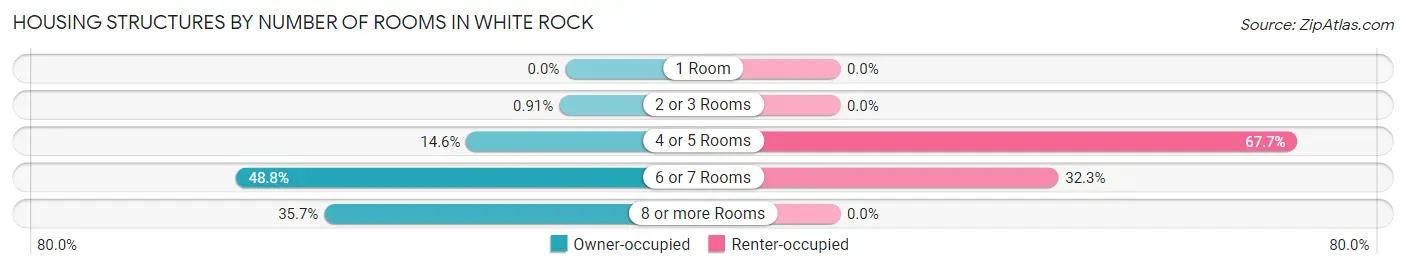
| Number of Rooms | Owner-occupied | Renter-occupied |
| 1 Room | 0 (0.0%) | 0 (0.0%) |
| 2 or 3 Rooms | 18 (0.9%) | 0 (0.0%) |
| 4 or 5 Rooms | 288 (14.6%) | 44 (67.7%) |
| 6 or 7 Rooms | 960 (48.8%) | 21 (32.3%) |
| 8 or more Rooms | 702 (35.7%) | 0 (0.0%) |
| Total | 1,968 (100.0%) | 65 (100.0%) |
Housing Structure by Heating Type in White Rock
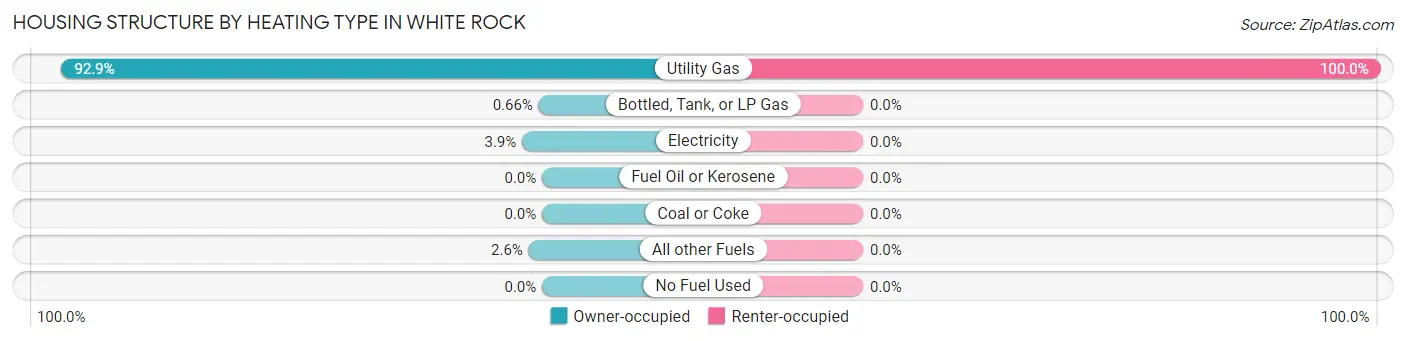
| Heating Type | Owner-occupied | Renter-occupied |
| Utility Gas | 1,828 (92.9%) | 65 (100.0%) |
| Bottled, Tank, or LP Gas | 13 (0.7%) | 0 (0.0%) |
| Electricity | 76 (3.9%) | 0 (0.0%) |
| Fuel Oil or Kerosene | 0 (0.0%) | 0 (0.0%) |
| Coal or Coke | 0 (0.0%) | 0 (0.0%) |
| All other Fuels | 51 (2.6%) | 0 (0.0%) |
| No Fuel Used | 0 (0.0%) | 0 (0.0%) |
| Total | 1,968 (100.0%) | 65 (100.0%) |
Household Vehicle Usage in White Rock
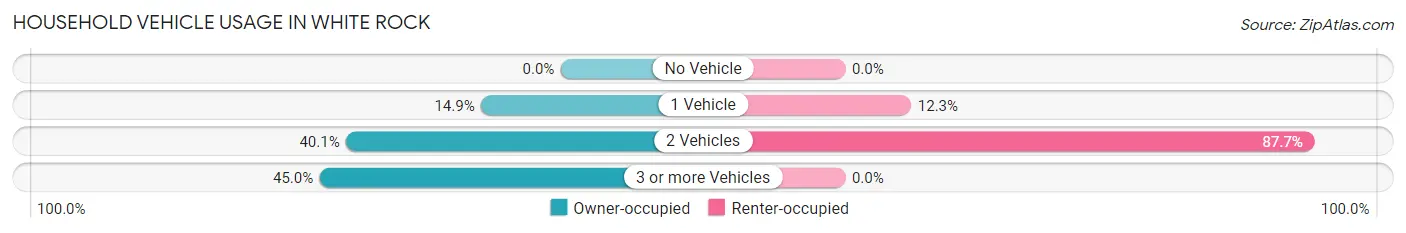
| Vehicles per Household | Owner-occupied | Renter-occupied |
| No Vehicle | 0 (0.0%) | 0 (0.0%) |
| 1 Vehicle | 293 (14.9%) | 8 (12.3%) |
| 2 Vehicles | 789 (40.1%) | 57 (87.7%) |
| 3 or more Vehicles | 886 (45.0%) | 0 (0.0%) |
| Total | 1,968 (100.0%) | 65 (100.0%) |
Real Estate & Mortgages in White Rock
Real Estate and Mortgage Overview in White Rock
| Characteristic | Without Mortgage | With Mortgage |
| Housing Units | 715 | 1,253 |
| Median Property Value | $377,400 | $438,700 |
| Median Household Income | $129,313 | $668 |
| Monthly Housing Costs | $550 | $138 |
| Real Estate Taxes | $2,510 | $33 |
Property Value by Mortgage Status in White Rock
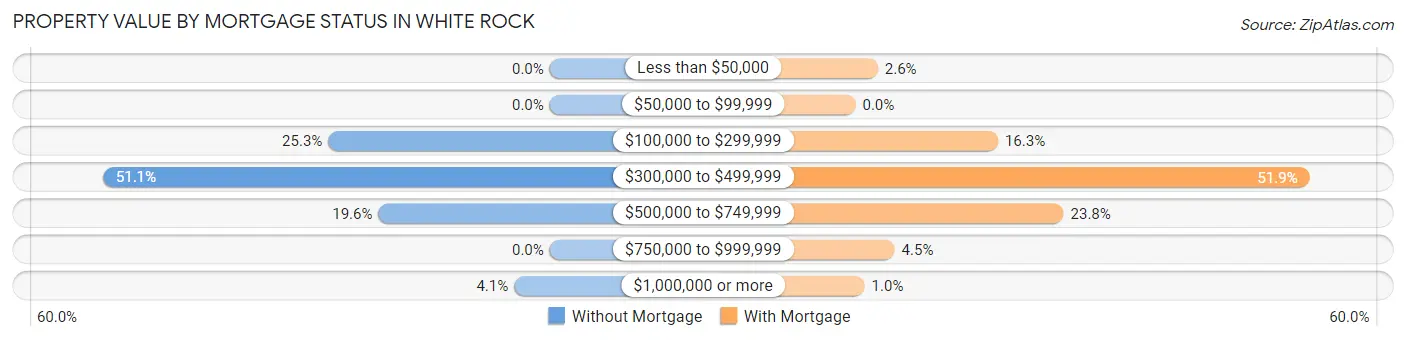
| Property Value | Without Mortgage | With Mortgage |
| Less than $50,000 | 0 (0.0%) | 32 (2.5%) |
| $50,000 to $99,999 | 0 (0.0%) | 0 (0.0%) |
| $100,000 to $299,999 | 181 (25.3%) | 204 (16.3%) |
| $300,000 to $499,999 | 365 (51.0%) | 650 (51.9%) |
| $500,000 to $749,999 | 140 (19.6%) | 298 (23.8%) |
| $750,000 to $999,999 | 0 (0.0%) | 56 (4.5%) |
| $1,000,000 or more | 29 (4.1%) | 13 (1.0%) |
| Total | 715 (100.0%) | 1,253 (100.0%) |
Household Income by Mortgage Status in White Rock
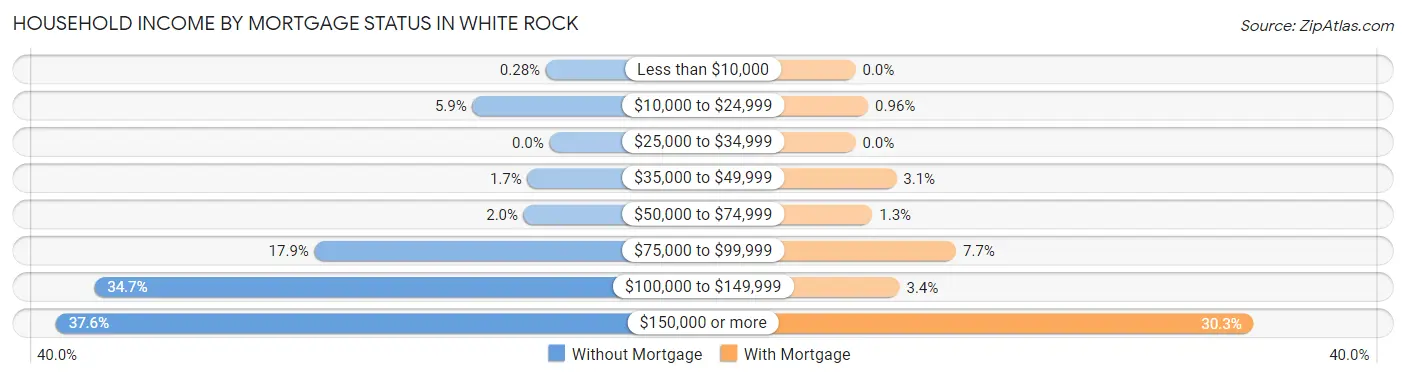
| Household Income | Without Mortgage | With Mortgage |
| Less than $10,000 | 2 (0.3%) | 0 (0.0%) |
| $10,000 to $24,999 | 42 (5.9%) | 12 (1.0%) |
| $25,000 to $34,999 | 0 (0.0%) | 0 (0.0%) |
| $35,000 to $49,999 | 12 (1.7%) | 39 (3.1%) |
| $50,000 to $74,999 | 14 (2.0%) | 16 (1.3%) |
| $75,000 to $99,999 | 128 (17.9%) | 96 (7.7%) |
| $100,000 to $149,999 | 248 (34.7%) | 42 (3.4%) |
| $150,000 or more | 269 (37.6%) | 380 (30.3%) |
| Total | 715 (100.0%) | 1,253 (100.0%) |
Property Value to Household Income Ratio in White Rock
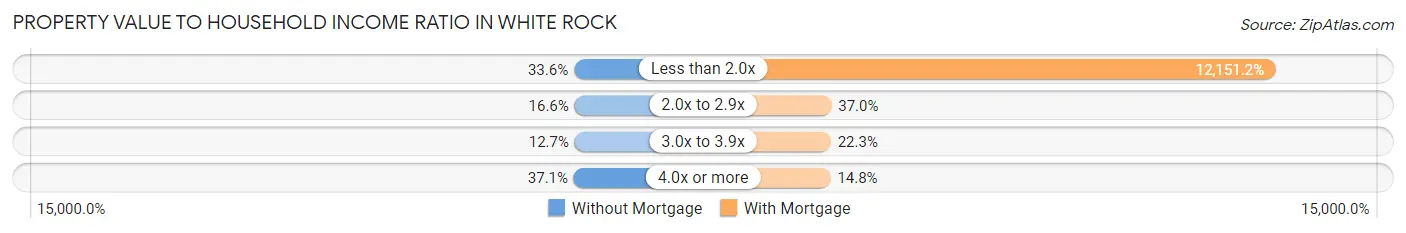
| Value-to-Income Ratio | Without Mortgage | With Mortgage |
| Less than 2.0x | 240 (33.6%) | 152,255 (12,151.2%) |
| 2.0x to 2.9x | 119 (16.6%) | 464 (37.0%) |
| 3.0x to 3.9x | 91 (12.7%) | 279 (22.3%) |
| 4.0x or more | 265 (37.1%) | 185 (14.8%) |
| Total | 715 (100.0%) | 1,253 (100.0%) |
Real Estate Taxes by Mortgage Status in White Rock
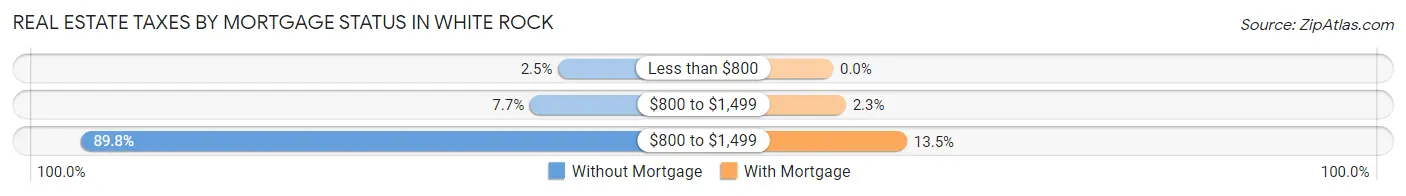
| Property Taxes | Without Mortgage | With Mortgage |
| Less than $800 | 18 (2.5%) | 0 (0.0%) |
| $800 to $1,499 | 55 (7.7%) | 29 (2.3%) |
| $800 to $1,499 | 642 (89.8%) | 169 (13.5%) |
| Total | 715 (100.0%) | 1,253 (100.0%) |
Health & Disability in White Rock
Health Insurance Coverage by Age in White Rock
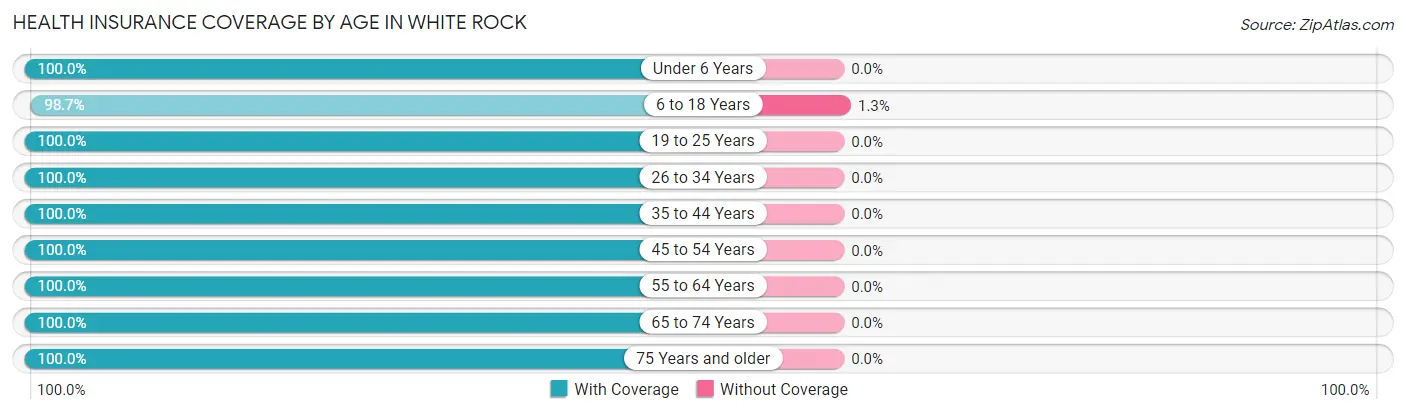
| Age Bracket | With Coverage | Without Coverage |
| Under 6 Years | 502 (100.0%) | 0 (0.0%) |
| 6 to 18 Years | 1,015 (98.7%) | 13 (1.3%) |
| 19 to 25 Years | 315 (100.0%) | 0 (0.0%) |
| 26 to 34 Years | 434 (100.0%) | 0 (0.0%) |
| 35 to 44 Years | 933 (100.0%) | 0 (0.0%) |
| 45 to 54 Years | 526 (100.0%) | 0 (0.0%) |
| 55 to 64 Years | 803 (100.0%) | 0 (0.0%) |
| 65 to 74 Years | 627 (100.0%) | 0 (0.0%) |
| 75 Years and older | 424 (100.0%) | 0 (0.0%) |
| Total | 5,579 (99.8%) | 13 (0.2%) |
Health Insurance Coverage by Citizenship Status in White Rock
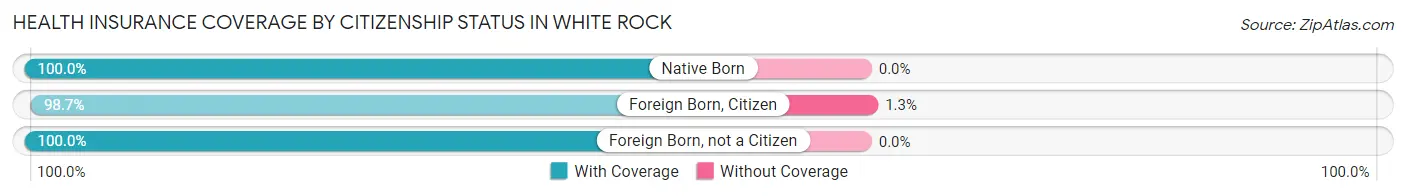
| Citizenship Status | With Coverage | Without Coverage |
| Native Born | 502 (100.0%) | 0 (0.0%) |
| Foreign Born, Citizen | 1,015 (98.7%) | 13 (1.3%) |
| Foreign Born, not a Citizen | 315 (100.0%) | 0 (0.0%) |
Health Insurance Coverage by Household Income in White Rock
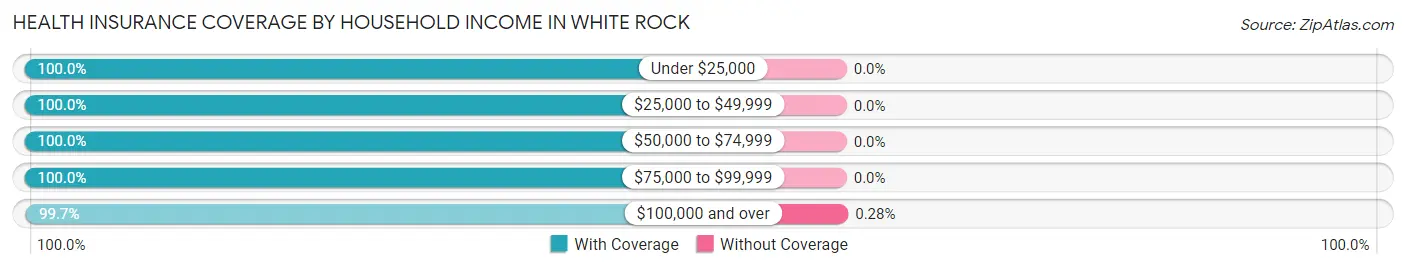
| Household Income | With Coverage | Without Coverage |
| Under $25,000 | 115 (100.0%) | 0 (0.0%) |
| $25,000 to $49,999 | 162 (100.0%) | 0 (0.0%) |
| $50,000 to $74,999 | 228 (100.0%) | 0 (0.0%) |
| $75,000 to $99,999 | 413 (100.0%) | 0 (0.0%) |
| $100,000 and over | 4,661 (99.7%) | 13 (0.3%) |
Public vs Private Health Insurance Coverage by Age in White Rock
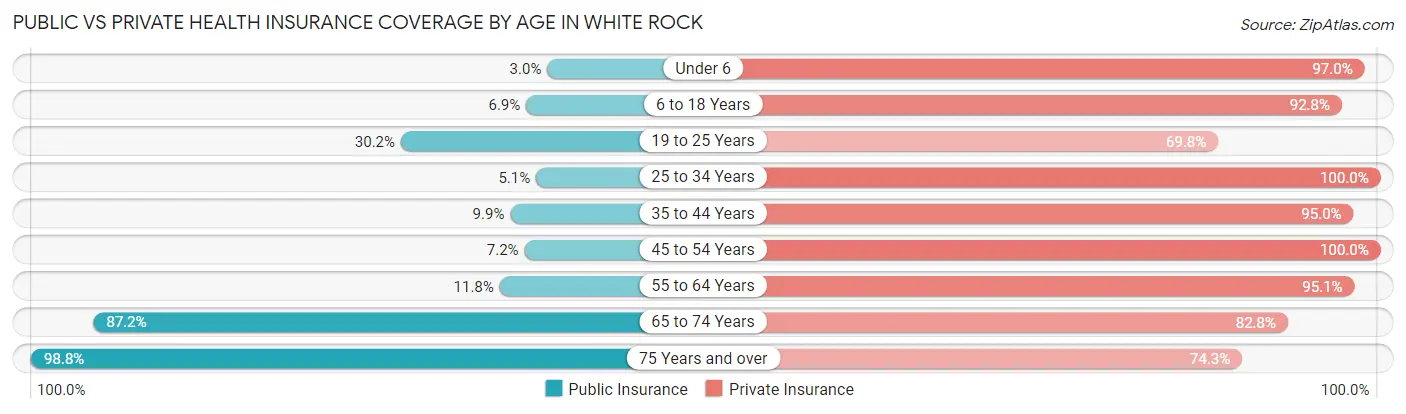
| Age Bracket | Public Insurance | Private Insurance |
| Under 6 | 15 (3.0%) | 487 (97.0%) |
| 6 to 18 Years | 71 (6.9%) | 954 (92.8%) |
| 19 to 25 Years | 95 (30.2%) | 220 (69.8%) |
| 25 to 34 Years | 22 (5.1%) | 434 (100.0%) |
| 35 to 44 Years | 92 (9.9%) | 886 (95.0%) |
| 45 to 54 Years | 38 (7.2%) | 526 (100.0%) |
| 55 to 64 Years | 95 (11.8%) | 764 (95.1%) |
| 65 to 74 Years | 547 (87.2%) | 519 (82.8%) |
| 75 Years and over | 419 (98.8%) | 315 (74.3%) |
| Total | 1,394 (24.9%) | 5,105 (91.3%) |
Disability Status by Sex by Age in White Rock
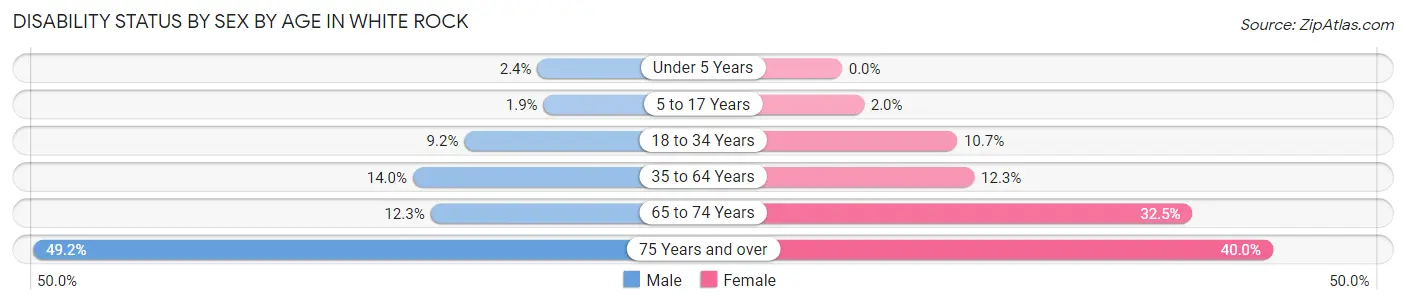
| Age Bracket | Male | Female |
| Under 5 Years | 4 (2.4%) | 0 (0.0%) |
| 5 to 17 Years | 10 (1.8%) | 11 (2.0%) |
| 18 to 34 Years | 30 (9.2%) | 48 (10.7%) |
| 35 to 64 Years | 167 (14.0%) | 131 (12.3%) |
| 65 to 74 Years | 36 (12.3%) | 109 (32.5%) |
| 75 Years and over | 93 (49.2%) | 94 (40.0%) |
Disability Class by Sex by Age in White Rock
Disability Class: Hearing Difficulty
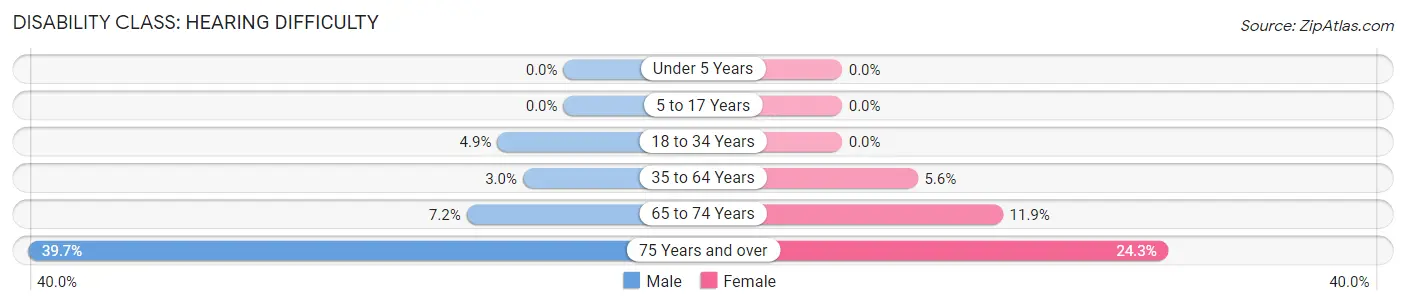
| Age Bracket | Male | Female |
| Under 5 Years | 0 (0.0%) | 0 (0.0%) |
| 5 to 17 Years | 0 (0.0%) | 0 (0.0%) |
| 18 to 34 Years | 16 (4.9%) | 0 (0.0%) |
| 35 to 64 Years | 36 (3.0%) | 60 (5.6%) |
| 65 to 74 Years | 21 (7.2%) | 40 (11.9%) |
| 75 Years and over | 75 (39.7%) | 57 (24.3%) |
Disability Class: Vision Difficulty
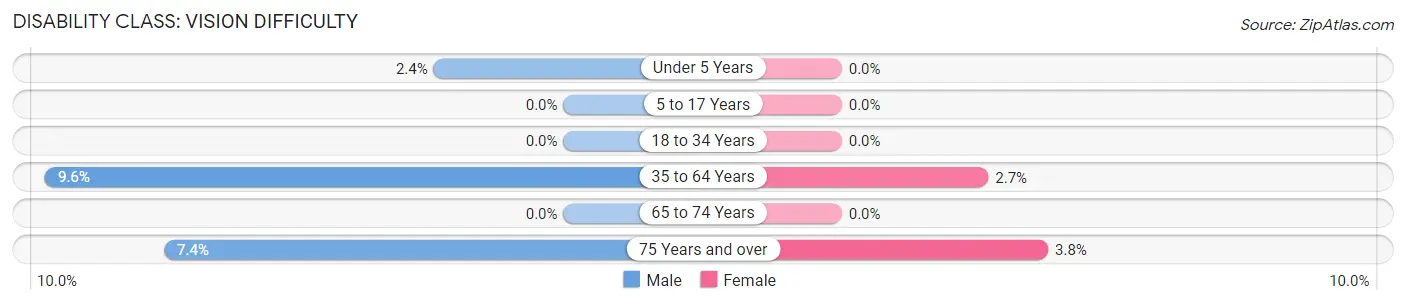
| Age Bracket | Male | Female |
| Under 5 Years | 4 (2.4%) | 0 (0.0%) |
| 5 to 17 Years | 0 (0.0%) | 0 (0.0%) |
| 18 to 34 Years | 0 (0.0%) | 0 (0.0%) |
| 35 to 64 Years | 115 (9.6%) | 29 (2.7%) |
| 65 to 74 Years | 0 (0.0%) | 0 (0.0%) |
| 75 Years and over | 14 (7.4%) | 9 (3.8%) |
Disability Class: Cognitive Difficulty
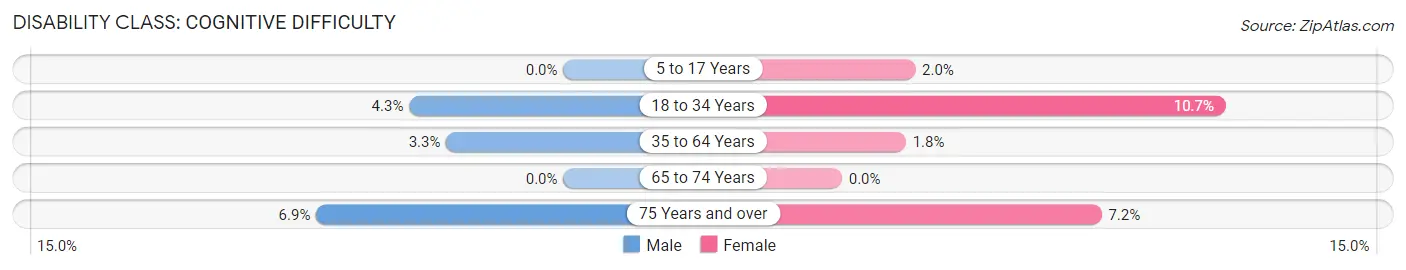
| Age Bracket | Male | Female |
| 5 to 17 Years | 0 (0.0%) | 11 (2.0%) |
| 18 to 34 Years | 14 (4.3%) | 48 (10.7%) |
| 35 to 64 Years | 39 (3.3%) | 19 (1.8%) |
| 65 to 74 Years | 0 (0.0%) | 0 (0.0%) |
| 75 Years and over | 13 (6.9%) | 17 (7.2%) |
Disability Class: Ambulatory Difficulty
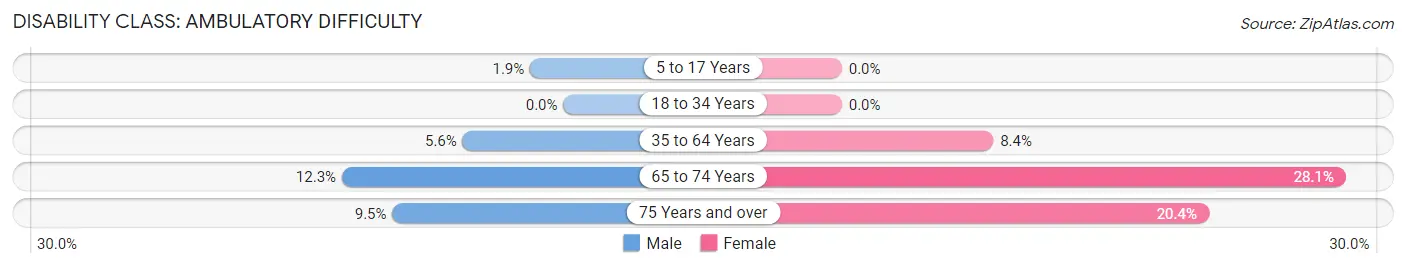
| Age Bracket | Male | Female |
| 5 to 17 Years | 10 (1.8%) | 0 (0.0%) |
| 18 to 34 Years | 0 (0.0%) | 0 (0.0%) |
| 35 to 64 Years | 67 (5.6%) | 90 (8.4%) |
| 65 to 74 Years | 36 (12.3%) | 94 (28.1%) |
| 75 Years and over | 18 (9.5%) | 48 (20.4%) |
Disability Class: Self-Care Difficulty
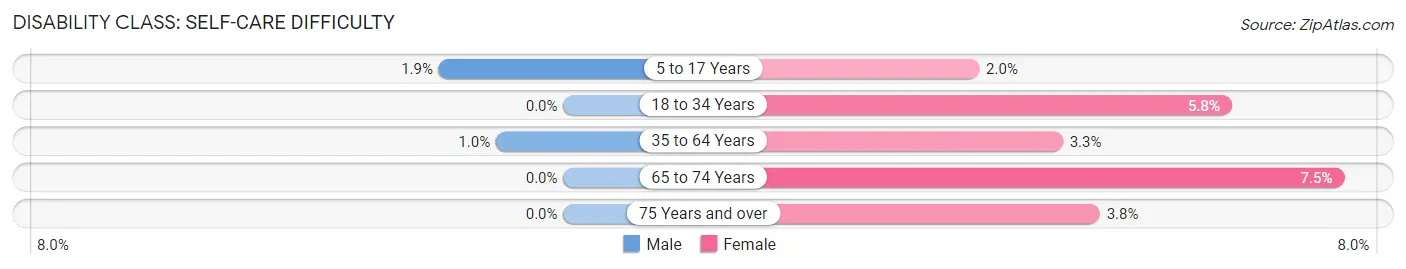
| Age Bracket | Male | Female |
| 5 to 17 Years | 10 (1.8%) | 11 (2.0%) |
| 18 to 34 Years | 0 (0.0%) | 26 (5.8%) |
| 35 to 64 Years | 12 (1.0%) | 35 (3.3%) |
| 65 to 74 Years | 0 (0.0%) | 25 (7.5%) |
| 75 Years and over | 0 (0.0%) | 9 (3.8%) |
Technology Access in White Rock
Computing Device Access in White Rock
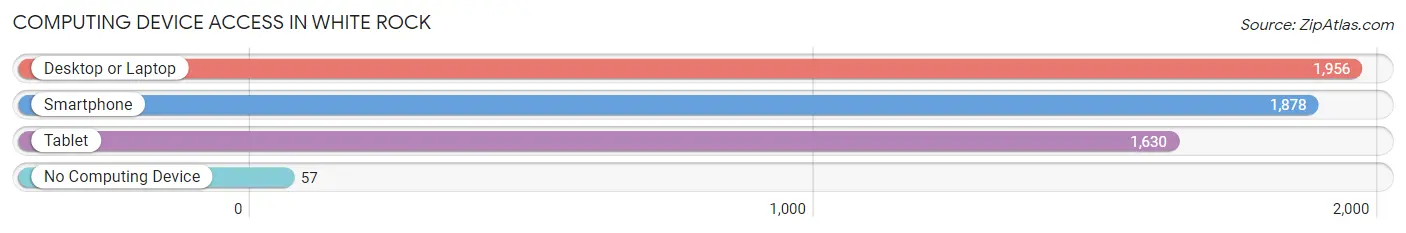
| Device Type | # Households | % Households |
| Desktop or Laptop | 1,956 | 96.2% |
| Smartphone | 1,878 | 92.4% |
| Tablet | 1,630 | 80.2% |
| No Computing Device | 57 | 2.8% |
| Total | 2,033 | 100.0% |
Internet Access in White Rock
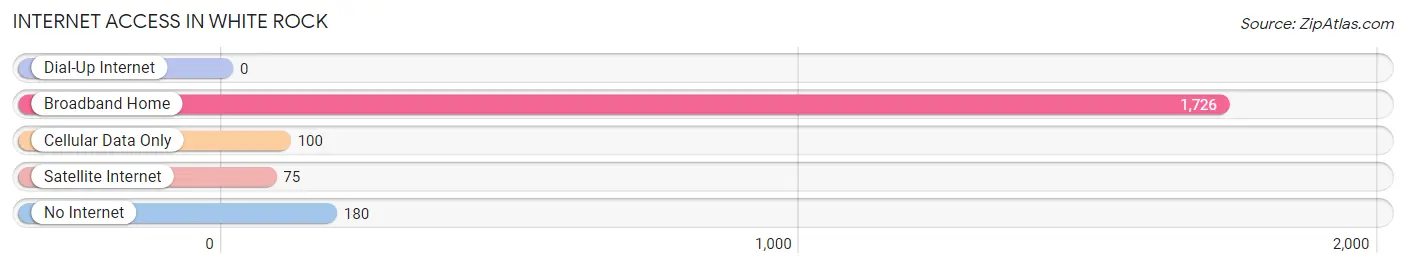
| Internet Type | # Households | % Households |
| Dial-Up Internet | 0 | 0.0% |
| Broadband Home | 1,726 | 84.9% |
| Cellular Data Only | 100 | 4.9% |
| Satellite Internet | 75 | 3.7% |
| No Internet | 180 | 8.8% |
| Total | 2,033 | 100.0% |
White Rock Summary
History
White Rock, New Mexico is a small unincorporated community located in the northern part of the state, in Los Alamos County. It is situated at the base of the Jemez Mountains, and is home to the Los Alamos National Laboratory. The area was first inhabited by the Pueblo Indians, who lived in the area for centuries before the arrival of the Spanish in the 16th century. The Spanish established a mission in the area, and the Pueblo Indians were forced to relocate to the nearby Jemez Pueblo.
In the late 19th century, the area was settled by homesteaders, and the town of White Rock was established in 1891. The town was named after the white rocks that were found in the area. The town grew slowly, and by the early 20th century, it had become a popular tourist destination. The town was also home to a number of businesses, including a hotel, a general store, and a post office.
In 1942, the United States government purchased the land around White Rock to build the Los Alamos National Laboratory. The laboratory was built to develop the atomic bomb, and the town of White Rock was evacuated. The town was not allowed to return until after the war, and the population of White Rock decreased significantly.
In the 1950s, the town began to grow again, and the population increased to over 1,000 by the 1970s. The town has continued to grow since then, and the population is now estimated to be around 2,000.
Geography
White Rock is located in the northern part of New Mexico, in Los Alamos County. It is situated at the base of the Jemez Mountains, and is surrounded by the Santa Fe National Forest. The town is located at an elevation of 6,400 feet, and has a total area of 4.2 square miles.
The climate in White Rock is semi-arid, with hot summers and cold winters. The average temperature in the summer is around 80 degrees Fahrenheit, and the average temperature in the winter is around 40 degrees Fahrenheit. The town receives an average of 12 inches of precipitation per year.
Economy
The economy of White Rock is largely based on tourism and the Los Alamos National Laboratory. The laboratory is the largest employer in the area, and provides jobs for many of the residents of White Rock. The town is also home to a number of small businesses, including restaurants, hotels, and retail stores.
The town is also home to a number of art galleries, and is a popular destination for art lovers. The town also hosts a number of festivals and events throughout the year, including the White Rock Arts and Crafts Festival and the White Rock Music Festival.
Demographics
As of the 2010 census, the population of White Rock was 2,037. The racial makeup of the town was 94.3% White, 0.7% African American, 1.2% Native American, 0.7% Asian, 0.1% Pacific Islander, 1.2% from other races, and 1.7% from two or more races. Hispanic or Latino of any race were 4.3% of the population.
The median household income in White Rock was $50,938, and the median family income was $60,938. The per capita income for the town was $27,938. About 8.3% of families and 10.2% of the population were below the poverty line, including 14.3% of those under age 18 and 5.2% of those age 65 or over.
Common Questions
What is the Total Population of White Rock?
Total Population of White Rock is 5,592.
What is the Total Male Population of White Rock?
Total Male Population of White Rock is 2,708.
What is the Total Female Population of White Rock?
Total Female Population of White Rock is 2,884.
What is the Ratio of Males per 100 Females in White Rock?
There are 93.90 Males per 100 Females in White Rock.
What is the Ratio of Females per 100 Males in White Rock?
There are 106.50 Females per 100 Males in White Rock.
What is the Median Population Age in White Rock?
Median Population Age in White Rock is 41.2 Years.
What is the Average Family Size in White Rock
Average Family Size in White Rock is 3.2 People.
What is the Average Household Size in White Rock
Average Household Size in White Rock is 2.8 People.
What is Per Capita Income in White Rock?
Per Capita income in White Rock is $66,311.
What is the Median Family Income in White Rock?
Median Family Income in White Rock is $153,801.
What is the Median Household income in White Rock?
Median Household Income in White Rock is $144,661.
What is Income or Wage Gap in White Rock?
Income or Wage Gap in White Rock is 43.1%.
Women in White Rock earn 56.9 cents for every dollar earned by a man.
What is Inequality or Gini Index in White Rock?
Inequality or Gini Index in White Rock is 0.33.
How Large is the Labor Force in White Rock?
There are 2,660 People in the Labor Forcein in White Rock.
What is the Percentage of People in the Labor Force in White Rock?
63.0% of People are in the Labor Force in White Rock.
What is the Unemployment Rate in White Rock?
Unemployment Rate in White Rock is 2.3%.