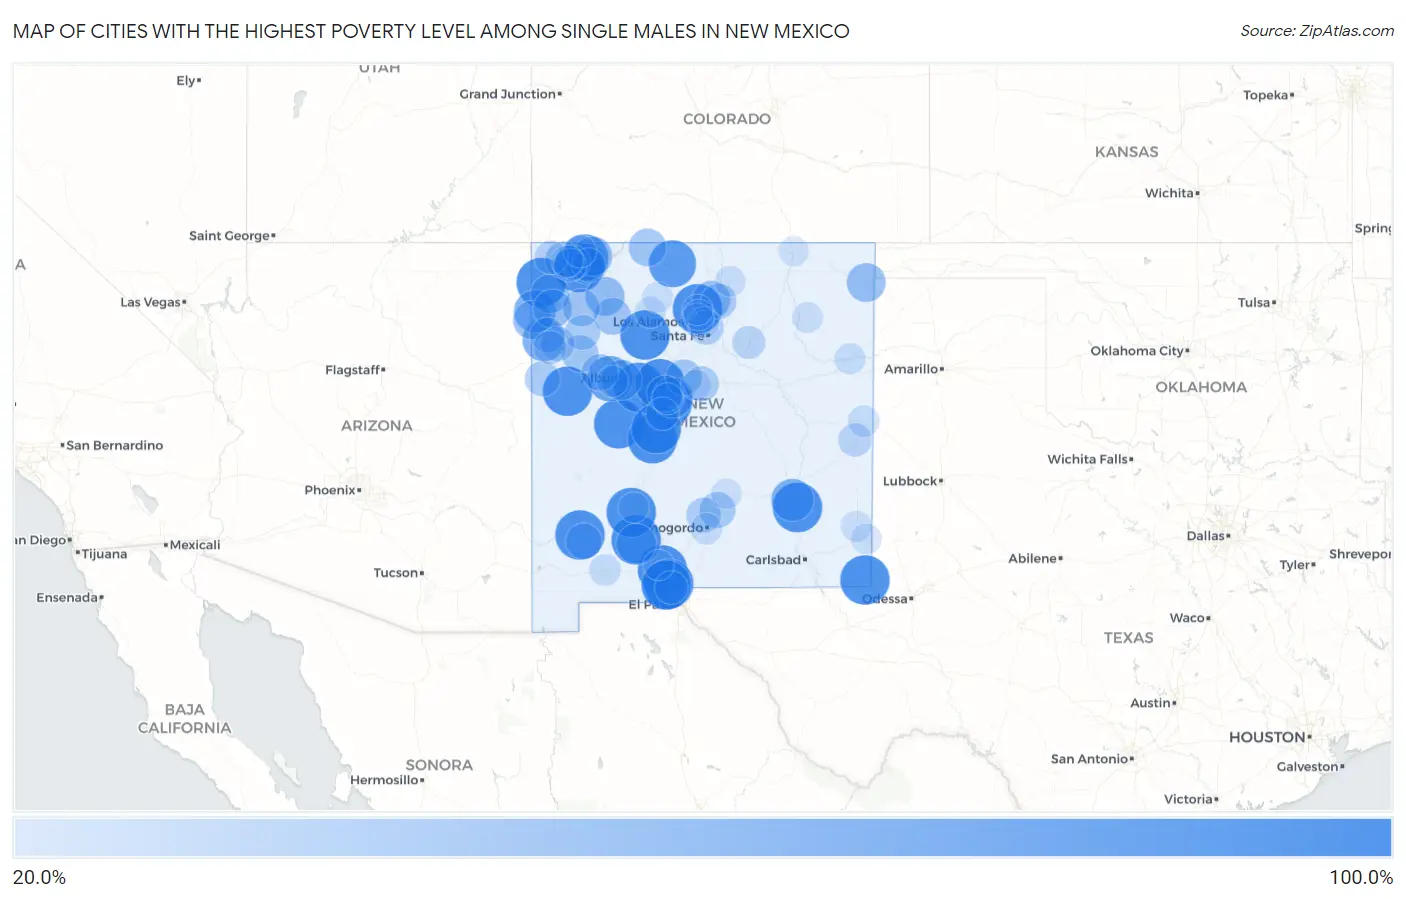
Cities with the Highest Poverty Level Among Single Males in New Mexico
RELATED REPORTS & OPTIONS
Highest Poverty | Single Male
New Mexico
Compare Cities
Map of Cities with the Highest Poverty Level Among Single Males in New Mexico
0.0%
100.0%
Cities with the Highest Poverty Level Among Single Males in New Mexico
| City | Single Male Poverty | vs State | vs National | |
| 1. | University Park | 100.0% | 19.3%(+80.7)#1 | 12.4%(+87.6)#60 |
| 2. | Jal | 100.0% | 19.3%(+80.7)#2 | 12.4%(+87.6)#86 |
| 3. | Picacho Hills | 100.0% | 19.3%(+80.7)#3 | 12.4%(+87.6)#111 |
| 4. | Las Maravillas | 100.0% | 19.3%(+80.7)#4 | 12.4%(+87.6)#114 |
| 5. | Berino | 100.0% | 19.3%(+80.7)#5 | 12.4%(+87.6)#183 |
| 6. | El Duende | 100.0% | 19.3%(+80.7)#6 | 12.4%(+87.6)#210 |
| 7. | Alamo | 100.0% | 19.3%(+80.7)#7 | 12.4%(+87.6)#217 |
| 8. | Arenas Valley | 100.0% | 19.3%(+80.7)#8 | 12.4%(+87.6)#223 |
| 9. | Dexter | 100.0% | 19.3%(+80.7)#9 | 12.4%(+87.6)#231 |
| 10. | Salem | 100.0% | 19.3%(+80.7)#10 | 12.4%(+87.6)#277 |
| 11. | Williamsburg | 100.0% | 19.3%(+80.7)#11 | 12.4%(+87.6)#290 |
| 12. | Chamberino | 100.0% | 19.3%(+80.7)#12 | 12.4%(+87.6)#325 |
| 13. | Napi Headquarters | 100.0% | 19.3%(+80.7)#13 | 12.4%(+87.6)#358 |
| 14. | Polvadera | 100.0% | 19.3%(+80.7)#14 | 12.4%(+87.6)#380 |
| 15. | Placitas Cdp Dona Ana County | 100.0% | 19.3%(+80.7)#15 | 12.4%(+87.6)#403 |
| 16. | Torreon Cdp Sandoval County | 100.0% | 19.3%(+80.7)#16 | 12.4%(+87.6)#418 |
| 17. | Totah Vista | 100.0% | 19.3%(+80.7)#17 | 12.4%(+87.6)#434 |
| 18. | Highland Meadows | 100.0% | 19.3%(+80.7)#18 | 12.4%(+87.6)#460 |
| 19. | Pinehill | 100.0% | 19.3%(+80.7)#19 | 12.4%(+87.6)#469 |
| 20. | Sanostee | 100.0% | 19.3%(+80.7)#20 | 12.4%(+87.6)#566 |
| 21. | Pajarito Mesa | 100.0% | 19.3%(+80.7)#21 | 12.4%(+87.6)#627 |
| 22. | San Luis | 100.0% | 19.3%(+80.7)#22 | 12.4%(+87.6)#704 |
| 23. | La Joya | 100.0% | 19.3%(+80.7)#23 | 12.4%(+87.6)#740 |
| 24. | Tierra Amarilla | 90.7% | 19.3%(+71.4)#24 | 12.4%(+78.3)#941 |
| 25. | Flora Vista | 87.9% | 19.3%(+68.6)#25 | 12.4%(+75.5)#967 |
| 26. | Pinedale | 83.3% | 19.3%(+64.1)#26 | 12.4%(+70.9)#1,036 |
| 27. | Mccartys Village | 83.3% | 19.3%(+64.1)#27 | 12.4%(+70.9)#1,039 |
| 28. | Iyanbito | 78.0% | 19.3%(+58.8)#28 | 12.4%(+65.6)#1,136 |
| 29. | Rock Springs | 71.4% | 19.3%(+52.2)#29 | 12.4%(+59.0)#1,281 |
| 30. | Midway | 70.6% | 19.3%(+51.3)#30 | 12.4%(+58.2)#1,327 |
| 31. | Crystal | 70.0% | 19.3%(+50.7)#31 | 12.4%(+57.6)#1,349 |
| 32. | Prewitt | 66.7% | 19.3%(+47.4)#32 | 12.4%(+54.2)#1,446 |
| 33. | Meadow Lake | 63.8% | 19.3%(+44.6)#33 | 12.4%(+51.4)#1,559 |
| 34. | Paraje | 62.9% | 19.3%(+43.6)#34 | 12.4%(+50.4)#1,601 |
| 35. | Lee Acres | 62.5% | 19.3%(+43.2)#35 | 12.4%(+50.1)#1,606 |
| 36. | Hatch | 61.2% | 19.3%(+42.0)#36 | 12.4%(+48.8)#1,666 |
| 37. | Aztec | 59.0% | 19.3%(+39.8)#37 | 12.4%(+46.6)#1,788 |
| 38. | Nageezi | 57.1% | 19.3%(+37.9)#38 | 12.4%(+44.7)#1,865 |
| 39. | Clayton | 56.5% | 19.3%(+37.2)#39 | 12.4%(+44.1)#1,886 |
| 40. | Navajo | 56.4% | 19.3%(+37.1)#40 | 12.4%(+43.9)#1,898 |
| 41. | Newcomb | 55.6% | 19.3%(+36.3)#41 | 12.4%(+43.1)#1,942 |
| 42. | Naschitti | 55.6% | 19.3%(+36.3)#42 | 12.4%(+43.1)#1,945 |
| 43. | Dixon | 53.8% | 19.3%(+34.6)#43 | 12.4%(+41.4)#2,023 |
| 44. | Dulce | 51.6% | 19.3%(+32.3)#44 | 12.4%(+39.2)#2,153 |
| 45. | Pueblo Pintado | 50.0% | 19.3%(+30.7)#45 | 12.4%(+37.6)#2,349 |
| 46. | Lake Valley | 50.0% | 19.3%(+30.7)#46 | 12.4%(+37.6)#2,382 |
| 47. | Waterflow | 48.8% | 19.3%(+29.5)#47 | 12.4%(+36.3)#2,427 |
| 48. | Angustura | 48.6% | 19.3%(+29.4)#48 | 12.4%(+36.2)#2,434 |
| 49. | Thoreau | 48.5% | 19.3%(+29.2)#49 | 12.4%(+36.0)#2,444 |
| 50. | Grants | 47.7% | 19.3%(+28.5)#50 | 12.4%(+35.3)#2,479 |
| 51. | Pena Blanca | 47.4% | 19.3%(+28.1)#51 | 12.4%(+34.9)#2,500 |
| 52. | Tijeras | 46.7% | 19.3%(+27.4)#52 | 12.4%(+34.2)#2,544 |
| 53. | Bosque Farms | 46.4% | 19.3%(+27.2)#53 | 12.4%(+34.0)#2,552 |
| 54. | Mescalero | 45.2% | 19.3%(+25.9)#54 | 12.4%(+32.7)#2,646 |
| 55. | Hurley | 44.8% | 19.3%(+25.6)#55 | 12.4%(+32.4)#2,663 |
| 56. | Chamisal | 42.9% | 19.3%(+23.6)#56 | 12.4%(+30.4)#2,814 |
| 57. | Moriarty | 42.0% | 19.3%(+22.7)#57 | 12.4%(+29.6)#2,871 |
| 58. | Zuni Pueblo | 41.9% | 19.3%(+22.6)#58 | 12.4%(+29.5)#2,879 |
| 59. | Crownpoint | 41.7% | 19.3%(+22.5)#59 | 12.4%(+29.3)#2,888 |
| 60. | Upper Fruitland | 41.2% | 19.3%(+21.9)#60 | 12.4%(+28.7)#2,937 |
| 61. | Twin Lakes | 41.2% | 19.3%(+21.9)#61 | 12.4%(+28.7)#2,943 |
| 62. | Tularosa | 41.0% | 19.3%(+21.8)#62 | 12.4%(+28.6)#2,960 |
| 63. | Church Rock | 40.0% | 19.3%(+20.7)#63 | 12.4%(+27.6)#3,030 |
| 64. | Tesuque Pueblo | 40.0% | 19.3%(+20.7)#64 | 12.4%(+27.6)#3,068 |
| 65. | Ojo Encino | 40.0% | 19.3%(+20.7)#65 | 12.4%(+27.6)#3,070 |
| 66. | Penasco | 39.4% | 19.3%(+20.1)#66 | 12.4%(+27.0)#3,137 |
| 67. | West Hammond | 36.5% | 19.3%(+17.3)#67 | 12.4%(+24.1)#3,366 |
| 68. | Shiprock | 35.4% | 19.3%(+16.1)#68 | 12.4%(+23.0)#3,491 |
| 69. | Portales | 34.9% | 19.3%(+15.6)#69 | 12.4%(+22.4)#3,550 |
| 70. | Gallup | 34.1% | 19.3%(+14.8)#70 | 12.4%(+21.7)#3,615 |
| 71. | Las Vegas | 33.8% | 19.3%(+14.6)#71 | 12.4%(+21.4)#3,630 |
| 72. | San Ildefonso Pueblo | 33.3% | 19.3%(+14.1)#72 | 12.4%(+20.9)#3,715 |
| 73. | Ojo Amarillo | 33.3% | 19.3%(+14.1)#73 | 12.4%(+20.9)#3,753 |
| 74. | Anthony | 32.6% | 19.3%(+13.4)#74 | 12.4%(+20.2)#3,874 |
| 75. | Espanola | 32.5% | 19.3%(+13.2)#75 | 12.4%(+20.0)#3,890 |
| 76. | Casa Colorada | 32.0% | 19.3%(+12.7)#76 | 12.4%(+19.6)#3,947 |
| 77. | La Plata | 31.6% | 19.3%(+12.3)#77 | 12.4%(+19.1)#3,980 |
| 78. | Tano Road | 30.6% | 19.3%(+11.3)#78 | 12.4%(+18.1)#4,102 |
| 79. | Nenahnezad | 29.0% | 19.3%(+9.76)#79 | 12.4%(+16.6)#4,287 |
| 80. | Alamogordo | 28.2% | 19.3%(+8.96)#80 | 12.4%(+15.8)#4,405 |
| 81. | Sundance | 27.8% | 19.3%(+8.50)#81 | 12.4%(+15.3)#4,481 |
| 82. | Clovis | 27.7% | 19.3%(+8.44)#82 | 12.4%(+15.3)#4,487 |
| 83. | Deming | 27.5% | 19.3%(+8.27)#83 | 12.4%(+15.1)#4,503 |
| 84. | Skyline Ganipa | 27.3% | 19.3%(+8.00)#84 | 12.4%(+14.8)#4,542 |
| 85. | Logan | 26.3% | 19.3%(+7.04)#85 | 12.4%(+13.9)#4,676 |
| 86. | El Cerro Mission | 26.1% | 19.3%(+6.86)#86 | 12.4%(+13.7)#4,698 |
| 87. | Cuba | 25.9% | 19.3%(+6.65)#87 | 12.4%(+13.5)#4,740 |
| 88. | Lovington | 25.6% | 19.3%(+6.35)#88 | 12.4%(+13.2)#4,769 |
| 89. | Taos Pueblo | 25.0% | 19.3%(+5.73)#89 | 12.4%(+12.6)#4,861 |
| 90. | Cuyamungue | 25.0% | 19.3%(+5.73)#90 | 12.4%(+12.6)#4,907 |
| 91. | Roy | 25.0% | 19.3%(+5.73)#91 | 12.4%(+12.6)#4,935 |
| 92. | Gallina | 25.0% | 19.3%(+5.73)#92 | 12.4%(+12.6)#4,940 |
| 93. | Ruidoso | 24.0% | 19.3%(+4.75)#93 | 12.4%(+11.6)#5,084 |
| 94. | Indian Hills | 24.0% | 19.3%(+4.73)#94 | 12.4%(+11.6)#5,092 |
| 95. | Santa Clara Pueblo | 24.0% | 19.3%(+4.73)#95 | 12.4%(+11.6)#5,096 |
| 96. | Hobbs | 23.7% | 19.3%(+4.45)#96 | 12.4%(+11.3)#5,139 |
| 97. | Hernandez | 23.5% | 19.3%(+4.26)#97 | 12.4%(+11.1)#5,170 |
| 98. | Las Cruces | 23.4% | 19.3%(+4.09)#98 | 12.4%(+10.9)#5,187 |
| 99. | Raton | 22.7% | 19.3%(+3.45)#99 | 12.4%(+10.3)#5,302 |
| 100. | Truth Or Consequences | 22.7% | 19.3%(+3.45)#100 | 12.4%(+10.3)#5,303 |
Common Questions
What are the Top 10 Cities with the Highest Poverty Level Among Single Males in New Mexico?
Top 10 Cities with the Highest Poverty Level Among Single Males in New Mexico are:
#1
100.0%
#2
100.0%
#3
100.0%
#4
100.0%
#5
100.0%
#6
100.0%
#7
100.0%
#8
100.0%
#9
100.0%
#10
100.0%
What city has the Highest Poverty Level Among Single Males in New Mexico?
University Park has the Highest Poverty Level Among Single Males in New Mexico with 100.0%.
What is the Poverty Level Among Single Males in the State of New Mexico?
Poverty Level Among Single Males in New Mexico is 19.3%.
What is the Poverty Level Among Single Males in the United States?
Poverty Level Among Single Males in the United States is 12.4%.