Las Cruces, NM
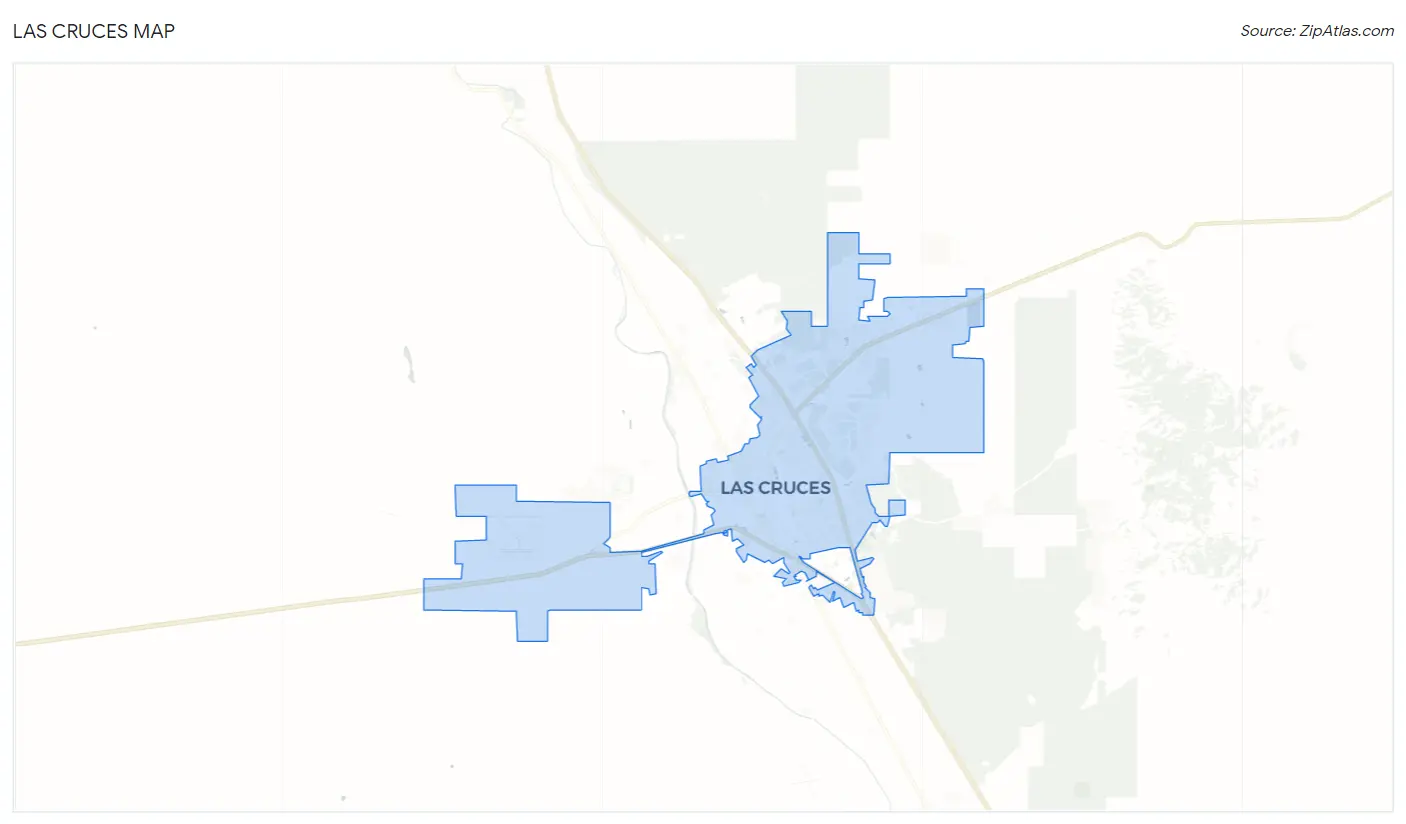
Las Cruces Map
Las Cruces Overview
111,273
TOTAL POPULATION
54,588
MALE POPULATION
56,685
FEMALE POPULATION
96.30
MALES / 100 FEMALES
103.84
FEMALES / 100 MALES
31.8
MEDIAN AGE
3.2
AVG FAMILY SIZE
2.4
AVG HOUSEHOLD SIZE
$28,239
PER CAPITA INCOME
$60,507
AVG FAMILY INCOME
$51,013
AVG HOUSEHOLD INCOME
21.3%
WAGE / INCOME GAP [ % ]
78.7¢/ $1
WAGE / INCOME GAP [ $ ]
$10,685
FAMILY INCOME DEFICIT
0.48
INEQUALITY / GINI INDEX
52,774
LABOR FORCE [ PEOPLE ]
59.5%
PERCENT IN LABOR FORCE
7.5%
UNEMPLOYMENT RATE
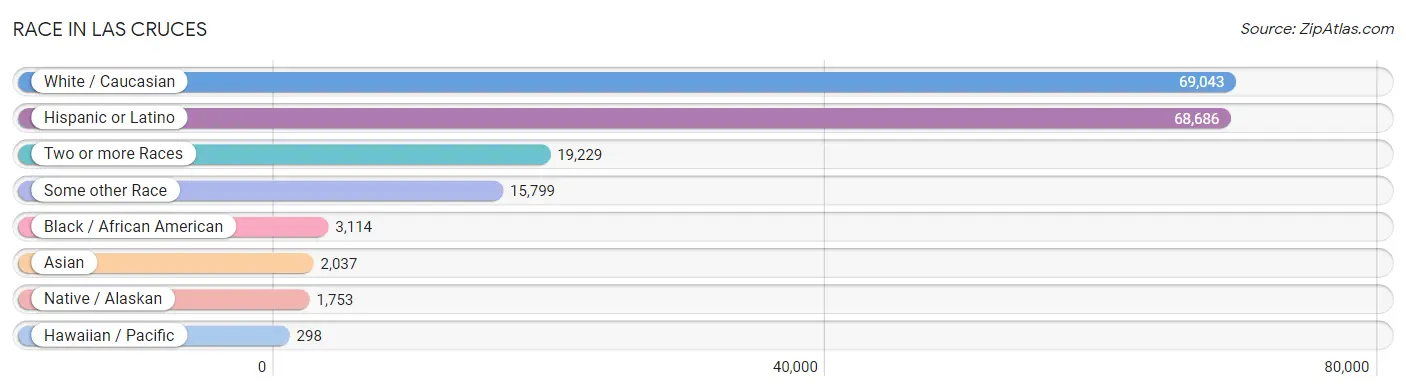
Race in Las Cruces
The most populous races in Las Cruces are White / Caucasian (69,043 | 62.1%), Hispanic or Latino (68,686 | 61.7%), and Two or more Races (19,229 | 17.3%).
| Race | # Population | % Population |
| Asian | 2,037 | 1.8% |
| Black / African American | 3,114 | 2.8% |
| Hawaiian / Pacific | 298 | 0.3% |
| Hispanic or Latino | 68,686 | 61.7% |
| Native / Alaskan | 1,753 | 1.6% |
| White / Caucasian | 69,043 | 62.1% |
| Two or more Races | 19,229 | 17.3% |
| Some other Race | 15,799 | 14.2% |
| Total | 111,273 | 100.0% |
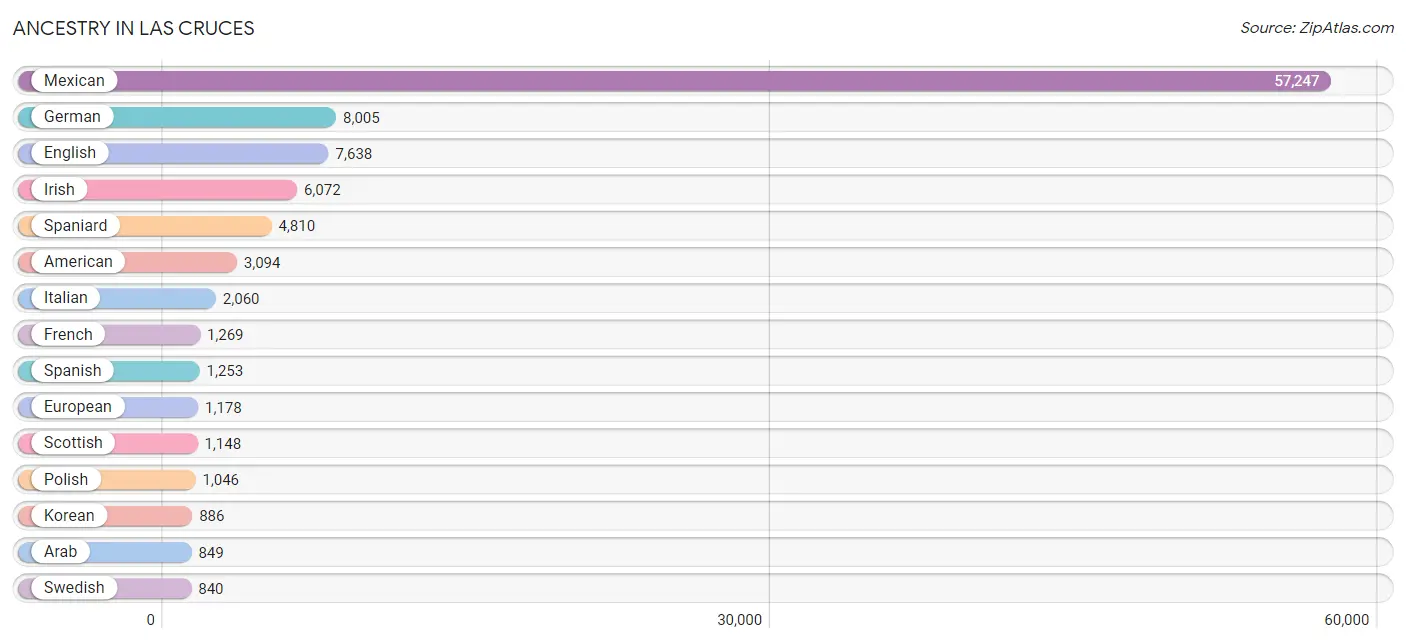
Ancestry in Las Cruces
The most populous ancestries reported in Las Cruces are Mexican (57,247 | 51.4%), German (8,005 | 7.2%), English (7,638 | 6.9%), Irish (6,072 | 5.5%), and Spaniard (4,810 | 4.3%), together accounting for 75.3% of all Las Cruces residents.
| Ancestry | # Population | % Population |
| African | 209 | 0.2% |
| American | 3,094 | 2.8% |
| Apache | 190 | 0.2% |
| Arab | 849 | 0.8% |
| Armenian | 136 | 0.1% |
| Austrian | 133 | 0.1% |
| Barbadian | 17 | 0.0% |
| Belgian | 129 | 0.1% |
| Belizean | 8 | 0.0% |
| Bhutanese | 297 | 0.3% |
| Blackfeet | 17 | 0.0% |
| British | 291 | 0.3% |
| Burmese | 395 | 0.4% |
| Canadian | 25 | 0.0% |
| Central American | 544 | 0.5% |
| Central American Indian | 219 | 0.2% |
| Cherokee | 168 | 0.2% |
| Cheyenne | 75 | 0.1% |
| Chickasaw | 25 | 0.0% |
| Chippewa | 44 | 0.0% |
| Choctaw | 25 | 0.0% |
| Colombian | 27 | 0.0% |
| Comanche | 188 | 0.2% |
| Creek | 37 | 0.0% |
| Croatian | 23 | 0.0% |
| Cuban | 149 | 0.1% |
| Czech | 329 | 0.3% |
| Czechoslovakian | 66 | 0.1% |
| Danish | 326 | 0.3% |
| Dominican | 39 | 0.0% |
| Dutch | 794 | 0.7% |
| Eastern European | 273 | 0.3% |
| English | 7,638 | 6.9% |
| Estonian | 33 | 0.0% |
| European | 1,178 | 1.1% |
| Finnish | 16 | 0.0% |
| French | 1,269 | 1.1% |
| French Canadian | 244 | 0.2% |
| German | 8,005 | 7.2% |
| Greek | 361 | 0.3% |
| Honduran | 59 | 0.1% |
| Hopi | 23 | 0.0% |
| Hungarian | 293 | 0.3% |
| Indian (Asian) | 504 | 0.4% |
| Iranian | 79 | 0.1% |
| Irish | 6,072 | 5.5% |
| Italian | 2,060 | 1.8% |
| Jamaican | 85 | 0.1% |
| Kiowa | 8 | 0.0% |
| Korean | 886 | 0.8% |
| Latvian | 28 | 0.0% |
| Lebanese | 267 | 0.2% |
| Lithuanian | 180 | 0.2% |
| Mexican | 57,247 | 51.4% |
| Mexican American Indian | 375 | 0.3% |
| Native Hawaiian | 127 | 0.1% |
| Navajo | 707 | 0.6% |
| Nicaraguan | 18 | 0.0% |
| Nigerian | 480 | 0.4% |
| Northern European | 118 | 0.1% |
| Norwegian | 702 | 0.6% |
| Pakistani | 50 | 0.0% |
| Panamanian | 210 | 0.2% |
| Pennsylvania German | 12 | 0.0% |
| Peruvian | 17 | 0.0% |
| Polish | 1,046 | 0.9% |
| Portuguese | 545 | 0.5% |
| Pueblo | 500 | 0.4% |
| Puerto Rican | 730 | 0.7% |
| Romanian | 65 | 0.1% |
| Russian | 391 | 0.4% |
| Salvadoran | 257 | 0.2% |
| Samoan | 181 | 0.2% |
| Scandinavian | 286 | 0.3% |
| Scotch-Irish | 580 | 0.5% |
| Scottish | 1,148 | 1.0% |
| Serbian | 10 | 0.0% |
| Sioux | 2 | 0.0% |
| Slovak | 160 | 0.1% |
| Slovene | 45 | 0.0% |
| South American | 88 | 0.1% |
| Spaniard | 4,810 | 4.3% |
| Spanish | 1,253 | 1.1% |
| Spanish American | 163 | 0.2% |
| Sri Lankan | 99 | 0.1% |
| Subsaharan African | 704 | 0.6% |
| Swedish | 840 | 0.7% |
| Swiss | 92 | 0.1% |
| Syrian | 142 | 0.1% |
| Thai | 482 | 0.4% |
| Tohono O'Odham | 70 | 0.1% |
| Turkish | 18 | 0.0% |
| U.S. Virgin Islander | 15 | 0.0% |
| Ukrainian | 33 | 0.0% |
| Venezuelan | 44 | 0.0% |
| Vietnamese | 273 | 0.3% |
| Welsh | 461 | 0.4% |
| West Indian | 7 | 0.0% |
| Yaqui | 41 | 0.0% | View All 99 Rows |
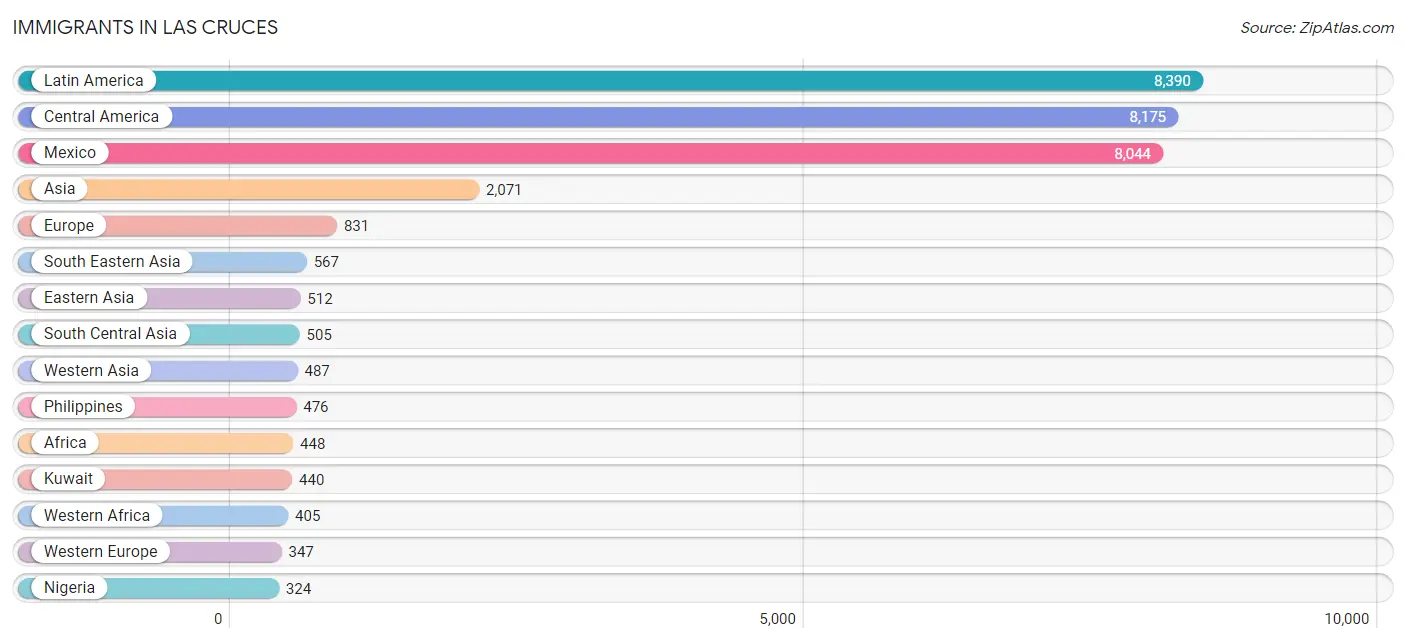
Immigrants in Las Cruces
The most numerous immigrant groups reported in Las Cruces came from Latin America (8,390 | 7.5%), Central America (8,175 | 7.3%), Mexico (8,044 | 7.2%), Asia (2,071 | 1.9%), and Europe (831 | 0.7%), together accounting for 24.7% of all Las Cruces residents.
| Immigration Origin | # Population | % Population |
| Africa | 448 | 0.4% |
| Argentina | 70 | 0.1% |
| Asia | 2,071 | 1.9% |
| Australia | 6 | 0.0% |
| Bangladesh | 182 | 0.2% |
| Belgium | 14 | 0.0% |
| Belize | 8 | 0.0% |
| Canada | 105 | 0.1% |
| Caribbean | 47 | 0.0% |
| Central America | 8,175 | 7.3% |
| China | 140 | 0.1% |
| Cuba | 47 | 0.0% |
| Czechoslovakia | 23 | 0.0% |
| Eastern Africa | 41 | 0.0% |
| Eastern Asia | 512 | 0.5% |
| Eastern Europe | 294 | 0.3% |
| El Salvador | 123 | 0.1% |
| England | 22 | 0.0% |
| Europe | 831 | 0.7% |
| Fiji | 17 | 0.0% |
| Germany | 260 | 0.2% |
| Ghana | 66 | 0.1% |
| Hong Kong | 26 | 0.0% |
| Hungary | 68 | 0.1% |
| India | 193 | 0.2% |
| Iran | 84 | 0.1% |
| Italy | 29 | 0.0% |
| Japan | 126 | 0.1% |
| Korea | 246 | 0.2% |
| Kuwait | 440 | 0.4% |
| Latin America | 8,390 | 7.5% |
| Mexico | 8,044 | 7.2% |
| Nepal | 18 | 0.0% |
| Netherlands | 73 | 0.1% |
| Nigeria | 324 | 0.3% |
| Northern Europe | 76 | 0.1% |
| Oceania | 43 | 0.0% |
| Peru | 54 | 0.1% |
| Philippines | 476 | 0.4% |
| Poland | 108 | 0.1% |
| Romania | 65 | 0.1% |
| Russia | 12 | 0.0% |
| South Africa | 2 | 0.0% |
| South America | 168 | 0.2% |
| South Central Asia | 505 | 0.4% |
| South Eastern Asia | 567 | 0.5% |
| Southern Europe | 114 | 0.1% |
| Spain | 85 | 0.1% |
| Sri Lanka | 28 | 0.0% |
| Sweden | 14 | 0.0% |
| Syria | 47 | 0.0% |
| Uganda | 41 | 0.0% |
| Venezuela | 44 | 0.0% |
| Vietnam | 91 | 0.1% |
| Western Africa | 405 | 0.4% |
| Western Asia | 487 | 0.4% |
| Western Europe | 347 | 0.3% | View All 57 Rows |
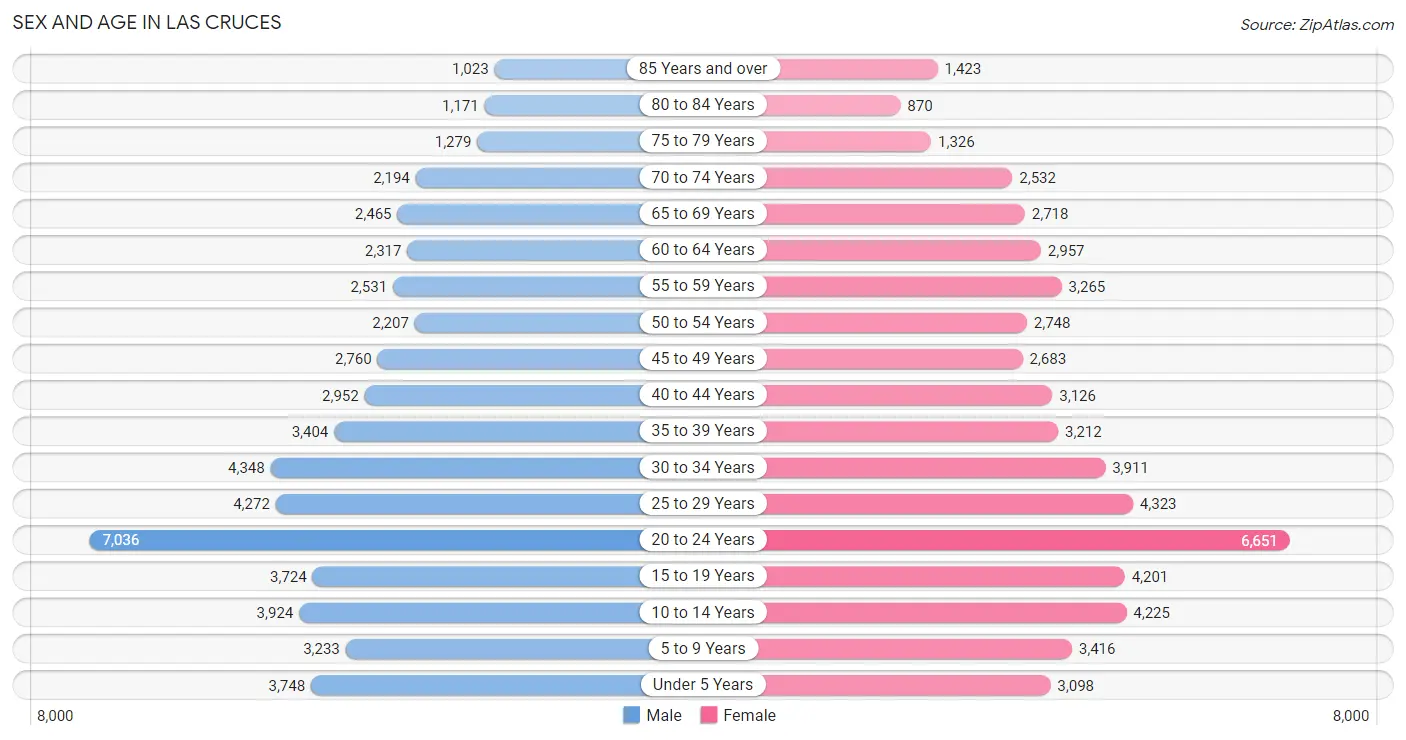
Sex and Age in Las Cruces
Sex and Age in Las Cruces
The most populous age groups in Las Cruces are 20 to 24 Years (7,036 | 12.9%) for men and 20 to 24 Years (6,651 | 11.7%) for women.
| Age Bracket | Male | Female |
| Under 5 Years | 3,748 (6.9%) | 3,098 (5.5%) |
| 5 to 9 Years | 3,233 (5.9%) | 3,416 (6.0%) |
| 10 to 14 Years | 3,924 (7.2%) | 4,225 (7.4%) |
| 15 to 19 Years | 3,724 (6.8%) | 4,201 (7.4%) |
| 20 to 24 Years | 7,036 (12.9%) | 6,651 (11.7%) |
| 25 to 29 Years | 4,272 (7.8%) | 4,323 (7.6%) |
| 30 to 34 Years | 4,348 (8.0%) | 3,911 (6.9%) |
| 35 to 39 Years | 3,404 (6.2%) | 3,212 (5.7%) |
| 40 to 44 Years | 2,952 (5.4%) | 3,126 (5.5%) |
| 45 to 49 Years | 2,760 (5.1%) | 2,683 (4.7%) |
| 50 to 54 Years | 2,207 (4.0%) | 2,748 (4.9%) |
| 55 to 59 Years | 2,531 (4.6%) | 3,265 (5.8%) |
| 60 to 64 Years | 2,317 (4.2%) | 2,957 (5.2%) |
| 65 to 69 Years | 2,465 (4.5%) | 2,718 (4.8%) |
| 70 to 74 Years | 2,194 (4.0%) | 2,532 (4.5%) |
| 75 to 79 Years | 1,279 (2.3%) | 1,326 (2.3%) |
| 80 to 84 Years | 1,171 (2.1%) | 870 (1.5%) |
| 85 Years and over | 1,023 (1.9%) | 1,423 (2.5%) |
| Total | 54,588 (100.0%) | 56,685 (100.0%) |
Families and Households in Las Cruces
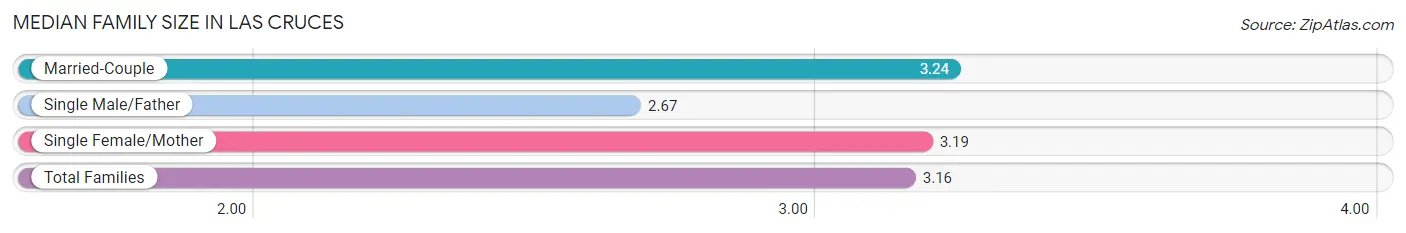
Median Family Size in Las Cruces
The median family size in Las Cruces is 3.16 persons per family, with married-couple families (15,871 | 62.2%) accounting for the largest median family size of 3.24 persons per family. On the other hand, single male/father families (3,171 | 12.4%) represent the smallest median family size with 2.67 persons per family.
| Family Type | # Families | Family Size |
| Married-Couple | 15,871 (62.2%) | 3.24 |
| Single Male/Father | 3,171 (12.4%) | 2.67 |
| Single Female/Mother | 6,483 (25.4%) | 3.19 |
| Total Families | 25,525 (100.0%) | 3.16 |
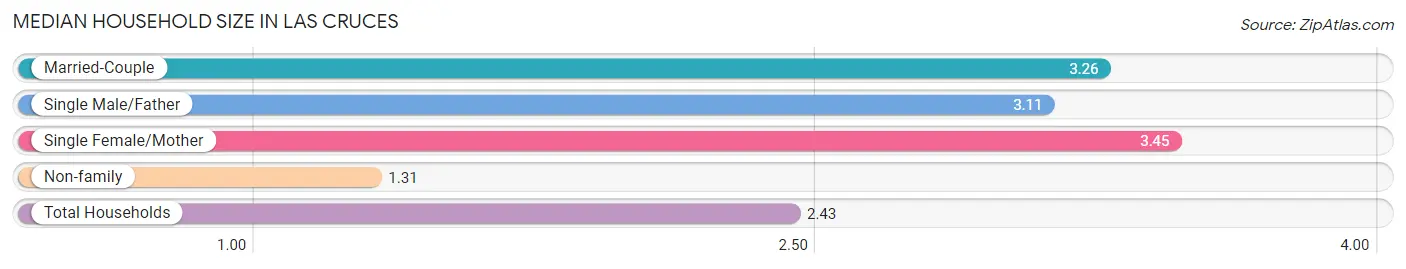
Median Household Size in Las Cruces
The median household size in Las Cruces is 2.43 persons per household, with single female/mother households (6,483 | 14.3%) accounting for the largest median household size of 3.45 persons per household. non-family households (19,772 | 43.6%) represent the smallest median household size with 1.31 persons per household.
| Household Type | # Households | Household Size |
| Married-Couple | 15,871 (35.0%) | 3.26 |
| Single Male/Father | 3,171 (7.0%) | 3.11 |
| Single Female/Mother | 6,483 (14.3%) | 3.45 |
| Non-family | 19,772 (43.6%) | 1.31 |
| Total Households | 45,297 (100.0%) | 2.43 |
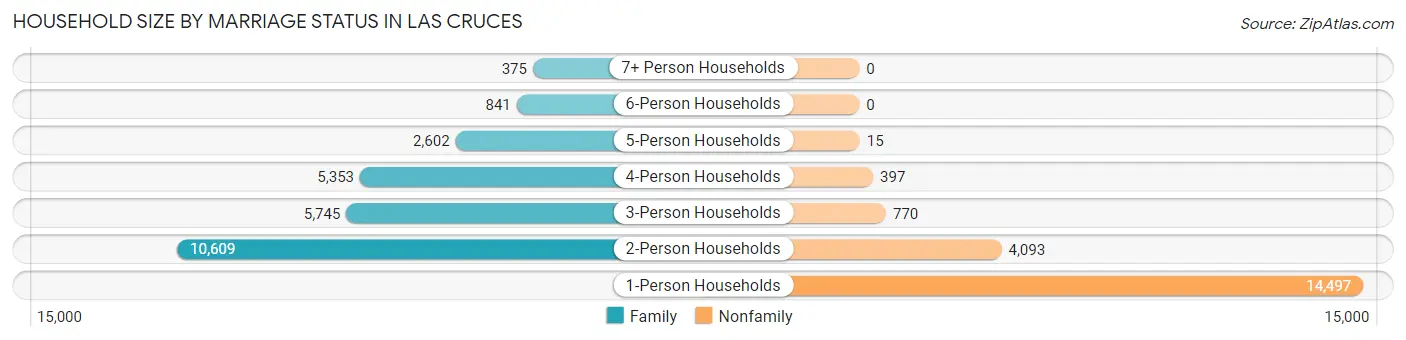
Household Size by Marriage Status in Las Cruces
Out of a total of 45,297 households in Las Cruces, 25,525 (56.4%) are family households, while 19,772 (43.6%) are nonfamily households. The most numerous type of family households are 2-person households, comprising 10,609, and the most common type of nonfamily households are 1-person households, comprising 14,497.
| Household Size | Family Households | Nonfamily Households |
| 1-Person Households | - | 14,497 (32.0%) |
| 2-Person Households | 10,609 (23.4%) | 4,093 (9.0%) |
| 3-Person Households | 5,745 (12.7%) | 770 (1.7%) |
| 4-Person Households | 5,353 (11.8%) | 397 (0.9%) |
| 5-Person Households | 2,602 (5.7%) | 15 (0.0%) |
| 6-Person Households | 841 (1.9%) | 0 (0.0%) |
| 7+ Person Households | 375 (0.8%) | 0 (0.0%) |
| Total | 25,525 (56.4%) | 19,772 (43.6%) |
Female Fertility in Las Cruces
Fertility by Age in Las Cruces
Average fertility rate in Las Cruces is 52.0 births per 1,000 women. Women in the age bracket of 20 to 34 years have the highest fertility rate with 82.0 births per 1,000 women. Women in the age bracket of 20 to 34 years acount for 81.4% of all women with births.
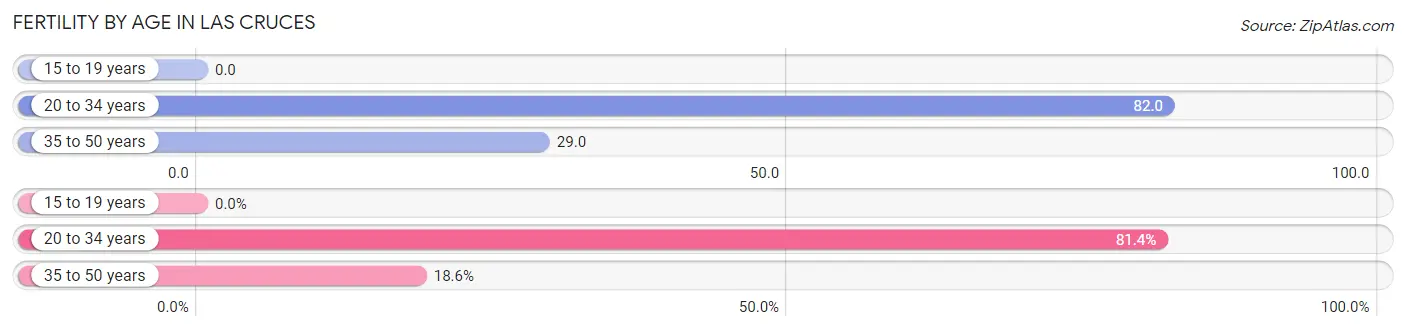
| Age Bracket | Women with Births | Births / 1,000 Women |
| 15 to 19 years | 0 (0.0%) | 0.0 |
| 20 to 34 years | 1,220 (81.4%) | 82.0 |
| 35 to 50 years | 278 (18.6%) | 29.0 |
| Total | 1,498 (100.0%) | 52.0 |
Fertility by Age by Marriage Status in Las Cruces
66.2% of women with births (1,498) in Las Cruces are married. The highest percentage of unmarried women with births falls into 20 to 34 years age bracket with 39.9% of them unmarried at the time of birth, while the lowest percentage of unmarried women with births belong to 35 to 50 years age bracket with 6.8% of them unmarried.
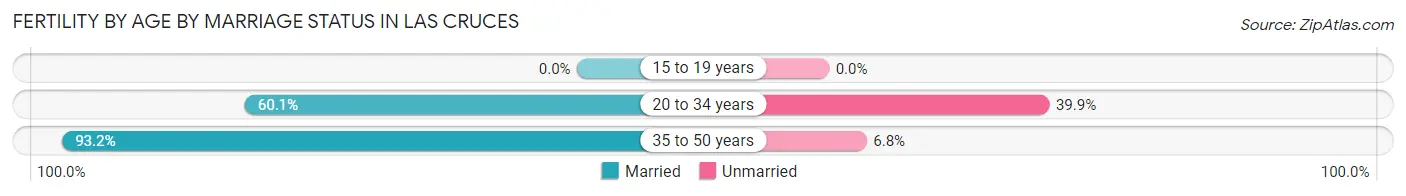
| Age Bracket | Married | Unmarried |
| 15 to 19 years | 0 (0.0%) | 0 (0.0%) |
| 20 to 34 years | 733 (60.1%) | 487 (39.9%) |
| 35 to 50 years | 259 (93.2%) | 19 (6.8%) |
| Total | 992 (66.2%) | 506 (33.8%) |
Fertility by Education in Las Cruces
Average fertility rate in Las Cruces is 52.0 births per 1,000 women. Women with the education attainment of college or associate's degree have the highest fertility rate of 80.0 births per 1,000 women, while women with the education attainment of less than high school have the lowest fertility at 9.0 births per 1,000 women. Women with the education attainment of college or associate's degree represent 55.5% of all women with births.
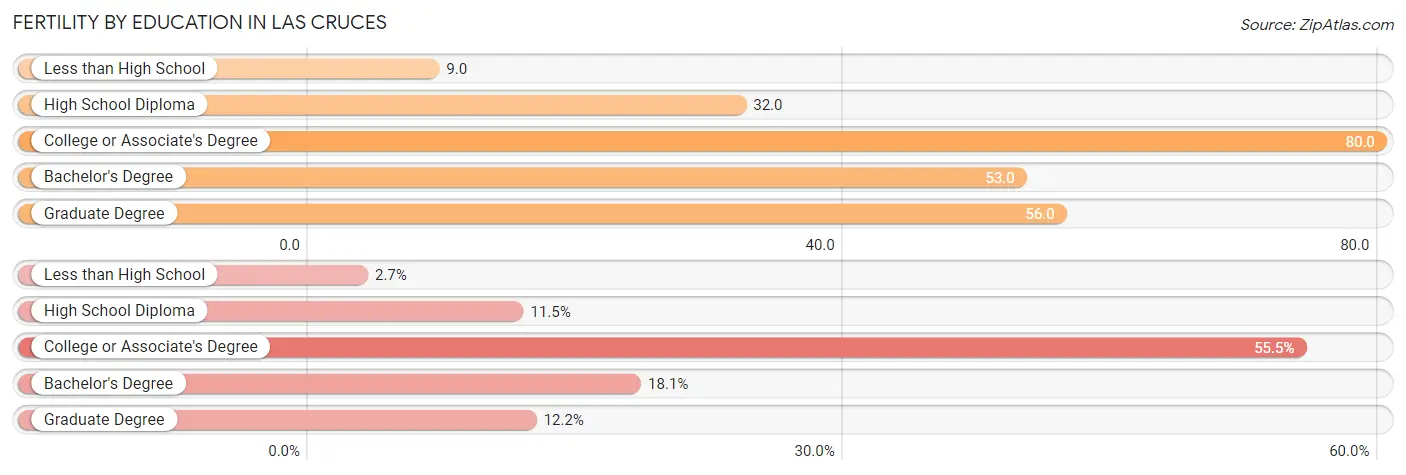
| Educational Attainment | Women with Births | Births / 1,000 Women |
| Less than High School | 41 (2.7%) | 9.0 |
| High School Diploma | 172 (11.5%) | 32.0 |
| College or Associate's Degree | 831 (55.5%) | 80.0 |
| Bachelor's Degree | 271 (18.1%) | 53.0 |
| Graduate Degree | 183 (12.2%) | 56.0 |
| Total | 1,498 (100.0%) | 52.0 |
Fertility by Education by Marriage Status in Las Cruces
33.8% of women with births in Las Cruces are unmarried. Women with the educational attainment of bachelor's degree are most likely to be married with 100.0% of them married at childbirth, while women with the educational attainment of less than high school are least likely to be married with 100.0% of them unmarried at childbirth.
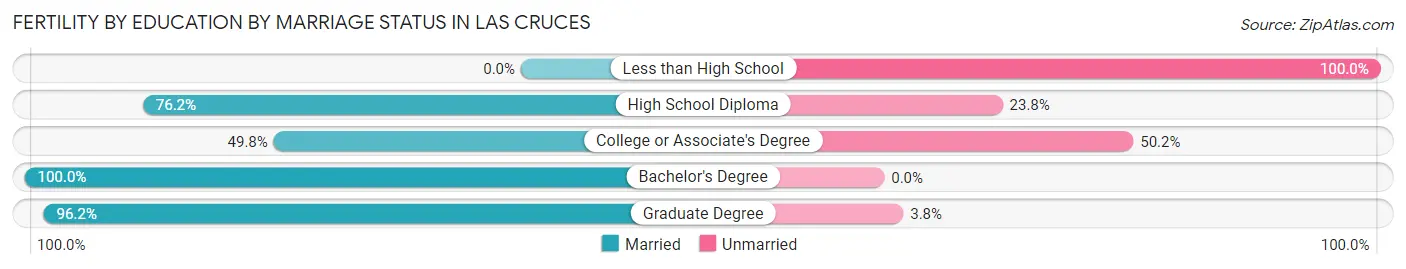
| Educational Attainment | Married | Unmarried |
| Less than High School | 0 (0.0%) | 41 (100.0%) |
| High School Diploma | 131 (76.2%) | 41 (23.8%) |
| College or Associate's Degree | 414 (49.8%) | 417 (50.2%) |
| Bachelor's Degree | 271 (100.0%) | 0 (0.0%) |
| Graduate Degree | 176 (96.2%) | 7 (3.8%) |
| Total | 992 (66.2%) | 506 (33.8%) |
Income in Las Cruces
Income Overview in Las Cruces
Per Capita Income in Las Cruces is $28,239, while median incomes of families and households are $60,507 and $51,013 respectively.
| Characteristic | Number | Measure |
| Per Capita Income | 111,273 | $28,239 |
| Median Family Income | 25,525 | $60,507 |
| Mean Family Income | 25,525 | $81,446 |
| Median Household Income | 45,297 | $51,013 |
| Mean Household Income | 45,297 | $68,261 |
| Income Deficit | 25,525 | $10,685 |
| Wage / Income Gap (%) | 111,273 | 21.29% |
| Wage / Income Gap ($) | 111,273 | 78.71¢ per $1 |
| Gini / Inequality Index | 111,273 | 0.48 |
Earnings by Sex in Las Cruces
Average Earnings in Las Cruces are $29,486, $32,207 for men and $25,350 for women, a difference of 21.3%.
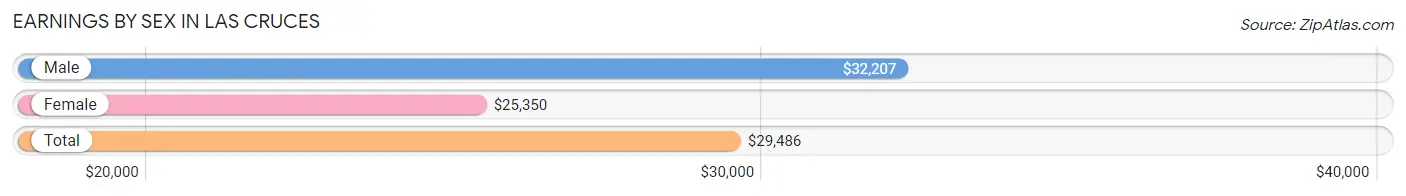
| Sex | Number | Average Earnings |
| Male | 28,316 (52.0%) | $32,207 |
| Female | 26,130 (48.0%) | $25,350 |
| Total | 54,446 (100.0%) | $29,486 |
Earnings by Sex by Income Bracket in Las Cruces
The most common earnings brackets in Las Cruces are $100,000+ for men (3,338 | 11.8%) and $55,000 to $64,999 for women (2,553 | 9.8%).
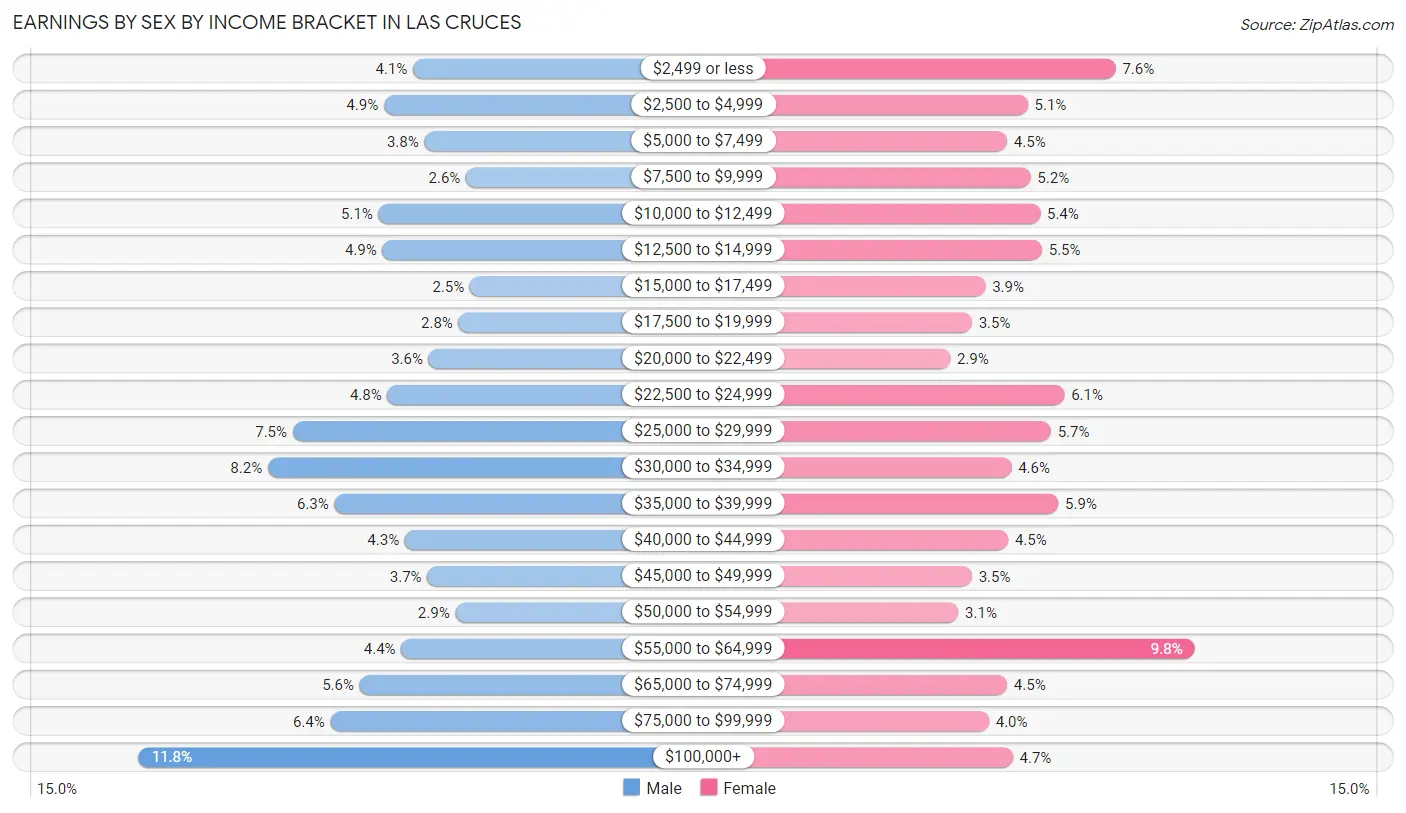
| Income | Male | Female |
| $2,499 or less | 1,154 (4.1%) | 1,974 (7.5%) |
| $2,500 to $4,999 | 1,388 (4.9%) | 1,327 (5.1%) |
| $5,000 to $7,499 | 1,064 (3.8%) | 1,176 (4.5%) |
| $7,500 to $9,999 | 732 (2.6%) | 1,348 (5.2%) |
| $10,000 to $12,499 | 1,431 (5.1%) | 1,420 (5.4%) |
| $12,500 to $14,999 | 1,398 (4.9%) | 1,433 (5.5%) |
| $15,000 to $17,499 | 703 (2.5%) | 1,016 (3.9%) |
| $17,500 to $19,999 | 794 (2.8%) | 918 (3.5%) |
| $20,000 to $22,499 | 1,031 (3.6%) | 757 (2.9%) |
| $22,500 to $24,999 | 1,359 (4.8%) | 1,596 (6.1%) |
| $25,000 to $29,999 | 2,111 (7.5%) | 1,497 (5.7%) |
| $30,000 to $34,999 | 2,310 (8.2%) | 1,207 (4.6%) |
| $35,000 to $39,999 | 1,782 (6.3%) | 1,553 (5.9%) |
| $40,000 to $44,999 | 1,220 (4.3%) | 1,183 (4.5%) |
| $45,000 to $49,999 | 1,043 (3.7%) | 917 (3.5%) |
| $50,000 to $54,999 | 818 (2.9%) | 817 (3.1%) |
| $55,000 to $64,999 | 1,248 (4.4%) | 2,553 (9.8%) |
| $65,000 to $74,999 | 1,579 (5.6%) | 1,177 (4.5%) |
| $75,000 to $99,999 | 1,813 (6.4%) | 1,043 (4.0%) |
| $100,000+ | 3,338 (11.8%) | 1,218 (4.7%) |
| Total | 28,316 (100.0%) | 26,130 (100.0%) |
Earnings by Sex by Educational Attainment in Las Cruces
Average earnings in Las Cruces are $38,569 for men and $35,631 for women, a difference of 7.6%. Men with an educational attainment of graduate degree enjoy the highest average annual earnings of $70,032, while those with less than high school education earn the least with $28,528. Women with an educational attainment of graduate degree earn the most with the average annual earnings of $61,971, while those with less than high school education have the smallest earnings of $11,821.
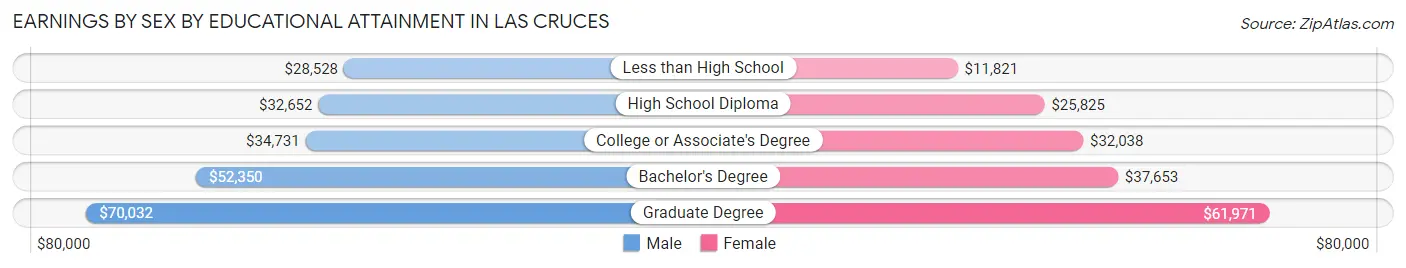
| Educational Attainment | Male Income | Female Income |
| Less than High School | $28,528 | $11,821 |
| High School Diploma | $32,652 | $25,825 |
| College or Associate's Degree | $34,731 | $32,038 |
| Bachelor's Degree | $52,350 | $37,653 |
| Graduate Degree | $70,032 | $61,971 |
| Total | $38,569 | $35,631 |
Family Income in Las Cruces
Family Income Brackets in Las Cruces
According to the Las Cruces family income data, there are 4,952 families falling into the $50,000 to $74,999 income range, which is the most common income bracket and makes up 19.4% of all families. Conversely, the $10,000 to $14,999 income bracket is the least frequent group with only 1,174 families (4.6%) belonging to this category.
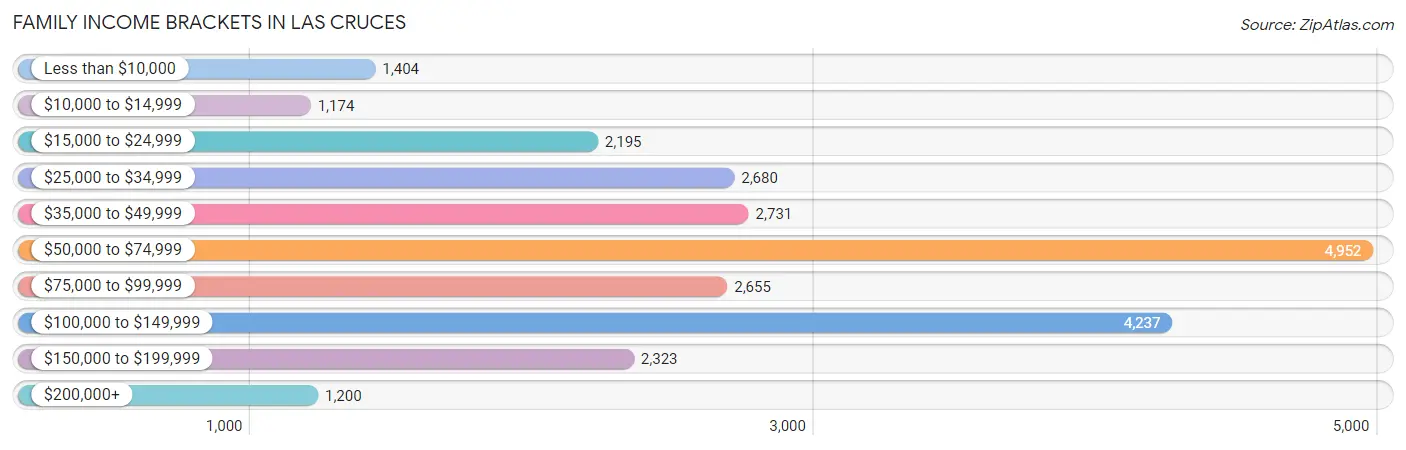
| Income Bracket | # Families | % Families |
| Less than $10,000 | 1,404 | 5.5% |
| $10,000 to $14,999 | 1,174 | 4.6% |
| $15,000 to $24,999 | 2,195 | 8.6% |
| $25,000 to $34,999 | 2,680 | 10.5% |
| $35,000 to $49,999 | 2,731 | 10.7% |
| $50,000 to $74,999 | 4,952 | 19.4% |
| $75,000 to $99,999 | 2,655 | 10.4% |
| $100,000 to $149,999 | 4,237 | 16.6% |
| $150,000 to $199,999 | 2,323 | 9.1% |
| $200,000+ | 1,200 | 4.7% |
Family Income by Famaliy Size in Las Cruces
7+ person families (295 | 1.2%) account for the highest median family income in Las Cruces with $82,604 per family, while 2-person families (12,148 | 47.6%) have the highest median income of $28,330 per family member.
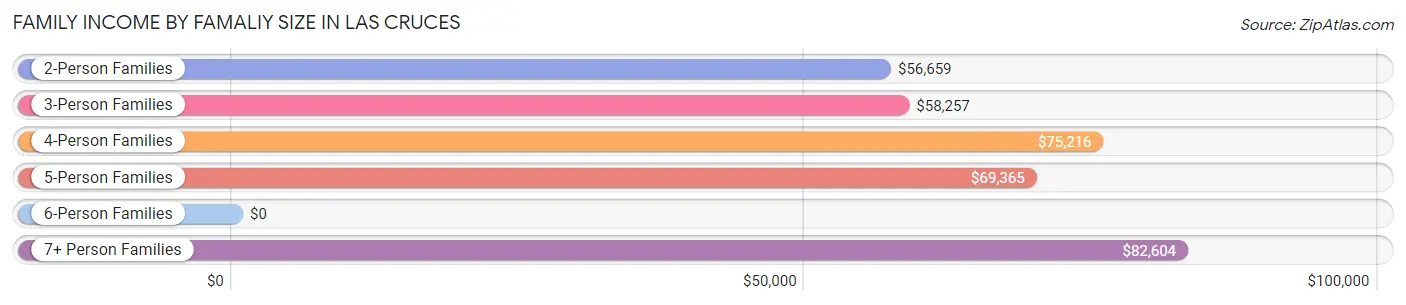
| Income Bracket | # Families | Median Income |
| 2-Person Families | 12,148 (47.6%) | $56,659 |
| 3-Person Families | 5,638 (22.1%) | $58,257 |
| 4-Person Families | 4,179 (16.4%) | $75,216 |
| 5-Person Families | 2,583 (10.1%) | $69,365 |
| 6-Person Families | 682 (2.7%) | $0 |
| 7+ Person Families | 295 (1.2%) | $82,604 |
| Total | 25,525 (100.0%) | $60,507 |
Family Income by Number of Earners in Las Cruces
The median family income in Las Cruces is $60,507, with families comprising 3+ earners (2,077) having the highest median family income of $117,034, while families with 1 earner (10,079) have the lowest median family income of $41,571, accounting for 8.1% and 39.5% of families, respectively.
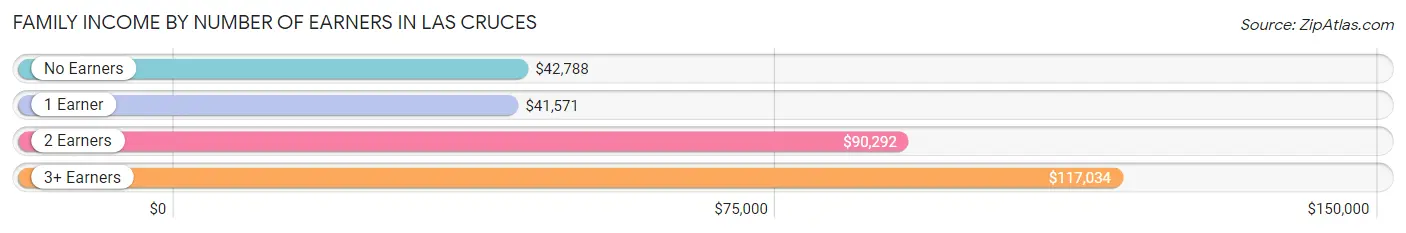
| Number of Earners | # Families | Median Income |
| No Earners | 4,931 (19.3%) | $42,788 |
| 1 Earner | 10,079 (39.5%) | $41,571 |
| 2 Earners | 8,438 (33.1%) | $90,292 |
| 3+ Earners | 2,077 (8.1%) | $117,034 |
| Total | 25,525 (100.0%) | $60,507 |
Household Income in Las Cruces
Household Income Brackets in Las Cruces
With 8,063 households falling in the category, the $50,000 to $74,999 income range is the most frequent in Las Cruces, accounting for 17.8% of all households. In contrast, only 1,631 households (3.6%) fall into the $200,000+ income bracket, making it the least populous group.
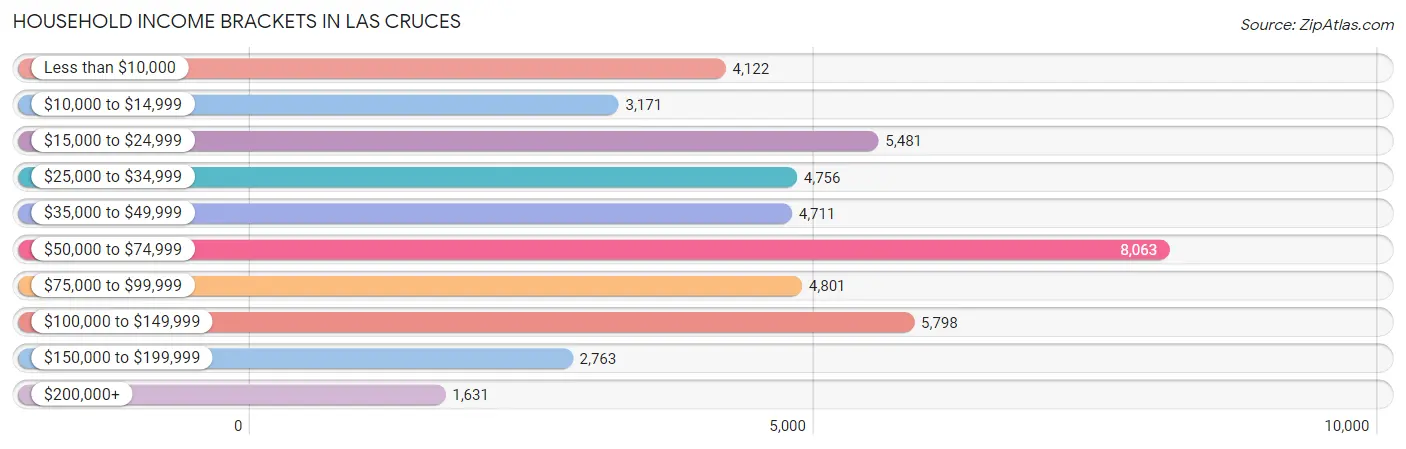
| Income Bracket | # Households | % Households |
| Less than $10,000 | 4,122 | 9.1% |
| $10,000 to $14,999 | 3,171 | 7.0% |
| $15,000 to $24,999 | 5,481 | 12.1% |
| $25,000 to $34,999 | 4,756 | 10.5% |
| $35,000 to $49,999 | 4,711 | 10.4% |
| $50,000 to $74,999 | 8,063 | 17.8% |
| $75,000 to $99,999 | 4,801 | 10.6% |
| $100,000 to $149,999 | 5,798 | 12.8% |
| $150,000 to $199,999 | 2,763 | 6.1% |
| $200,000+ | 1,631 | 3.6% |
Household Income by Householder Age in Las Cruces
The median household income in Las Cruces is $51,013, with the highest median household income of $61,726 found in the 45 to 64 years age bracket for the primary householder. A total of 12,791 households (28.2%) fall into this category. Meanwhile, the 15 to 24 years age bracket for the primary householder has the lowest median household income of $21,527, with 5,674 households (12.5%) in this group.
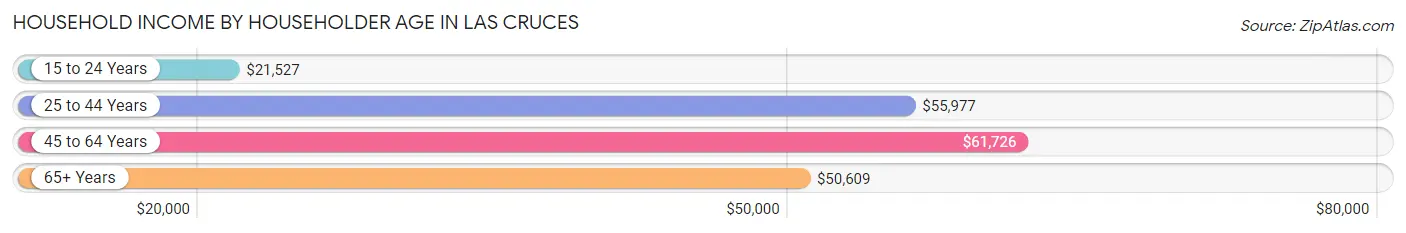
| Income Bracket | # Households | Median Income |
| 15 to 24 Years | 5,674 (12.5%) | $21,527 |
| 25 to 44 Years | 16,048 (35.4%) | $55,977 |
| 45 to 64 Years | 12,791 (28.2%) | $61,726 |
| 65+ Years | 10,784 (23.8%) | $50,609 |
| Total | 45,297 (100.0%) | $51,013 |
Poverty in Las Cruces
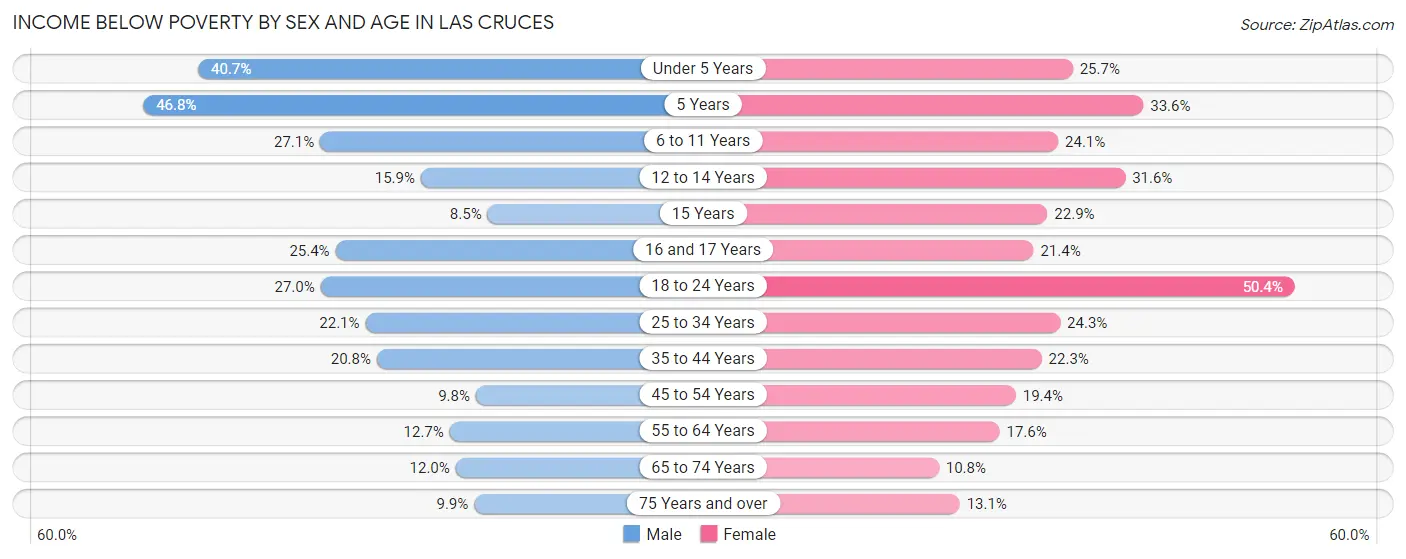
Income Below Poverty by Sex and Age in Las Cruces
With 20.9% poverty level for males and 25.3% for females among the residents of Las Cruces, 5 year old males and 18 to 24 year old females are the most vulnerable to poverty, with 357 males (46.8%) and 4,307 females (50.4%) in their respective age groups living below the poverty level.
| Age Bracket | Male | Female |
| Under 5 Years | 1,505 (40.7%) | 796 (25.7%) |
| 5 Years | 357 (46.8%) | 179 (33.6%) |
| 6 to 11 Years | 1,147 (27.1%) | 1,080 (24.1%) |
| 12 to 14 Years | 341 (15.9%) | 796 (31.6%) |
| 15 Years | 35 (8.5%) | 117 (22.9%) |
| 16 and 17 Years | 317 (25.4%) | 370 (21.3%) |
| 18 to 24 Years | 2,416 (27.0%) | 4,307 (50.4%) |
| 25 to 34 Years | 1,875 (22.1%) | 1,973 (24.3%) |
| 35 to 44 Years | 1,296 (20.8%) | 1,399 (22.3%) |
| 45 to 54 Years | 480 (9.8%) | 1,049 (19.4%) |
| 55 to 64 Years | 612 (12.7%) | 1,093 (17.6%) |
| 65 to 74 Years | 558 (12.0%) | 557 (10.8%) |
| 75 Years and over | 336 (9.9%) | 468 (13.1%) |
| Total | 11,275 (20.9%) | 14,184 (25.3%) |
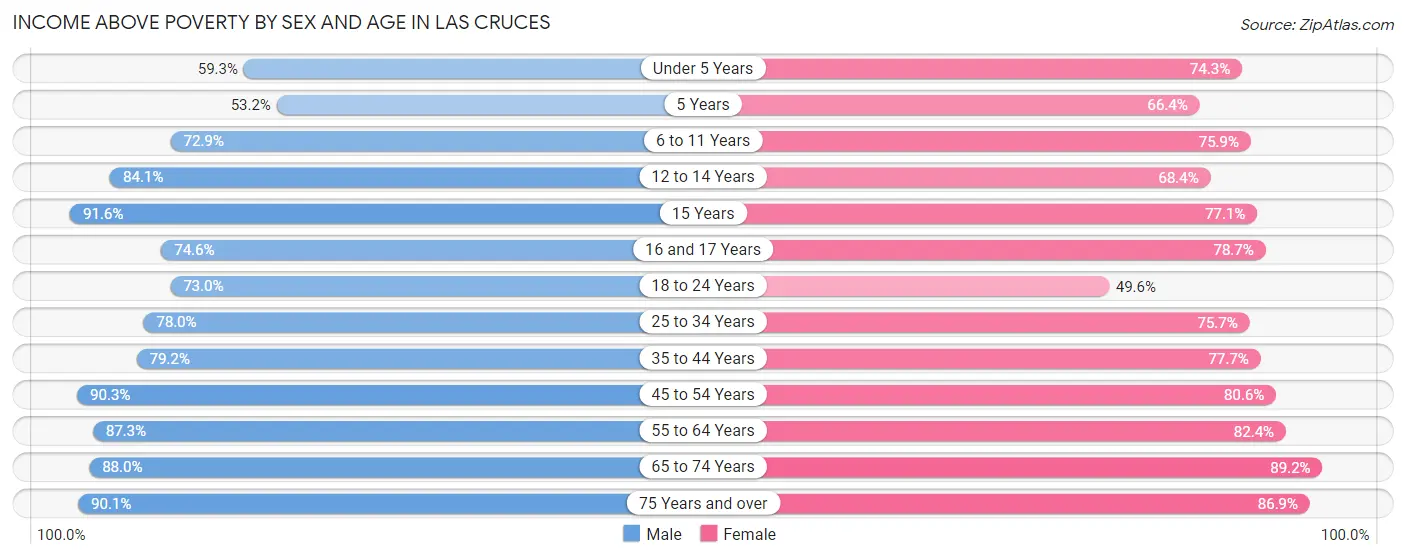
Income Above Poverty by Sex and Age in Las Cruces
According to the poverty statistics in Las Cruces, males aged 15 years and females aged 65 to 74 years are the age groups that are most secure financially, with 91.5% of males and 89.2% of females in these age groups living above the poverty line.
| Age Bracket | Male | Female |
| Under 5 Years | 2,195 (59.3%) | 2,299 (74.3%) |
| 5 Years | 406 (53.2%) | 354 (66.4%) |
| 6 to 11 Years | 3,085 (72.9%) | 3,404 (75.9%) |
| 12 to 14 Years | 1,807 (84.1%) | 1,726 (68.4%) |
| 15 Years | 379 (91.5%) | 394 (77.1%) |
| 16 and 17 Years | 932 (74.6%) | 1,363 (78.6%) |
| 18 to 24 Years | 6,520 (73.0%) | 4,232 (49.6%) |
| 25 to 34 Years | 6,628 (77.9%) | 6,141 (75.7%) |
| 35 to 44 Years | 4,941 (79.2%) | 4,887 (77.7%) |
| 45 to 54 Years | 4,444 (90.2%) | 4,363 (80.6%) |
| 55 to 64 Years | 4,218 (87.3%) | 5,128 (82.4%) |
| 65 to 74 Years | 4,093 (88.0%) | 4,600 (89.2%) |
| 75 Years and over | 3,043 (90.1%) | 3,097 (86.9%) |
| Total | 42,691 (79.1%) | 41,988 (74.8%) |
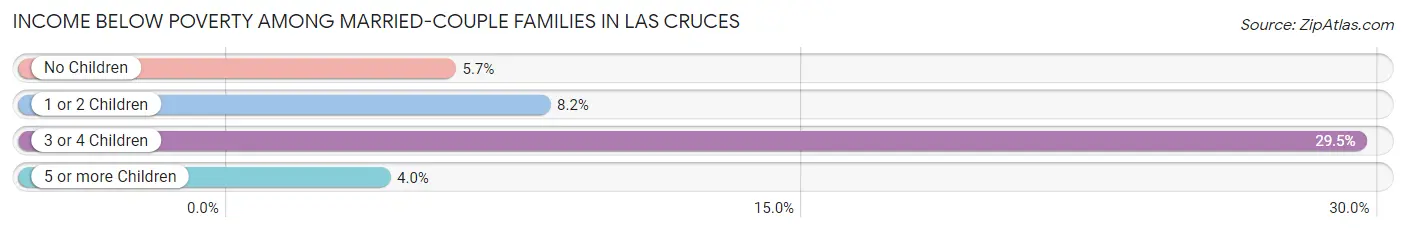
Income Below Poverty Among Married-Couple Families in Las Cruces
The poverty statistics for married-couple families in Las Cruces show that 9.6% or 1,516 of the total 15,871 families live below the poverty line. Families with 3 or 4 children have the highest poverty rate of 29.5%, comprising of 631 families. On the other hand, families with 5 or more children have the lowest poverty rate of 4.0%, which includes 5 families.
| Children | Above Poverty | Below Poverty |
| No Children | 8,735 (94.3%) | 526 (5.7%) |
| 1 or 2 Children | 3,990 (91.8%) | 354 (8.2%) |
| 3 or 4 Children | 1,509 (70.5%) | 631 (29.5%) |
| 5 or more Children | 121 (96.0%) | 5 (4.0%) |
| Total | 14,355 (90.4%) | 1,516 (9.6%) |
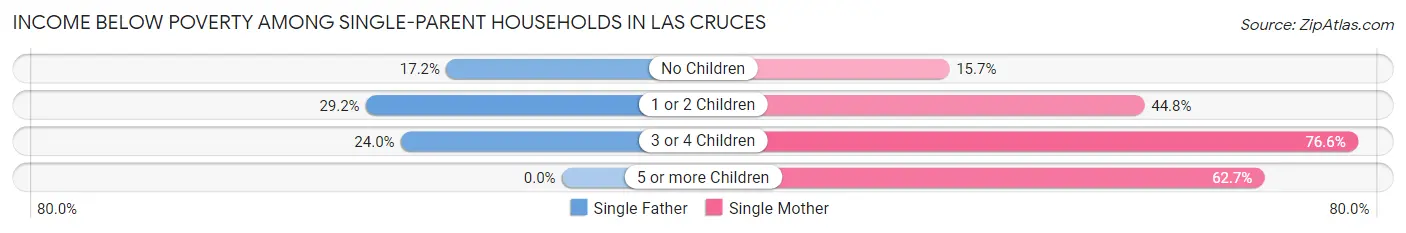
Income Below Poverty Among Single-Parent Households in Las Cruces
According to the poverty data in Las Cruces, 23.4% or 741 single-father households and 38.0% or 2,463 single-mother households are living below the poverty line. Among single-father households, those with 1 or 2 children have the highest poverty rate, with 425 households (29.2%) experiencing poverty. Likewise, among single-mother households, those with 3 or 4 children have the highest poverty rate, with 405 households (76.6%) falling below the poverty line.
| Children | Single Father | Single Mother |
| No Children | 244 (17.2%) | 345 (15.7%) |
| 1 or 2 Children | 425 (29.2%) | 1,614 (44.8%) |
| 3 or 4 Children | 72 (24.0%) | 405 (76.6%) |
| 5 or more Children | 0 (0.0%) | 99 (62.7%) |
| Total | 741 (23.4%) | 2,463 (38.0%) |
Income Below Poverty Among Married-Couple vs Single-Parent Households in Las Cruces
The poverty data for Las Cruces shows that 1,516 of the married-couple family households (9.6%) and 3,204 of the single-parent households (33.2%) are living below the poverty level. Within the married-couple family households, those with 3 or 4 children have the highest poverty rate, with 631 households (29.5%) falling below the poverty line. Among the single-parent households, those with 5 or more children have the highest poverty rate, with 99 household (62.7%) living below poverty.
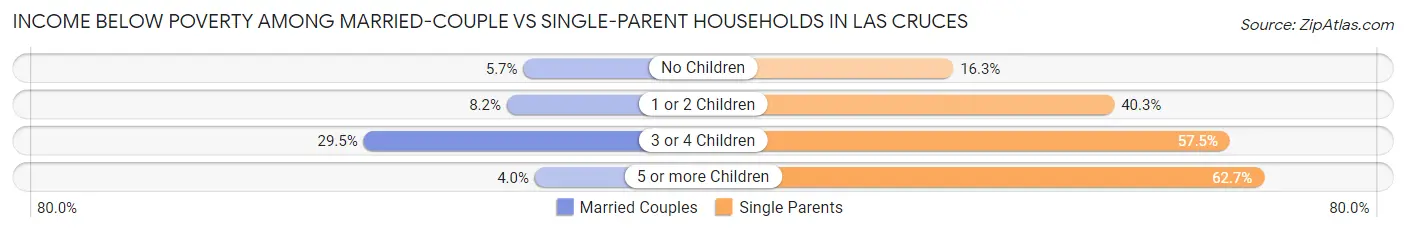
| Children | Married-Couple Families | Single-Parent Households |
| No Children | 526 (5.7%) | 589 (16.3%) |
| 1 or 2 Children | 354 (8.2%) | 2,039 (40.3%) |
| 3 or 4 Children | 631 (29.5%) | 477 (57.5%) |
| 5 or more Children | 5 (4.0%) | 99 (62.7%) |
| Total | 1,516 (9.6%) | 3,204 (33.2%) |
Employment Characteristics in Las Cruces
Employment by Class of Employer in Las Cruces
Among the 48,075 employed individuals in Las Cruces, private company employees (29,376 | 61.1%), state government employees (5,175 | 10.8%), and local government employees (3,630 | 7.5%) make up the most common classes of employment.
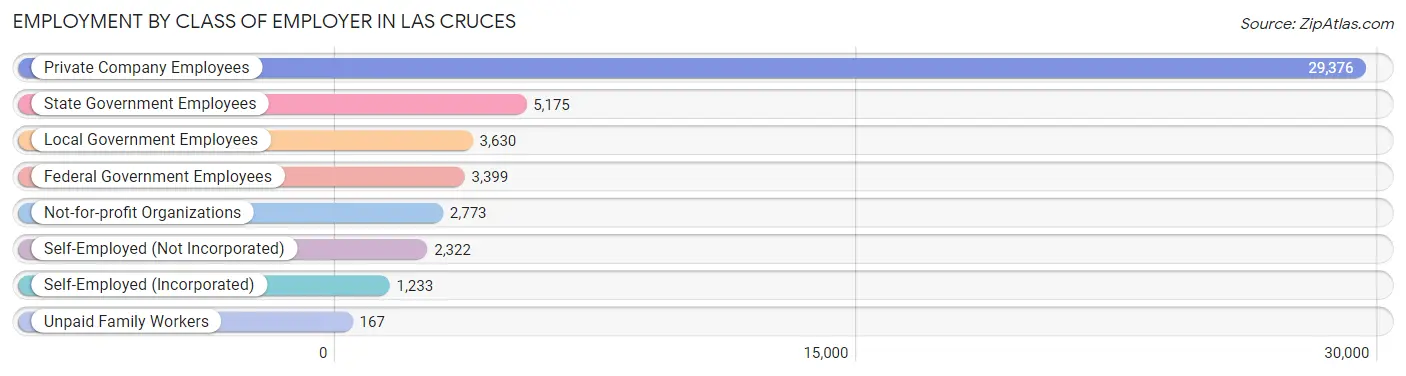
| Employer Class | # Employees | % Employees |
| Private Company Employees | 29,376 | 61.1% |
| Self-Employed (Incorporated) | 1,233 | 2.6% |
| Self-Employed (Not Incorporated) | 2,322 | 4.8% |
| Not-for-profit Organizations | 2,773 | 5.8% |
| Local Government Employees | 3,630 | 7.5% |
| State Government Employees | 5,175 | 10.8% |
| Federal Government Employees | 3,399 | 7.1% |
| Unpaid Family Workers | 167 | 0.4% |
| Total | 48,075 | 100.0% |
Employment Status by Age in Las Cruces
According to the labor force statistics for Las Cruces, out of the total population over 16 years of age (88,696), 59.5% or 52,774 individuals are in the labor force, with 7.5% or 3,958 of them unemployed. The age group with the highest labor force participation rate is 25 to 29 years, with 84.7% or 7,280 individuals in the labor force. Within the labor force, the 25 to 29 years age range has the highest percentage of unemployed individuals, with 12.5% or 910 of them being unemployed.
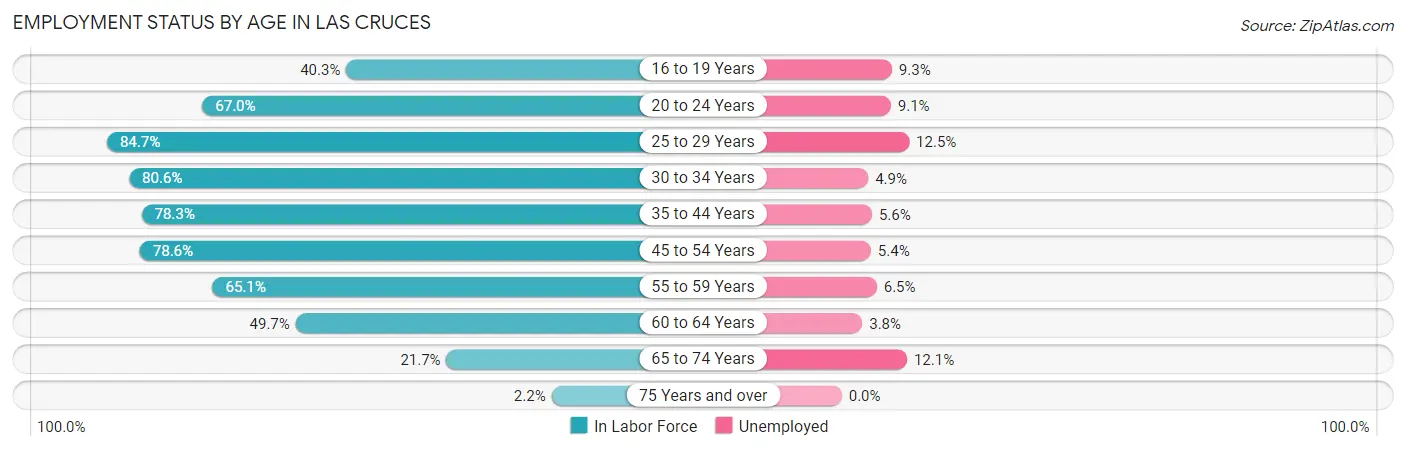
| Age Bracket | In Labor Force | Unemployed |
| 16 to 19 Years | 2,818 (40.3%) | 262 (9.3%) |
| 20 to 24 Years | 9,170 (67.0%) | 834 (9.1%) |
| 25 to 29 Years | 7,280 (84.7%) | 910 (12.5%) |
| 30 to 34 Years | 6,657 (80.6%) | 326 (4.9%) |
| 35 to 44 Years | 9,939 (78.3%) | 557 (5.6%) |
| 45 to 54 Years | 8,173 (78.6%) | 441 (5.4%) |
| 55 to 59 Years | 3,773 (65.1%) | 245 (6.5%) |
| 60 to 64 Years | 2,621 (49.7%) | 100 (3.8%) |
| 65 to 74 Years | 2,150 (21.7%) | 260 (12.1%) |
| 75 Years and over | 156 (2.2%) | 0 (0.0%) |
| Total | 52,774 (59.5%) | 3,958 (7.5%) |
Employment Status by Educational Attainment in Las Cruces
According to labor force statistics for Las Cruces, 75.3% of individuals (38,415) out of the total population between 25 and 64 years of age (51,016) are in the labor force, with 6.7% or 2,574 of them being unemployed. The group with the highest labor force participation rate are those with the educational attainment of bachelor's degree or higher, with 85.2% or 15,700 individuals in the labor force. Within the labor force, individuals with less than high school education have the highest percentage of unemployment, with 13.6% or 446 of them being unemployed.
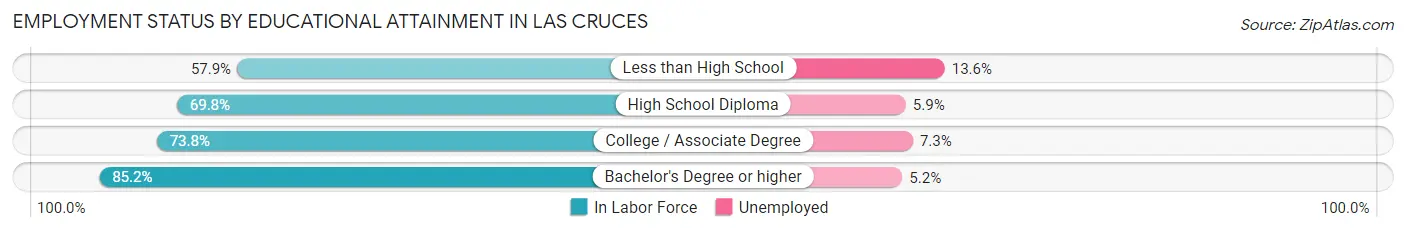
| Educational Attainment | In Labor Force | Unemployed |
| Less than High School | 3,280 (57.9%) | 770 (13.6%) |
| High School Diploma | 7,245 (69.8%) | 612 (5.9%) |
| College / Associate Degree | 12,209 (73.8%) | 1,208 (7.3%) |
| Bachelor's Degree or higher | 15,700 (85.2%) | 958 (5.2%) |
| Total | 38,415 (75.3%) | 3,418 (6.7%) |
Employment Occupations by Sex in Las Cruces
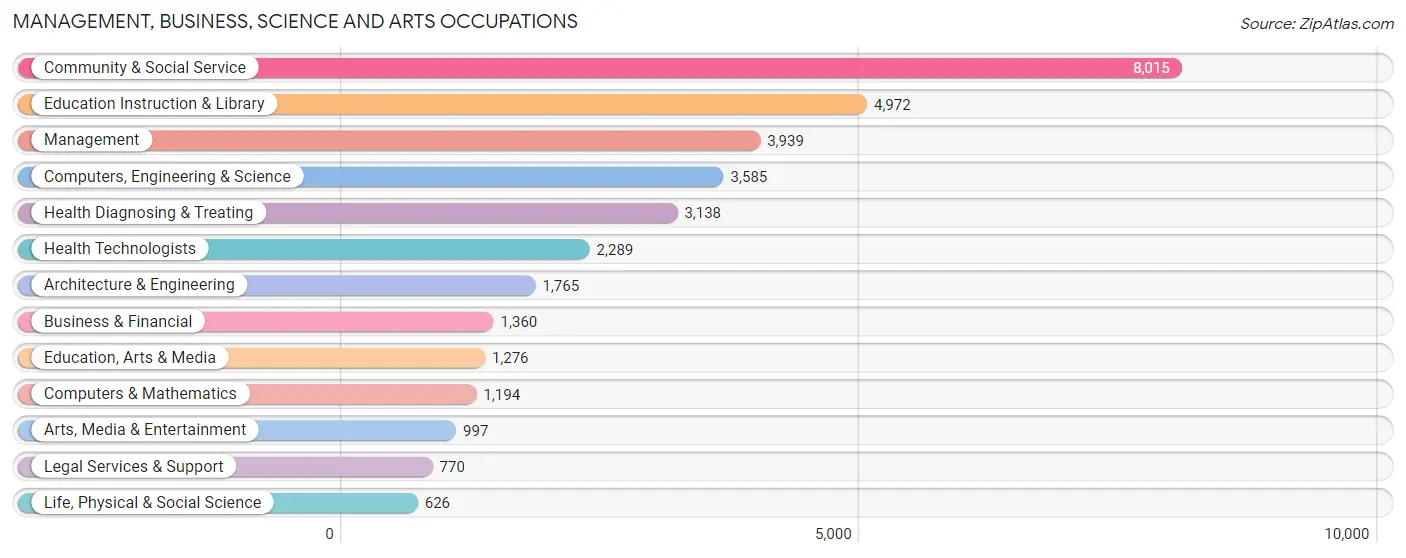
Management, Business, Science and Arts Occupations
The most common Management, Business, Science and Arts occupations in Las Cruces are Community & Social Service (8,015 | 16.5%), Education Instruction & Library (4,972 | 10.2%), Management (3,939 | 8.1%), Computers, Engineering & Science (3,585 | 7.4%), and Health Diagnosing & Treating (3,138 | 6.5%).
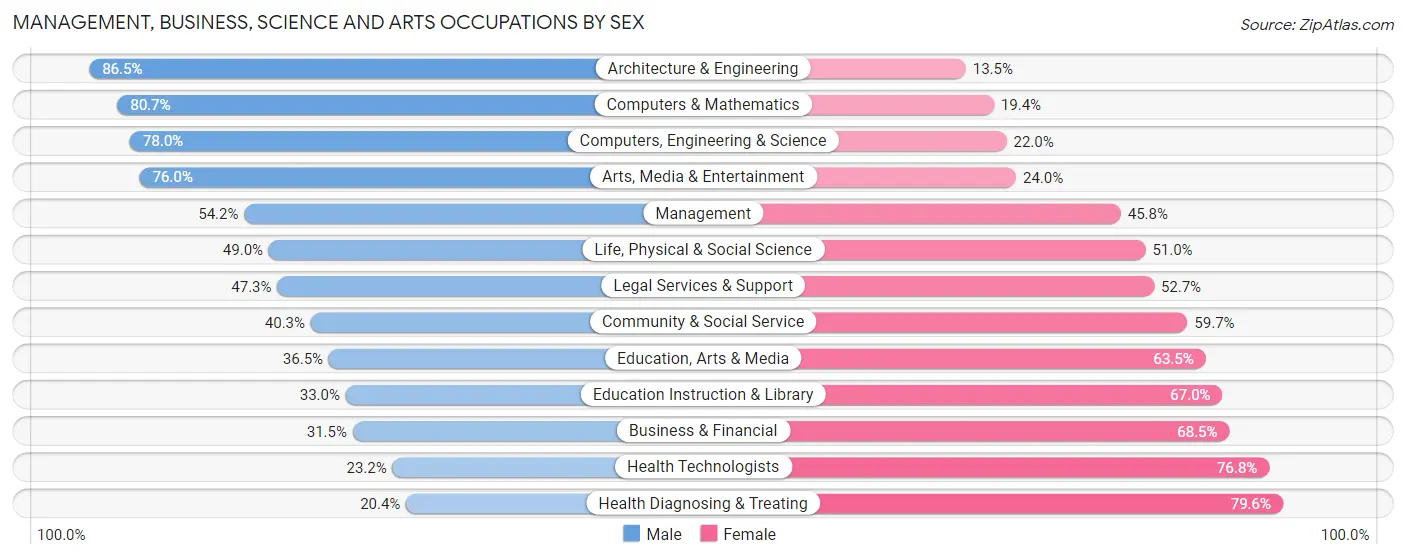
Management, Business, Science and Arts Occupations by Sex
Within the Management, Business, Science and Arts occupations in Las Cruces, the most male-oriented occupations are Architecture & Engineering (86.5%), Computers & Mathematics (80.6%), and Computers, Engineering & Science (78.0%), while the most female-oriented occupations are Health Diagnosing & Treating (79.6%), Health Technologists (76.8%), and Business & Financial (68.5%).
| Occupation | Male | Female |
| Management | 2,134 (54.2%) | 1,805 (45.8%) |
| Business & Financial | 429 (31.5%) | 931 (68.5%) |
| Computers, Engineering & Science | 2,797 (78.0%) | 788 (22.0%) |
| Computers & Mathematics | 963 (80.6%) | 231 (19.4%) |
| Architecture & Engineering | 1,527 (86.5%) | 238 (13.5%) |
| Life, Physical & Social Science | 307 (49.0%) | 319 (51.0%) |
| Community & Social Service | 3,229 (40.3%) | 4,786 (59.7%) |
| Education, Arts & Media | 466 (36.5%) | 810 (63.5%) |
| Legal Services & Support | 364 (47.3%) | 406 (52.7%) |
| Education Instruction & Library | 1,641 (33.0%) | 3,331 (67.0%) |
| Arts, Media & Entertainment | 758 (76.0%) | 239 (24.0%) |
| Health Diagnosing & Treating | 640 (20.4%) | 2,498 (79.6%) |
| Health Technologists | 532 (23.2%) | 1,757 (76.8%) |
| Total (Category) | 9,229 (46.1%) | 10,808 (53.9%) |
| Total (Overall) | 25,332 (52.2%) | 23,226 (47.8%) |
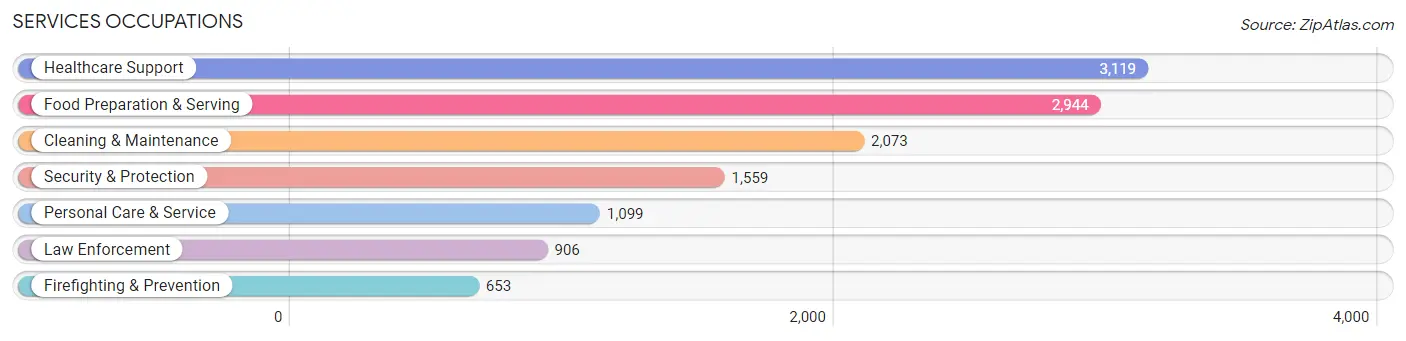
Services Occupations
The most common Services occupations in Las Cruces are Healthcare Support (3,119 | 6.4%), Food Preparation & Serving (2,944 | 6.1%), Cleaning & Maintenance (2,073 | 4.3%), Security & Protection (1,559 | 3.2%), and Personal Care & Service (1,099 | 2.3%).
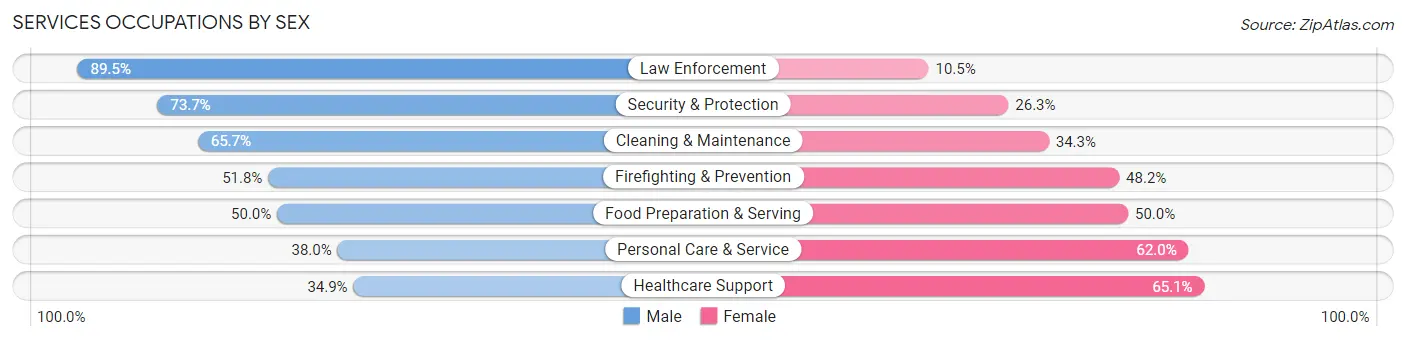
Services Occupations by Sex
Within the Services occupations in Las Cruces, the most male-oriented occupations are Law Enforcement (89.5%), Security & Protection (73.7%), and Cleaning & Maintenance (65.7%), while the most female-oriented occupations are Healthcare Support (65.1%), Personal Care & Service (62.0%), and Food Preparation & Serving (50.0%).
| Occupation | Male | Female |
| Healthcare Support | 1,088 (34.9%) | 2,031 (65.1%) |
| Security & Protection | 1,149 (73.7%) | 410 (26.3%) |
| Firefighting & Prevention | 338 (51.8%) | 315 (48.2%) |
| Law Enforcement | 811 (89.5%) | 95 (10.5%) |
| Food Preparation & Serving | 1,472 (50.0%) | 1,472 (50.0%) |
| Cleaning & Maintenance | 1,362 (65.7%) | 711 (34.3%) |
| Personal Care & Service | 418 (38.0%) | 681 (62.0%) |
| Total (Category) | 5,489 (50.8%) | 5,305 (49.1%) |
| Total (Overall) | 25,332 (52.2%) | 23,226 (47.8%) |
Sales and Office Occupations
The most common Sales and Office occupations in Las Cruces are Office & Administration (5,545 | 11.4%), and Sales & Related (4,279 | 8.8%).

Sales and Office Occupations by Sex
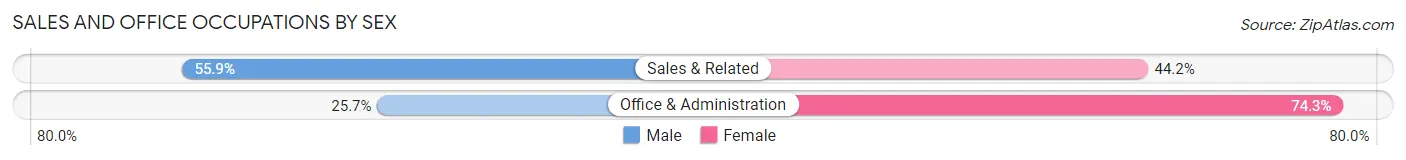
| Occupation | Male | Female |
| Sales & Related | 2,390 (55.8%) | 1,889 (44.2%) |
| Office & Administration | 1,427 (25.7%) | 4,118 (74.3%) |
| Total (Category) | 3,817 (38.9%) | 6,007 (61.2%) |
| Total (Overall) | 25,332 (52.2%) | 23,226 (47.8%) |
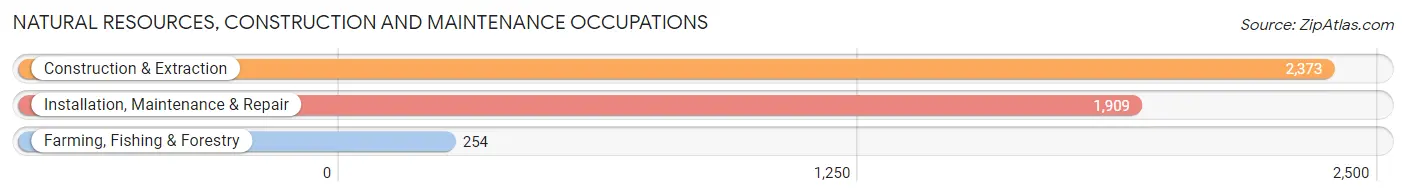
Natural Resources, Construction and Maintenance Occupations
The most common Natural Resources, Construction and Maintenance occupations in Las Cruces are Construction & Extraction (2,373 | 4.9%), Installation, Maintenance & Repair (1,909 | 3.9%), and Farming, Fishing & Forestry (254 | 0.5%).
Natural Resources, Construction and Maintenance Occupations by Sex
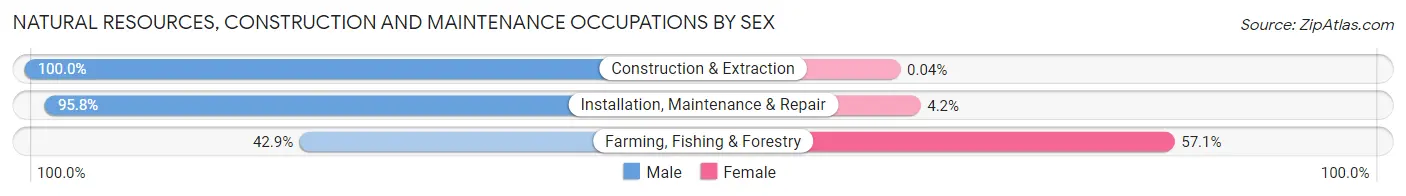
| Occupation | Male | Female |
| Farming, Fishing & Forestry | 109 (42.9%) | 145 (57.1%) |
| Construction & Extraction | 2,372 (100.0%) | 1 (0.0%) |
| Installation, Maintenance & Repair | 1,828 (95.8%) | 81 (4.2%) |
| Total (Category) | 4,309 (95.0%) | 227 (5.0%) |
| Total (Overall) | 25,332 (52.2%) | 23,226 (47.8%) |
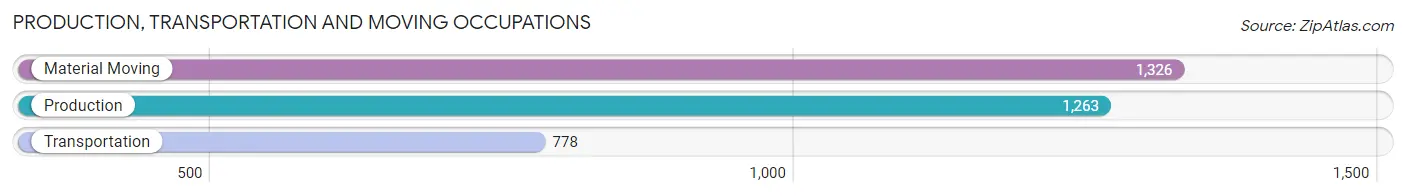
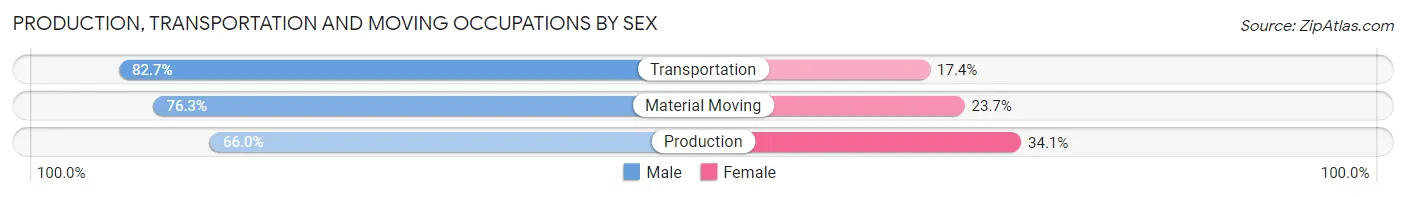
Production, Transportation and Moving Occupations
The most common Production, Transportation and Moving occupations in Las Cruces are Material Moving (1,326 | 2.7%), Production (1,263 | 2.6%), and Transportation (778 | 1.6%).
Production, Transportation and Moving Occupations by Sex
| Occupation | Male | Female |
| Production | 833 (65.9%) | 430 (34.1%) |
| Transportation | 643 (82.7%) | 135 (17.3%) |
| Material Moving | 1,012 (76.3%) | 314 (23.7%) |
| Total (Category) | 2,488 (73.9%) | 879 (26.1%) |
| Total (Overall) | 25,332 (52.2%) | 23,226 (47.8%) |
Employment Industries by Sex in Las Cruces
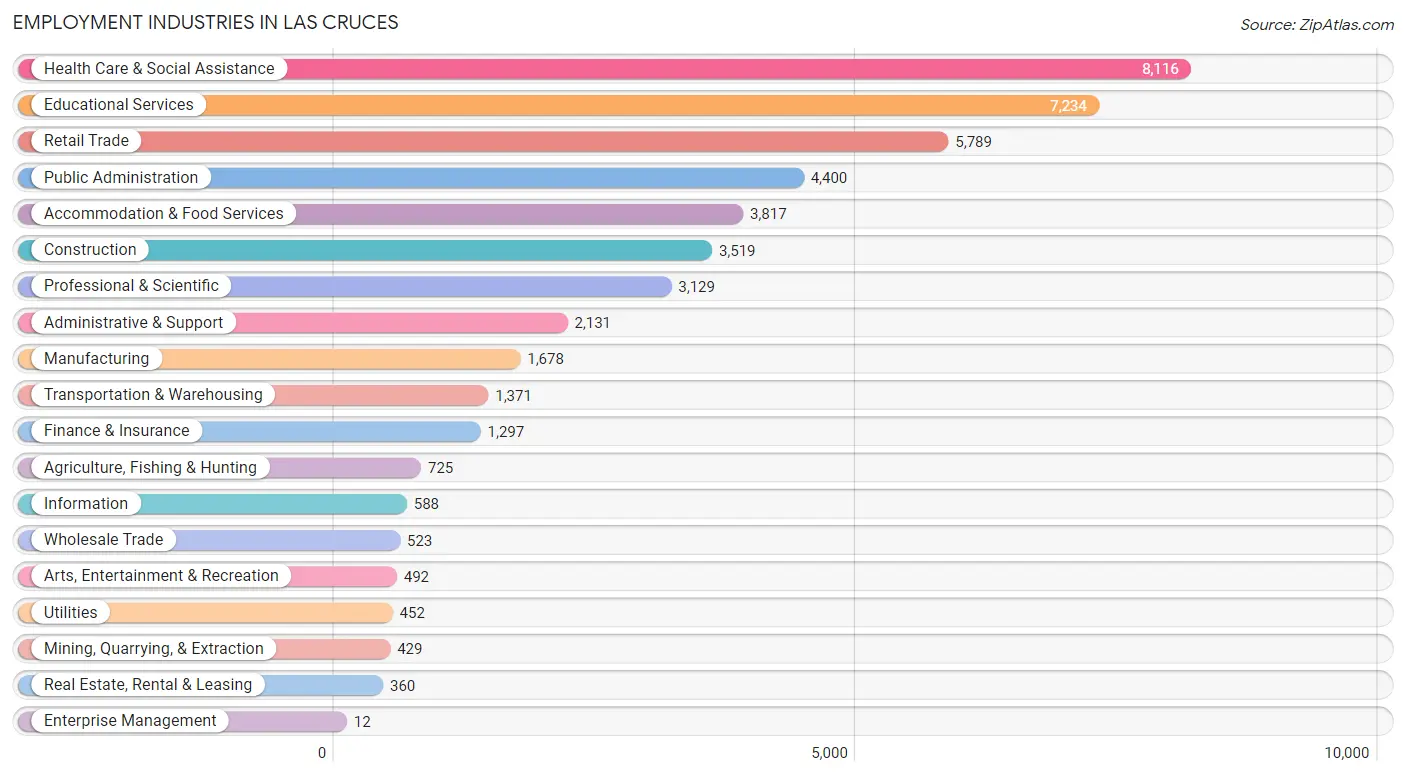
Employment Industries in Las Cruces
The major employment industries in Las Cruces include Health Care & Social Assistance (8,116 | 16.7%), Educational Services (7,234 | 14.9%), Retail Trade (5,789 | 11.9%), Public Administration (4,400 | 9.1%), and Accommodation & Food Services (3,817 | 7.9%).
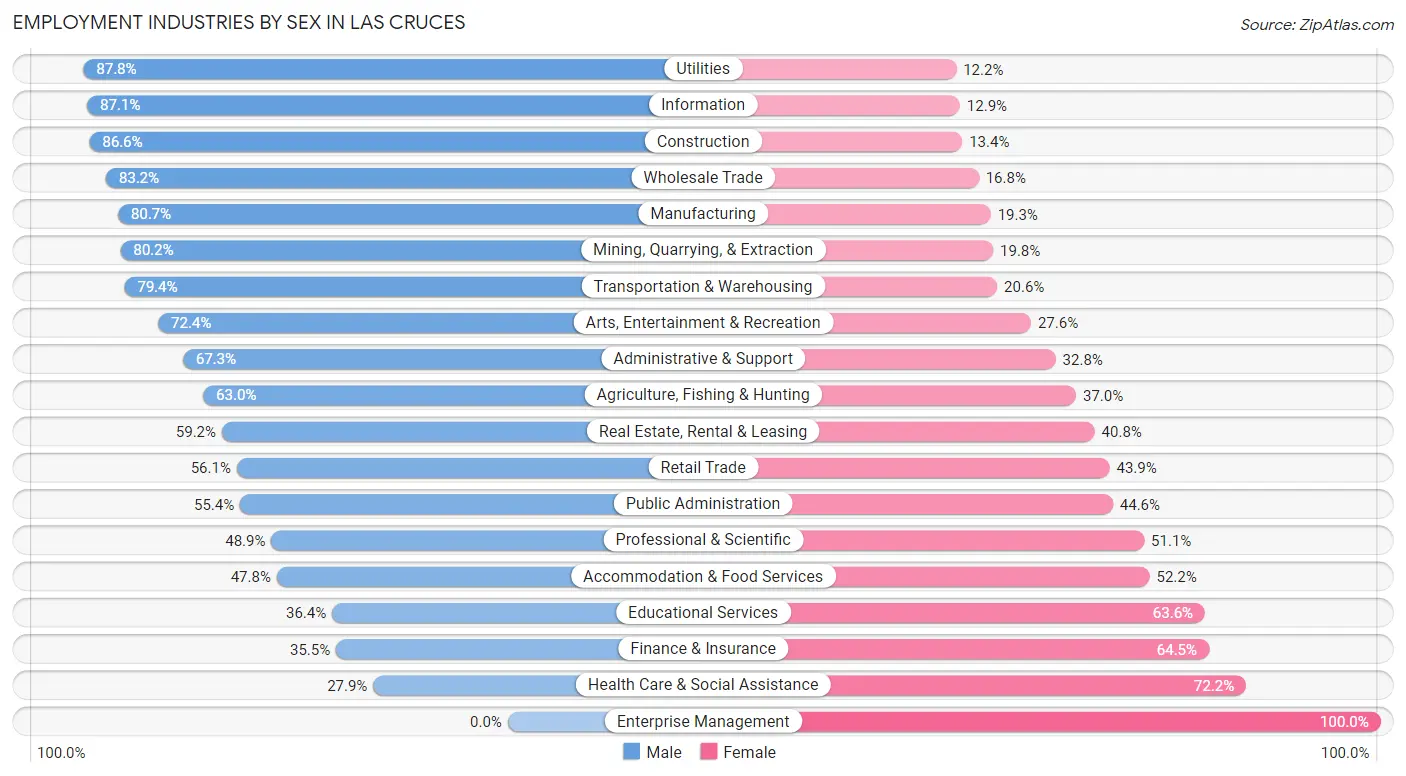
Employment Industries by Sex in Las Cruces
The Las Cruces industries that see more men than women are Utilities (87.8%), Information (87.1%), and Construction (86.6%), whereas the industries that tend to have a higher number of women are Enterprise Management (100.0%), Health Care & Social Assistance (72.2%), and Finance & Insurance (64.5%).
| Industry | Male | Female |
| Agriculture, Fishing & Hunting | 457 (63.0%) | 268 (37.0%) |
| Mining, Quarrying, & Extraction | 344 (80.2%) | 85 (19.8%) |
| Construction | 3,047 (86.6%) | 472 (13.4%) |
| Manufacturing | 1,354 (80.7%) | 324 (19.3%) |
| Wholesale Trade | 435 (83.2%) | 88 (16.8%) |
| Retail Trade | 3,247 (56.1%) | 2,542 (43.9%) |
| Transportation & Warehousing | 1,088 (79.4%) | 283 (20.6%) |
| Utilities | 397 (87.8%) | 55 (12.2%) |
| Information | 512 (87.1%) | 76 (12.9%) |
| Finance & Insurance | 461 (35.5%) | 836 (64.5%) |
| Real Estate, Rental & Leasing | 213 (59.2%) | 147 (40.8%) |
| Professional & Scientific | 1,531 (48.9%) | 1,598 (51.1%) |
| Enterprise Management | 0 (0.0%) | 12 (100.0%) |
| Administrative & Support | 1,433 (67.2%) | 698 (32.8%) |
| Educational Services | 2,630 (36.4%) | 4,604 (63.6%) |
| Health Care & Social Assistance | 2,260 (27.9%) | 5,856 (72.2%) |
| Arts, Entertainment & Recreation | 356 (72.4%) | 136 (27.6%) |
| Accommodation & Food Services | 1,825 (47.8%) | 1,992 (52.2%) |
| Public Administration | 2,438 (55.4%) | 1,962 (44.6%) |
| Total | 25,332 (52.2%) | 23,226 (47.8%) |
Education in Las Cruces
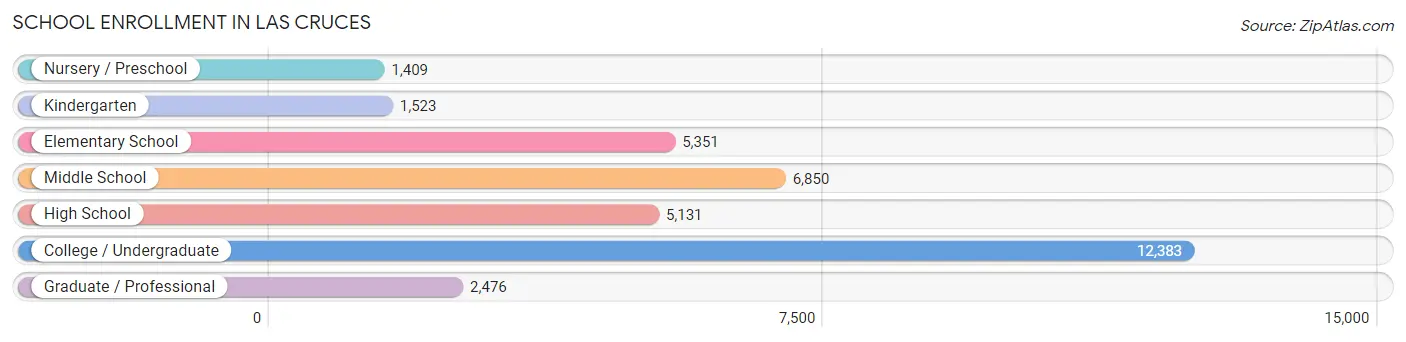
School Enrollment in Las Cruces
The most common levels of schooling among the 35,123 students in Las Cruces are college / undergraduate (12,383 | 35.3%), middle school (6,850 | 19.5%), and elementary school (5,351 | 15.2%).
| School Level | # Students | % Students |
| Nursery / Preschool | 1,409 | 4.0% |
| Kindergarten | 1,523 | 4.3% |
| Elementary School | 5,351 | 15.2% |
| Middle School | 6,850 | 19.5% |
| High School | 5,131 | 14.6% |
| College / Undergraduate | 12,383 | 35.3% |
| Graduate / Professional | 2,476 | 7.0% |
| Total | 35,123 | 100.0% |
School Enrollment by Age by Funding Source in Las Cruces
Out of a total of 35,123 students who are enrolled in schools in Las Cruces, 2,599 (7.4%) attend a private institution, while the remaining 32,524 (92.6%) are enrolled in public schools. The age group of 3 to 4 year olds has the highest likelihood of being enrolled in private schools, with 245 (21.0% in the age bracket) enrolled. Conversely, the age group of 10 to 14 year olds has the lowest likelihood of being enrolled in a private school, with 7,782 (97.0% in the age bracket) attending a public institution.
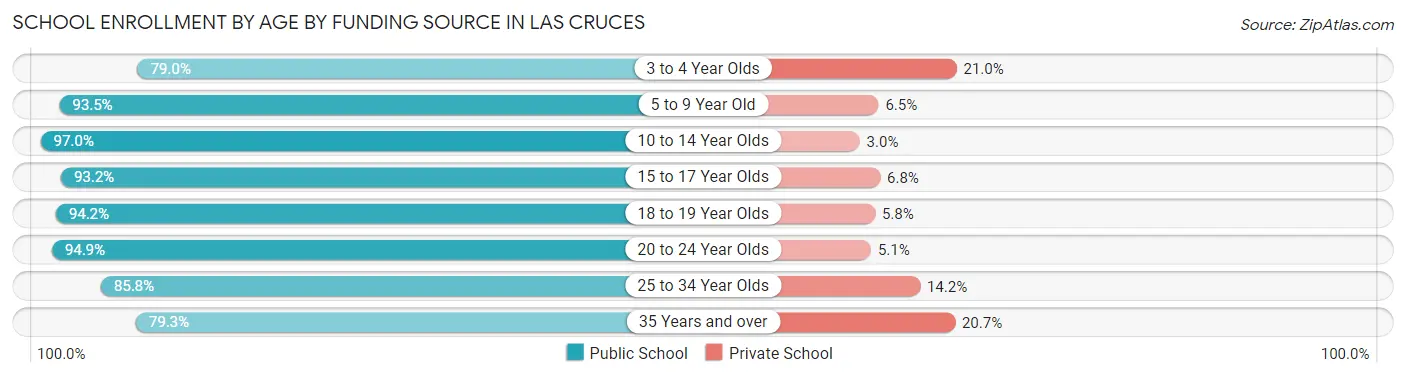
| Age Bracket | Public School | Private School |
| 3 to 4 Year Olds | 920 (79.0%) | 245 (21.0%) |
| 5 to 9 Year Old | 6,054 (93.5%) | 420 (6.5%) |
| 10 to 14 Year Olds | 7,782 (97.0%) | 239 (3.0%) |
| 15 to 17 Year Olds | 3,627 (93.2%) | 264 (6.8%) |
| 18 to 19 Year Olds | 2,663 (94.2%) | 165 (5.8%) |
| 20 to 24 Year Olds | 7,031 (94.9%) | 376 (5.1%) |
| 25 to 34 Year Olds | 2,741 (85.8%) | 454 (14.2%) |
| 35 Years and over | 1,698 (79.3%) | 444 (20.7%) |
| Total | 32,524 (92.6%) | 2,599 (7.4%) |
Educational Attainment by Field of Study in Las Cruces
Education (4,362 | 16.4%), business (3,723 | 14.0%), science & technology (2,551 | 9.6%), arts & humanities (2,318 | 8.7%), and engineering (2,252 | 8.5%) are the most common fields of study among 26,556 individuals in Las Cruces who have obtained a bachelor's degree or higher.
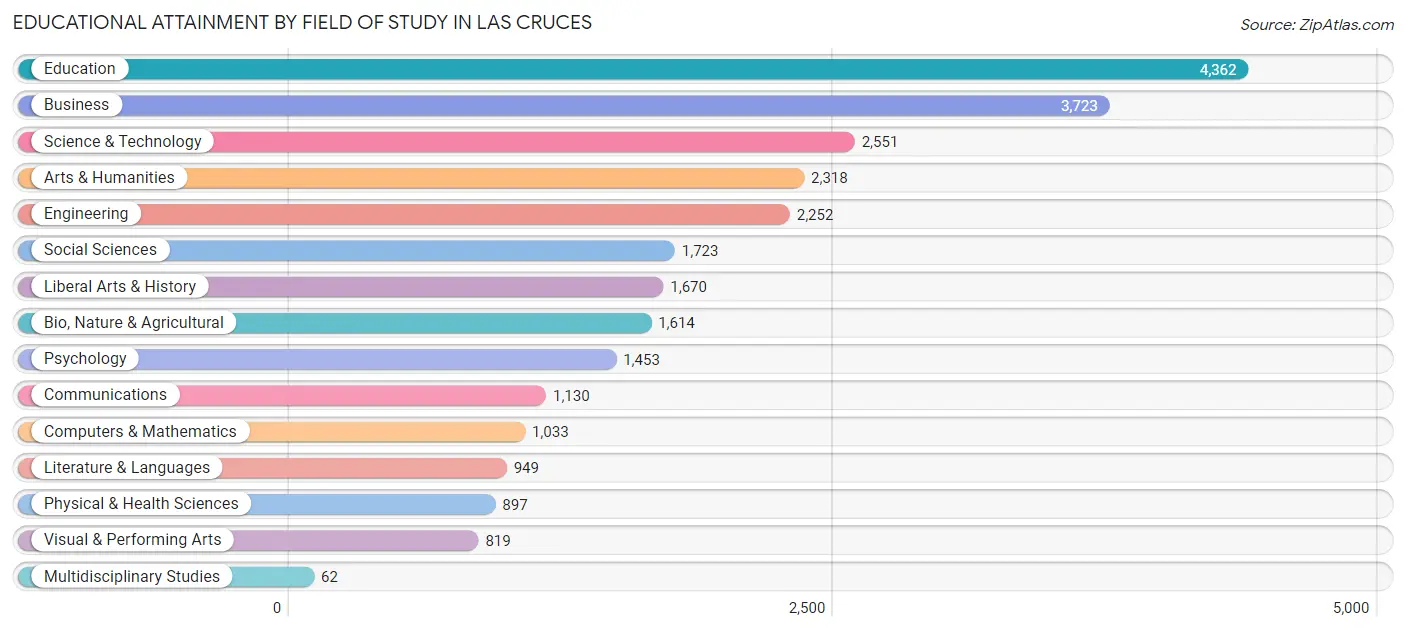
| Field of Study | # Graduates | % Graduates |
| Computers & Mathematics | 1,033 | 3.9% |
| Bio, Nature & Agricultural | 1,614 | 6.1% |
| Physical & Health Sciences | 897 | 3.4% |
| Psychology | 1,453 | 5.5% |
| Social Sciences | 1,723 | 6.5% |
| Engineering | 2,252 | 8.5% |
| Multidisciplinary Studies | 62 | 0.2% |
| Science & Technology | 2,551 | 9.6% |
| Business | 3,723 | 14.0% |
| Education | 4,362 | 16.4% |
| Literature & Languages | 949 | 3.6% |
| Liberal Arts & History | 1,670 | 6.3% |
| Visual & Performing Arts | 819 | 3.1% |
| Communications | 1,130 | 4.3% |
| Arts & Humanities | 2,318 | 8.7% |
| Total | 26,556 | 100.0% |
Transportation & Commute in Las Cruces
Vehicle Availability by Sex in Las Cruces
The most prevalent vehicle ownership categories in Las Cruces are males with 2 vehicles (10,528, accounting for 41.9%) and females with 2 vehicles (8,292, making up 46.0%).
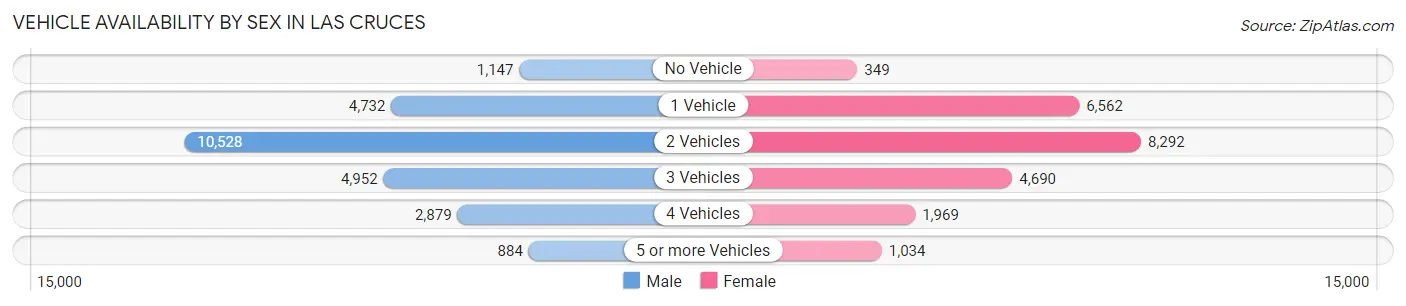
| Vehicles Available | Male | Female |
| No Vehicle | 1,147 (4.6%) | 349 (1.5%) |
| 1 Vehicle | 4,732 (18.8%) | 6,562 (28.7%) |
| 2 Vehicles | 10,528 (41.9%) | 8,292 (36.2%) |
| 3 Vehicles | 4,952 (19.7%) | 4,690 (20.5%) |
| 4 Vehicles | 2,879 (11.5%) | 1,969 (8.6%) |
| 5 or more Vehicles | 884 (3.5%) | 1,034 (4.5%) |
| Total | 25,122 (100.0%) | 22,896 (100.0%) |
Commute Time in Las Cruces
The most frequently occuring commute durations in Las Cruces are 15 to 19 minutes (11,917 commuters, 26.9%), 10 to 14 minutes (10,013 commuters, 22.6%), and 5 to 9 minutes (6,175 commuters, 13.9%).
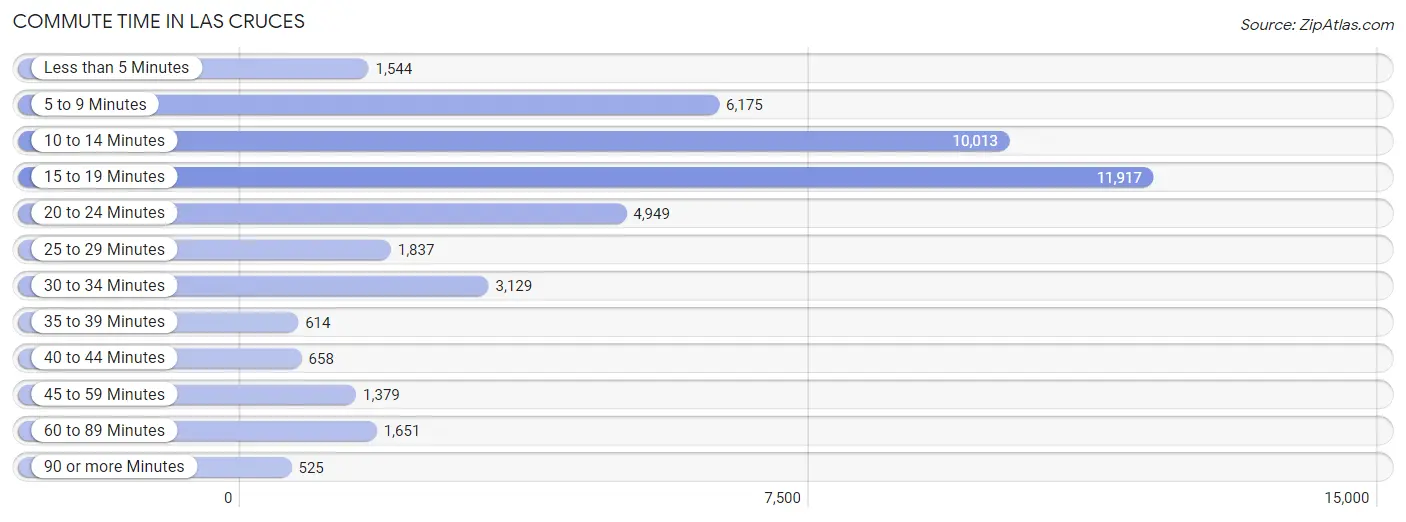
| Commute Time | # Commuters | % Commuters |
| Less than 5 Minutes | 1,544 | 3.5% |
| 5 to 9 Minutes | 6,175 | 13.9% |
| 10 to 14 Minutes | 10,013 | 22.6% |
| 15 to 19 Minutes | 11,917 | 26.9% |
| 20 to 24 Minutes | 4,949 | 11.2% |
| 25 to 29 Minutes | 1,837 | 4.1% |
| 30 to 34 Minutes | 3,129 | 7.0% |
| 35 to 39 Minutes | 614 | 1.4% |
| 40 to 44 Minutes | 658 | 1.5% |
| 45 to 59 Minutes | 1,379 | 3.1% |
| 60 to 89 Minutes | 1,651 | 3.7% |
| 90 or more Minutes | 525 | 1.2% |
Commute Time by Sex in Las Cruces
The most common commute times in Las Cruces are 15 to 19 minutes (6,767 commuters, 28.8%) for males and 15 to 19 minutes (5,150 commuters, 24.6%) for females.
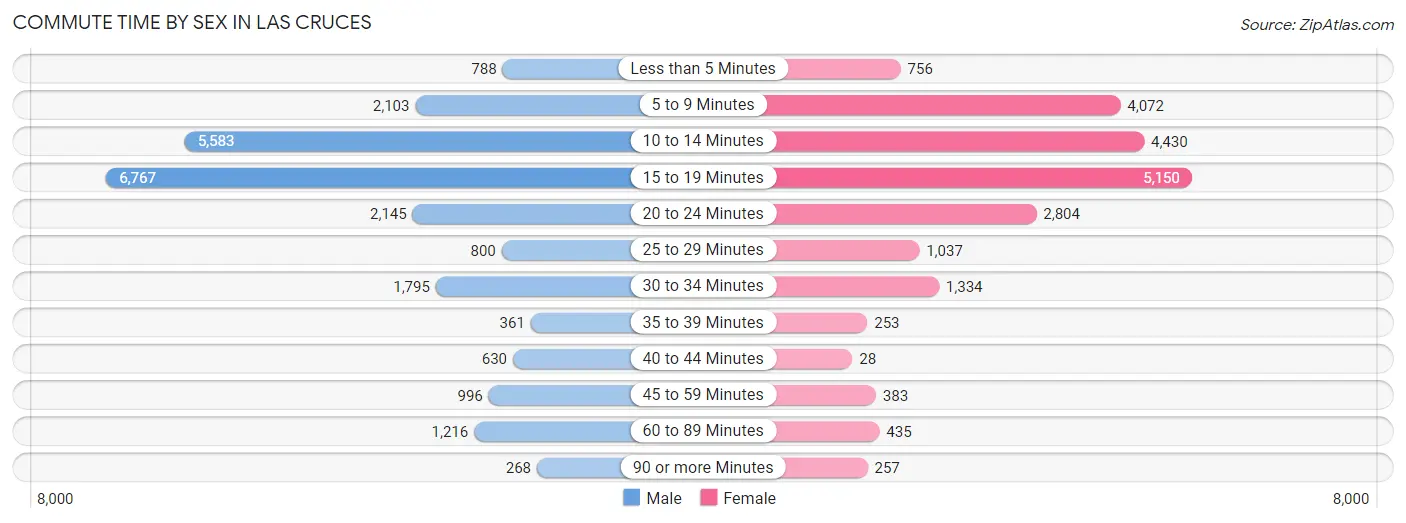
| Commute Time | Male | Female |
| Less than 5 Minutes | 788 (3.4%) | 756 (3.6%) |
| 5 to 9 Minutes | 2,103 (9.0%) | 4,072 (19.5%) |
| 10 to 14 Minutes | 5,583 (23.8%) | 4,430 (21.2%) |
| 15 to 19 Minutes | 6,767 (28.8%) | 5,150 (24.6%) |
| 20 to 24 Minutes | 2,145 (9.1%) | 2,804 (13.4%) |
| 25 to 29 Minutes | 800 (3.4%) | 1,037 (5.0%) |
| 30 to 34 Minutes | 1,795 (7.6%) | 1,334 (6.4%) |
| 35 to 39 Minutes | 361 (1.5%) | 253 (1.2%) |
| 40 to 44 Minutes | 630 (2.7%) | 28 (0.1%) |
| 45 to 59 Minutes | 996 (4.3%) | 383 (1.8%) |
| 60 to 89 Minutes | 1,216 (5.2%) | 435 (2.1%) |
| 90 or more Minutes | 268 (1.1%) | 257 (1.2%) |
Time of Departure to Work by Sex in Las Cruces
The most frequent times of departure to work in Las Cruces are 7:30 AM to 7:59 AM (3,304, 14.1%) for males and 7:30 AM to 7:59 AM (4,541, 21.7%) for females.
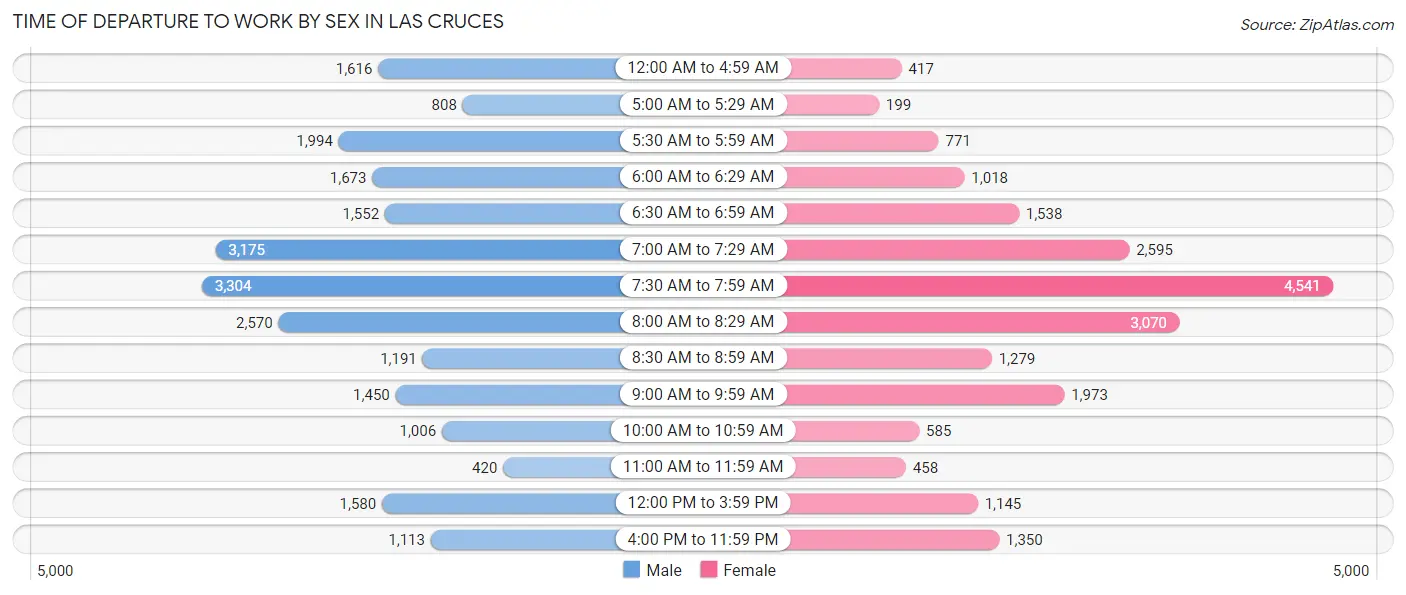
| Time of Departure | Male | Female |
| 12:00 AM to 4:59 AM | 1,616 (6.9%) | 417 (2.0%) |
| 5:00 AM to 5:29 AM | 808 (3.5%) | 199 (0.9%) |
| 5:30 AM to 5:59 AM | 1,994 (8.5%) | 771 (3.7%) |
| 6:00 AM to 6:29 AM | 1,673 (7.1%) | 1,018 (4.9%) |
| 6:30 AM to 6:59 AM | 1,552 (6.6%) | 1,538 (7.3%) |
| 7:00 AM to 7:29 AM | 3,175 (13.5%) | 2,595 (12.4%) |
| 7:30 AM to 7:59 AM | 3,304 (14.1%) | 4,541 (21.7%) |
| 8:00 AM to 8:29 AM | 2,570 (11.0%) | 3,070 (14.7%) |
| 8:30 AM to 8:59 AM | 1,191 (5.1%) | 1,279 (6.1%) |
| 9:00 AM to 9:59 AM | 1,450 (6.2%) | 1,973 (9.4%) |
| 10:00 AM to 10:59 AM | 1,006 (4.3%) | 585 (2.8%) |
| 11:00 AM to 11:59 AM | 420 (1.8%) | 458 (2.2%) |
| 12:00 PM to 3:59 PM | 1,580 (6.7%) | 1,145 (5.5%) |
| 4:00 PM to 11:59 PM | 1,113 (4.8%) | 1,350 (6.5%) |
| Total | 23,452 (100.0%) | 20,939 (100.0%) |
Housing Occupancy in Las Cruces
Occupancy by Ownership in Las Cruces
Of the total 45,297 dwellings in Las Cruces, owner-occupied units account for 24,391 (53.8%), while renter-occupied units make up 20,906 (46.2%).
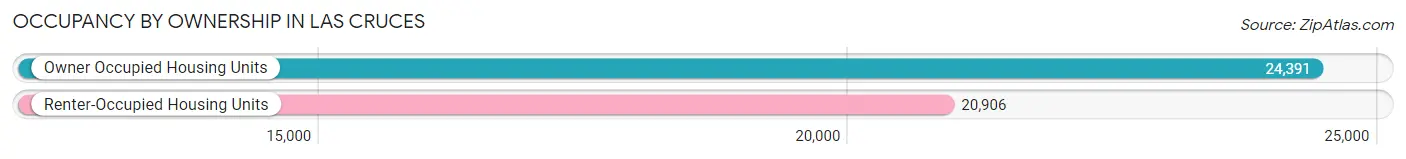
| Occupancy | # Housing Units | % Housing Units |
| Owner Occupied Housing Units | 24,391 | 53.8% |
| Renter-Occupied Housing Units | 20,906 | 46.2% |
| Total Occupied Housing Units | 45,297 | 100.0% |
Occupancy by Household Size in Las Cruces
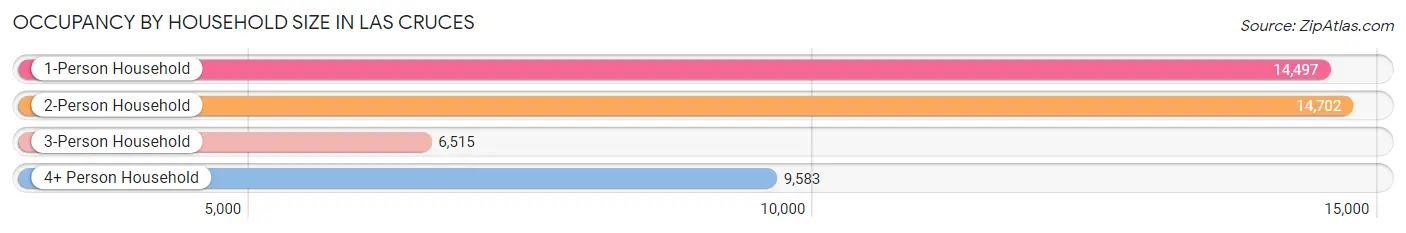
| Household Size | # Housing Units | % Housing Units |
| 1-Person Household | 14,497 | 32.0% |
| 2-Person Household | 14,702 | 32.5% |
| 3-Person Household | 6,515 | 14.4% |
| 4+ Person Household | 9,583 | 21.2% |
| Total Housing Units | 45,297 | 100.0% |
Occupancy by Ownership by Household Size in Las Cruces
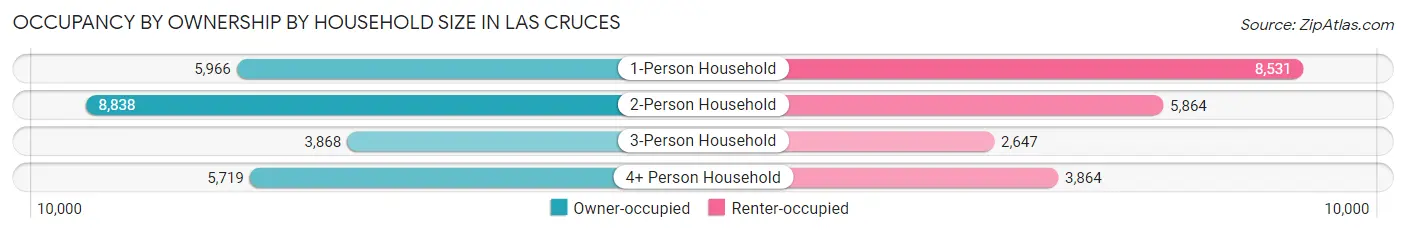
| Household Size | Owner-occupied | Renter-occupied |
| 1-Person Household | 5,966 (41.1%) | 8,531 (58.9%) |
| 2-Person Household | 8,838 (60.1%) | 5,864 (39.9%) |
| 3-Person Household | 3,868 (59.4%) | 2,647 (40.6%) |
| 4+ Person Household | 5,719 (59.7%) | 3,864 (40.3%) |
| Total Housing Units | 24,391 (53.8%) | 20,906 (46.2%) |
Occupancy by Educational Attainment in Las Cruces
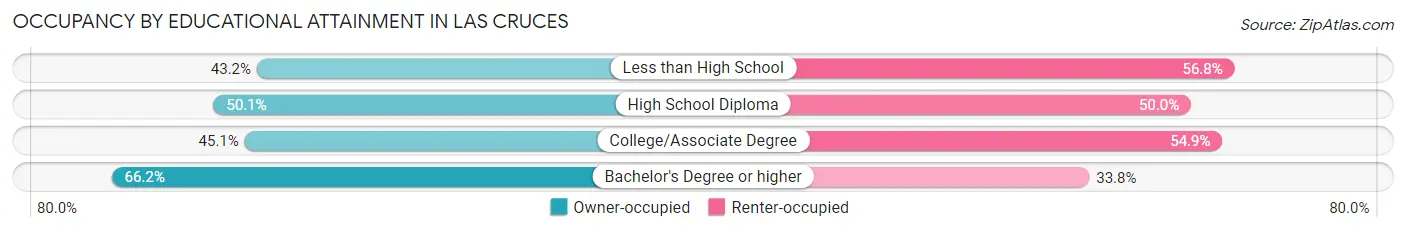
| Household Size | Owner-occupied | Renter-occupied |
| Less than High School | 1,814 (43.2%) | 2,389 (56.8%) |
| High School Diploma | 3,984 (50.0%) | 3,976 (49.9%) |
| College/Associate Degree | 7,142 (45.1%) | 8,695 (54.9%) |
| Bachelor's Degree or higher | 11,451 (66.2%) | 5,846 (33.8%) |
Occupancy by Age of Householder in Las Cruces
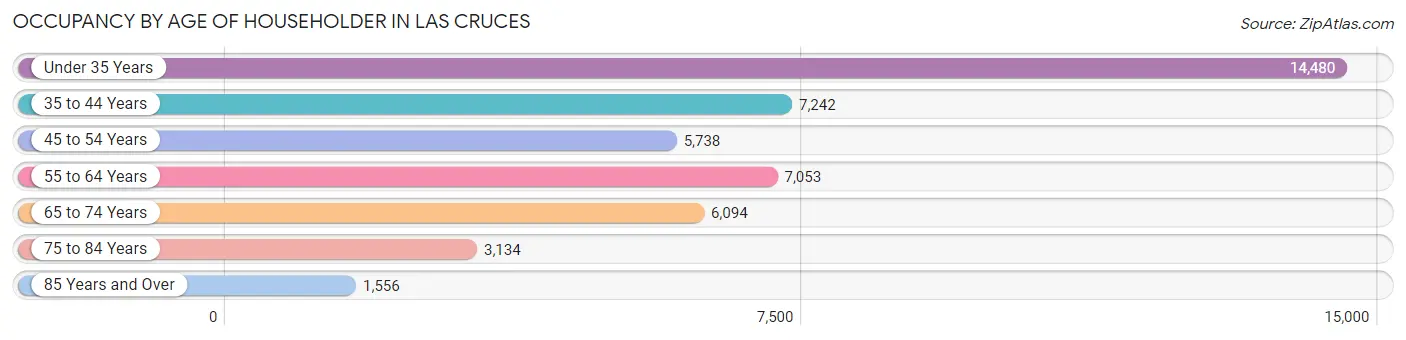
| Age Bracket | # Households | % Households |
| Under 35 Years | 14,480 | 32.0% |
| 35 to 44 Years | 7,242 | 16.0% |
| 45 to 54 Years | 5,738 | 12.7% |
| 55 to 64 Years | 7,053 | 15.6% |
| 65 to 74 Years | 6,094 | 13.5% |
| 75 to 84 Years | 3,134 | 6.9% |
| 85 Years and Over | 1,556 | 3.4% |
| Total | 45,297 | 100.0% |
Housing Finances in Las Cruces
Median Income by Occupancy in Las Cruces
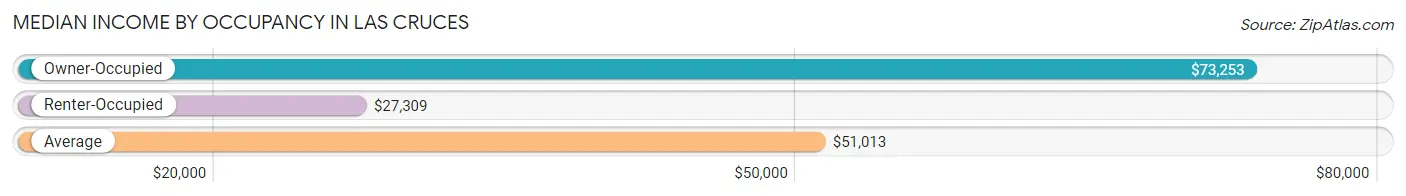
| Occupancy Type | # Households | Median Income |
| Owner-Occupied | 24,391 (53.8%) | $73,253 |
| Renter-Occupied | 20,906 (46.2%) | $27,309 |
| Average | 45,297 (100.0%) | $51,013 |
Occupancy by Householder Income Bracket in Las Cruces
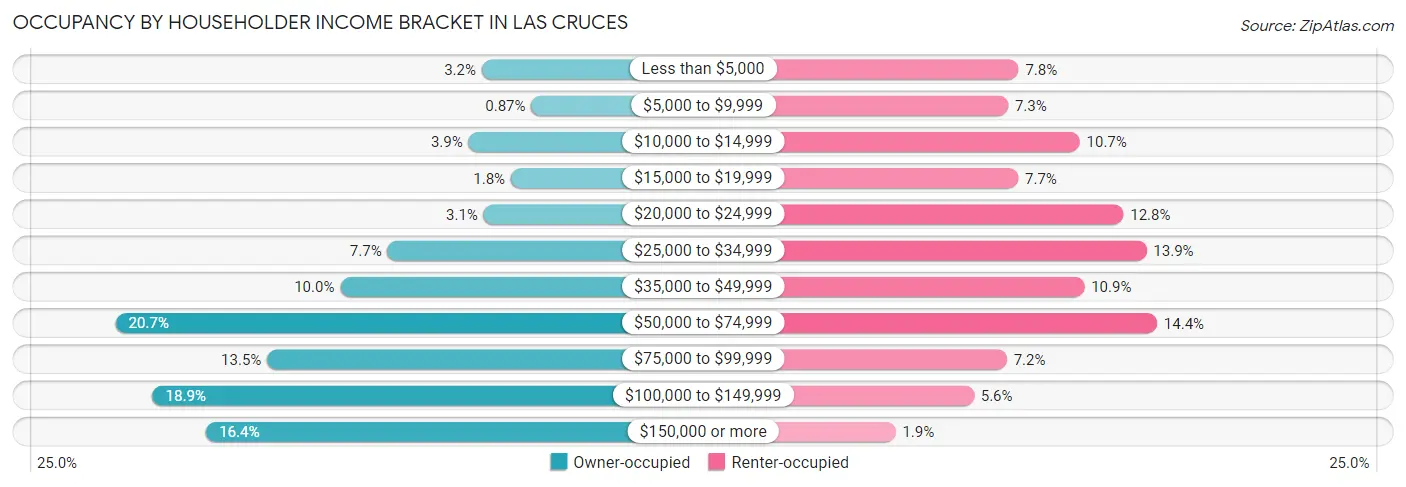
| Income Bracket | Owner-occupied | Renter-occupied |
| Less than $5,000 | 787 (3.2%) | 1,623 (7.8%) |
| $5,000 to $9,999 | 212 (0.9%) | 1,518 (7.3%) |
| $10,000 to $14,999 | 941 (3.9%) | 2,231 (10.7%) |
| $15,000 to $19,999 | 450 (1.8%) | 1,618 (7.7%) |
| $20,000 to $24,999 | 767 (3.1%) | 2,665 (12.8%) |
| $25,000 to $34,999 | 1,882 (7.7%) | 2,895 (13.9%) |
| $35,000 to $49,999 | 2,432 (10.0%) | 2,277 (10.9%) |
| $50,000 to $74,999 | 5,041 (20.7%) | 3,001 (14.3%) |
| $75,000 to $99,999 | 3,281 (13.5%) | 1,505 (7.2%) |
| $100,000 to $149,999 | 4,610 (18.9%) | 1,176 (5.6%) |
| $150,000 or more | 3,988 (16.4%) | 397 (1.9%) |
| Total | 24,391 (100.0%) | 20,906 (100.0%) |
Monthly Housing Cost Tiers in Las Cruces
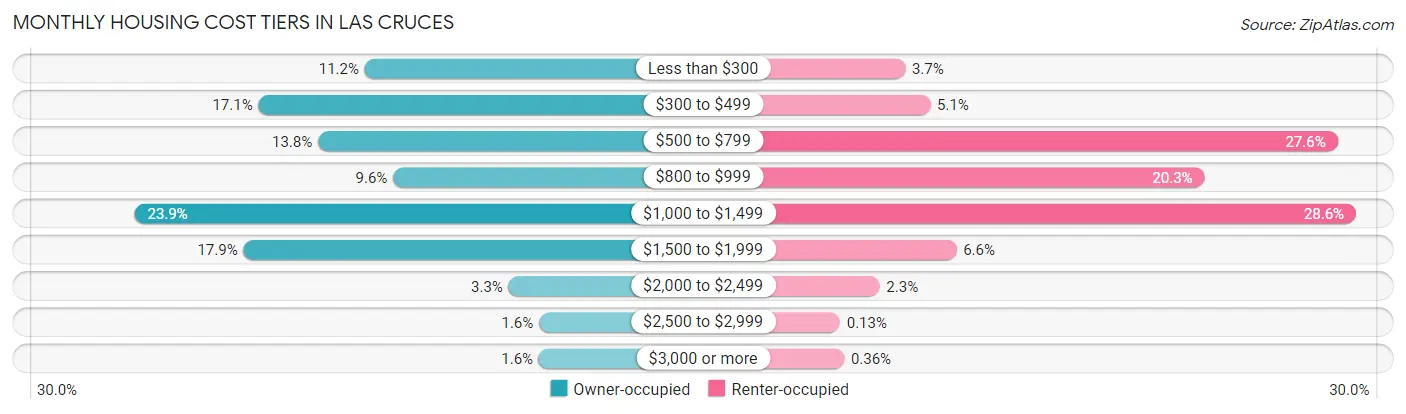
| Monthly Cost | Owner-occupied | Renter-occupied |
| Less than $300 | 2,734 (11.2%) | 780 (3.7%) |
| $300 to $499 | 4,166 (17.1%) | 1,071 (5.1%) |
| $500 to $799 | 3,364 (13.8%) | 5,775 (27.6%) |
| $800 to $999 | 2,352 (9.6%) | 4,237 (20.3%) |
| $1,000 to $1,499 | 5,837 (23.9%) | 5,988 (28.6%) |
| $1,500 to $1,999 | 4,369 (17.9%) | 1,371 (6.6%) |
| $2,000 to $2,499 | 796 (3.3%) | 484 (2.3%) |
| $2,500 to $2,999 | 386 (1.6%) | 28 (0.1%) |
| $3,000 or more | 387 (1.6%) | 75 (0.4%) |
| Total | 24,391 (100.0%) | 20,906 (100.0%) |
Physical Housing Characteristics in Las Cruces
Housing Structures in Las Cruces
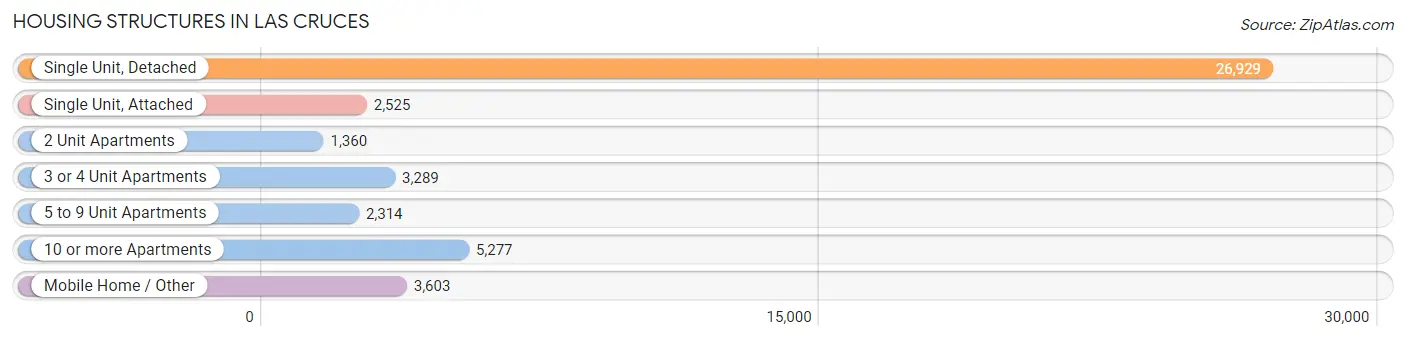
| Structure Type | # Housing Units | % Housing Units |
| Single Unit, Detached | 26,929 | 59.5% |
| Single Unit, Attached | 2,525 | 5.6% |
| 2 Unit Apartments | 1,360 | 3.0% |
| 3 or 4 Unit Apartments | 3,289 | 7.3% |
| 5 to 9 Unit Apartments | 2,314 | 5.1% |
| 10 or more Apartments | 5,277 | 11.7% |
| Mobile Home / Other | 3,603 | 8.0% |
| Total | 45,297 | 100.0% |
Housing Structures by Occupancy in Las Cruces
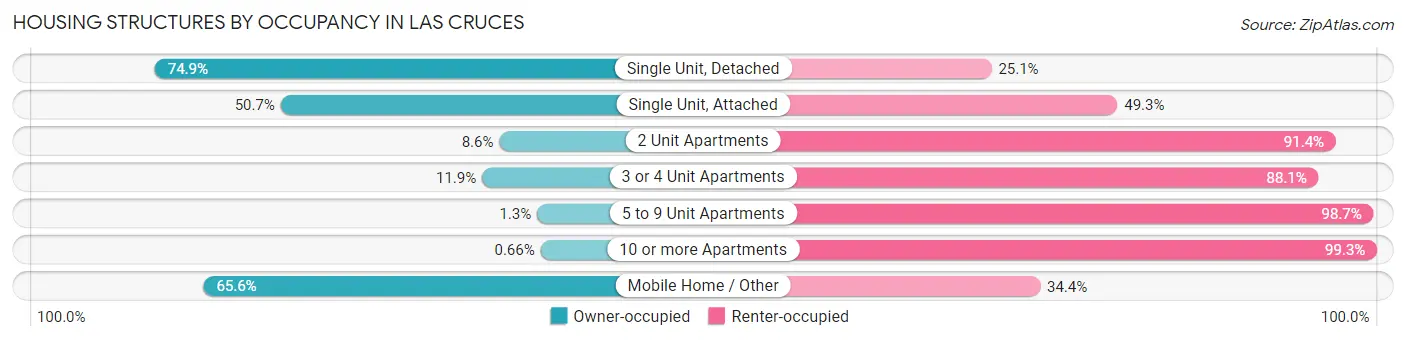
| Structure Type | Owner-occupied | Renter-occupied |
| Single Unit, Detached | 20,174 (74.9%) | 6,755 (25.1%) |
| Single Unit, Attached | 1,280 (50.7%) | 1,245 (49.3%) |
| 2 Unit Apartments | 117 (8.6%) | 1,243 (91.4%) |
| 3 or 4 Unit Apartments | 392 (11.9%) | 2,897 (88.1%) |
| 5 to 9 Unit Apartments | 31 (1.3%) | 2,283 (98.7%) |
| 10 or more Apartments | 35 (0.7%) | 5,242 (99.3%) |
| Mobile Home / Other | 2,362 (65.6%) | 1,241 (34.4%) |
| Total | 24,391 (53.8%) | 20,906 (46.2%) |
Housing Structures by Number of Rooms in Las Cruces
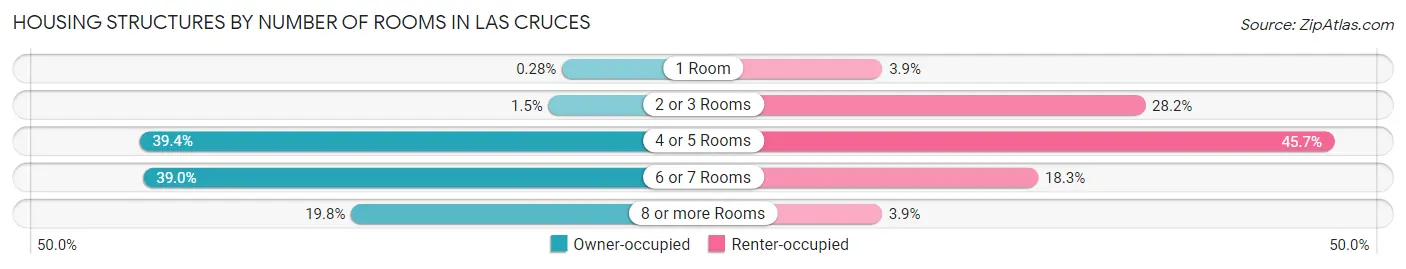
| Number of Rooms | Owner-occupied | Renter-occupied |
| 1 Room | 69 (0.3%) | 817 (3.9%) |
| 2 or 3 Rooms | 374 (1.5%) | 5,901 (28.2%) |
| 4 or 5 Rooms | 9,603 (39.4%) | 9,547 (45.7%) |
| 6 or 7 Rooms | 9,517 (39.0%) | 3,831 (18.3%) |
| 8 or more Rooms | 4,828 (19.8%) | 810 (3.9%) |
| Total | 24,391 (100.0%) | 20,906 (100.0%) |
Housing Structure by Heating Type in Las Cruces
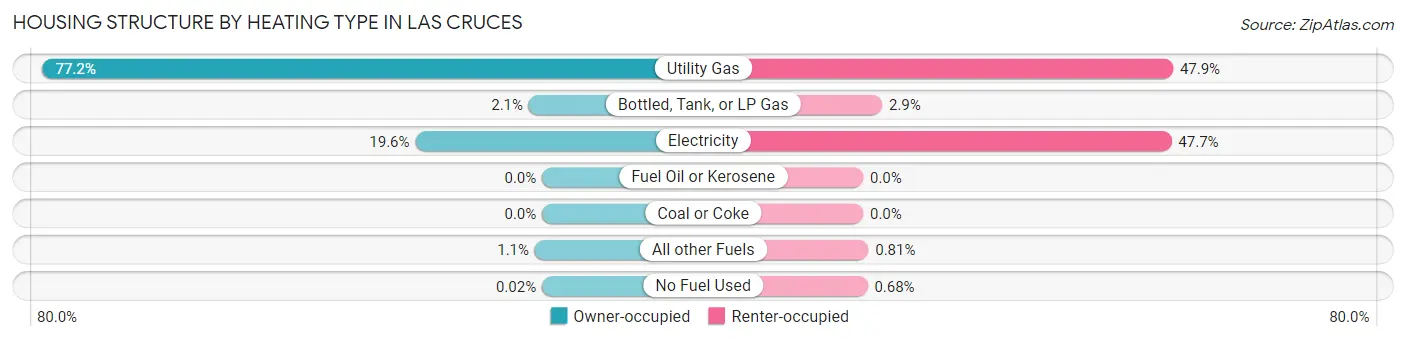
| Heating Type | Owner-occupied | Renter-occupied |
| Utility Gas | 18,835 (77.2%) | 10,016 (47.9%) |
| Bottled, Tank, or LP Gas | 500 (2.1%) | 613 (2.9%) |
| Electricity | 4,778 (19.6%) | 9,965 (47.7%) |
| Fuel Oil or Kerosene | 0 (0.0%) | 0 (0.0%) |
| Coal or Coke | 0 (0.0%) | 0 (0.0%) |
| All other Fuels | 274 (1.1%) | 170 (0.8%) |
| No Fuel Used | 4 (0.0%) | 142 (0.7%) |
| Total | 24,391 (100.0%) | 20,906 (100.0%) |
Household Vehicle Usage in Las Cruces
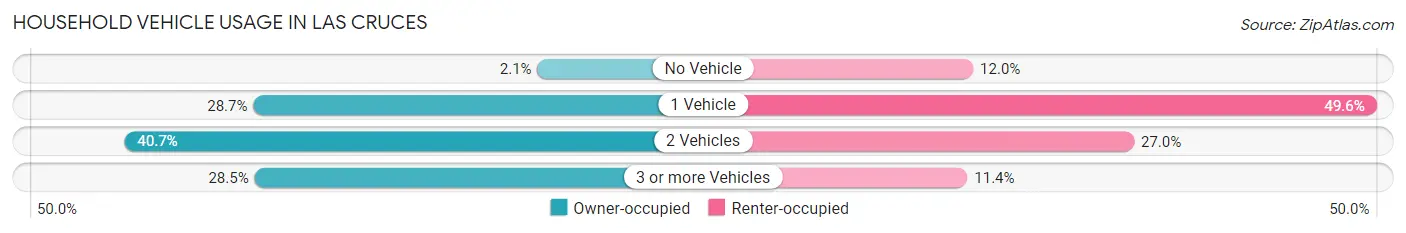
| Vehicles per Household | Owner-occupied | Renter-occupied |
| No Vehicle | 520 (2.1%) | 2,502 (12.0%) |
| 1 Vehicle | 6,988 (28.6%) | 10,373 (49.6%) |
| 2 Vehicles | 9,922 (40.7%) | 5,642 (27.0%) |
| 3 or more Vehicles | 6,961 (28.5%) | 2,389 (11.4%) |
| Total | 24,391 (100.0%) | 20,906 (100.0%) |
Real Estate & Mortgages in Las Cruces
Real Estate and Mortgage Overview in Las Cruces
| Characteristic | Without Mortgage | With Mortgage |
| Housing Units | 9,529 | 14,862 |
| Median Property Value | $178,200 | $212,200 |
| Median Household Income | $61,362 | $2,840 |
| Monthly Housing Costs | $412 | $387 |
| Real Estate Taxes | $1,360 | $872 |
Property Value by Mortgage Status in Las Cruces
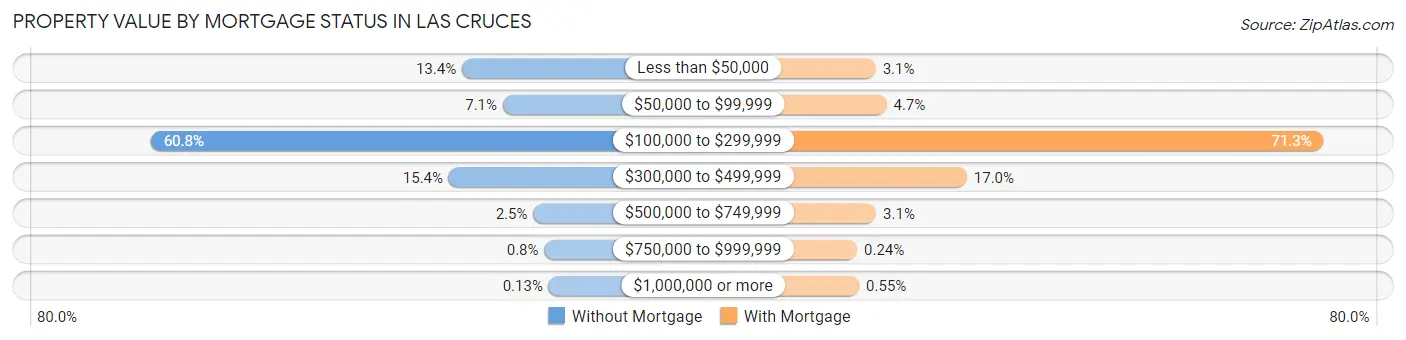
| Property Value | Without Mortgage | With Mortgage |
| Less than $50,000 | 1,272 (13.4%) | 457 (3.1%) |
| $50,000 to $99,999 | 678 (7.1%) | 702 (4.7%) |
| $100,000 to $299,999 | 5,792 (60.8%) | 10,598 (71.3%) |
| $300,000 to $499,999 | 1,463 (15.3%) | 2,521 (17.0%) |
| $500,000 to $749,999 | 236 (2.5%) | 467 (3.1%) |
| $750,000 to $999,999 | 76 (0.8%) | 36 (0.2%) |
| $1,000,000 or more | 12 (0.1%) | 81 (0.5%) |
| Total | 9,529 (100.0%) | 14,862 (100.0%) |
Household Income by Mortgage Status in Las Cruces
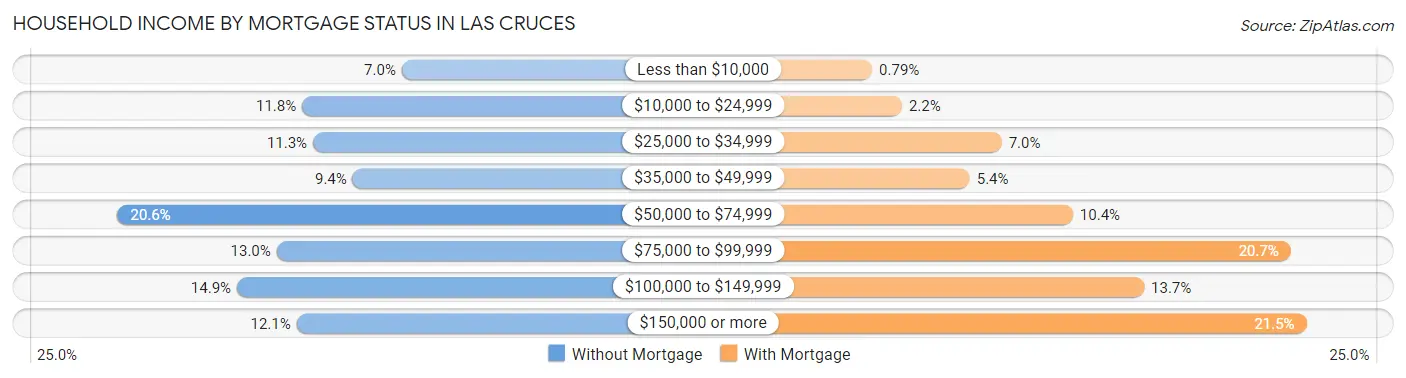
| Household Income | Without Mortgage | With Mortgage |
| Less than $10,000 | 671 (7.0%) | 118 (0.8%) |
| $10,000 to $24,999 | 1,123 (11.8%) | 328 (2.2%) |
| $25,000 to $34,999 | 1,074 (11.3%) | 1,035 (7.0%) |
| $35,000 to $49,999 | 894 (9.4%) | 808 (5.4%) |
| $50,000 to $74,999 | 1,961 (20.6%) | 1,538 (10.3%) |
| $75,000 to $99,999 | 1,239 (13.0%) | 3,080 (20.7%) |
| $100,000 to $149,999 | 1,419 (14.9%) | 2,042 (13.7%) |
| $150,000 or more | 1,148 (12.0%) | 3,191 (21.5%) |
| Total | 9,529 (100.0%) | 14,862 (100.0%) |
Property Value to Household Income Ratio in Las Cruces
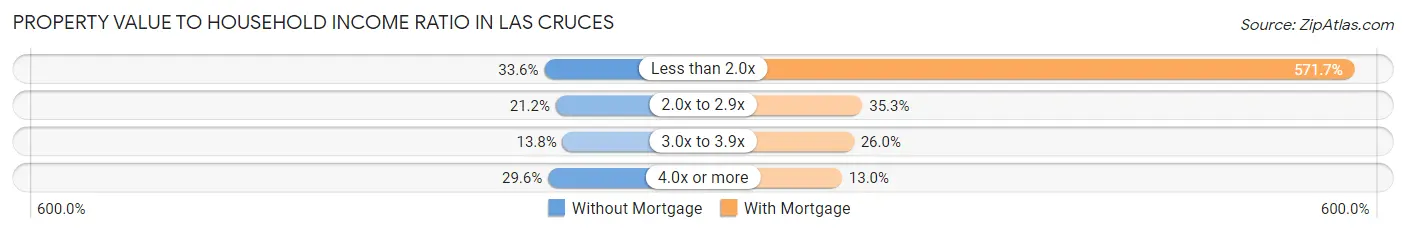
| Value-to-Income Ratio | Without Mortgage | With Mortgage |
| Less than 2.0x | 3,206 (33.6%) | 84,967 (571.7%) |
| 2.0x to 2.9x | 2,019 (21.2%) | 5,249 (35.3%) |
| 3.0x to 3.9x | 1,314 (13.8%) | 3,857 (26.0%) |
| 4.0x or more | 2,823 (29.6%) | 1,931 (13.0%) |
| Total | 9,529 (100.0%) | 14,862 (100.0%) |
Real Estate Taxes by Mortgage Status in Las Cruces
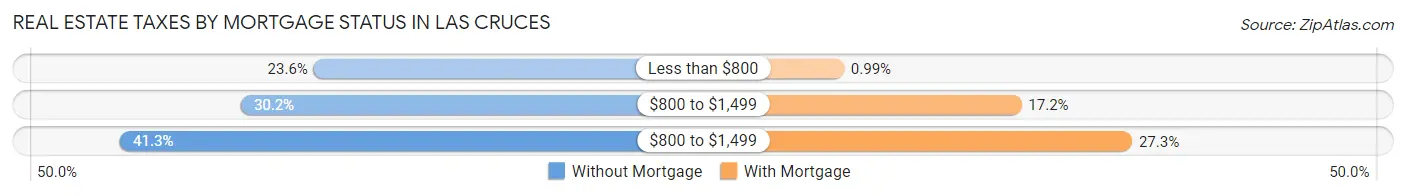
| Property Taxes | Without Mortgage | With Mortgage |
| Less than $800 | 2,249 (23.6%) | 147 (1.0%) |
| $800 to $1,499 | 2,882 (30.2%) | 2,556 (17.2%) |
| $800 to $1,499 | 3,933 (41.3%) | 4,058 (27.3%) |
| Total | 9,529 (100.0%) | 14,862 (100.0%) |
Health & Disability in Las Cruces
Health Insurance Coverage by Age in Las Cruces
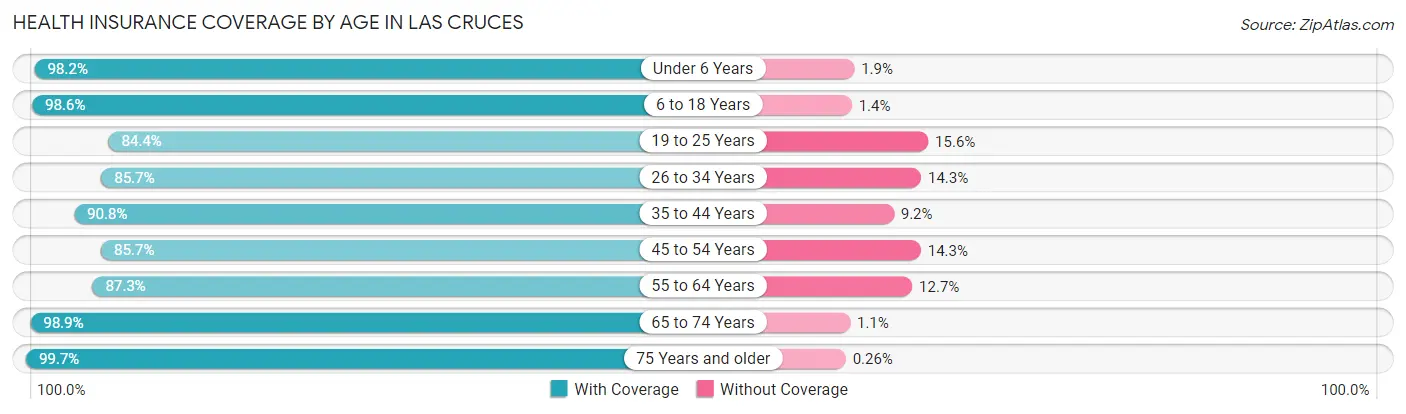
| Age Bracket | With Coverage | Without Coverage |
| Under 6 Years | 7,991 (98.2%) | 151 (1.8%) |
| 6 to 18 Years | 18,794 (98.6%) | 265 (1.4%) |
| 19 to 25 Years | 14,679 (84.4%) | 2,722 (15.6%) |
| 26 to 34 Years | 12,824 (85.7%) | 2,141 (14.3%) |
| 35 to 44 Years | 11,265 (90.8%) | 1,145 (9.2%) |
| 45 to 54 Years | 8,861 (85.7%) | 1,475 (14.3%) |
| 55 to 64 Years | 9,652 (87.3%) | 1,399 (12.7%) |
| 65 to 74 Years | 9,703 (98.9%) | 105 (1.1%) |
| 75 Years and older | 6,926 (99.7%) | 18 (0.3%) |
| Total | 100,695 (91.4%) | 9,421 (8.6%) |
Health Insurance Coverage by Citizenship Status in Las Cruces
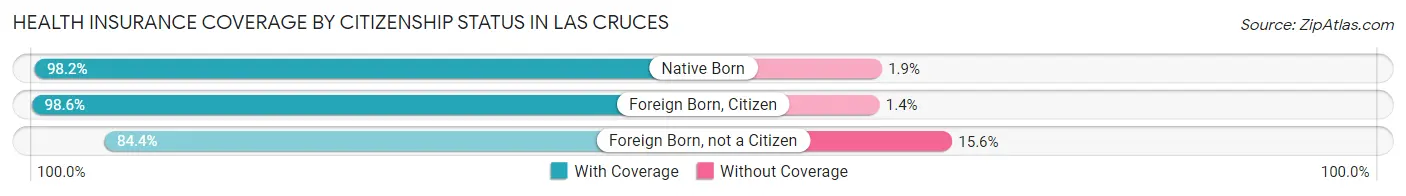
| Citizenship Status | With Coverage | Without Coverage |
| Native Born | 7,991 (98.2%) | 151 (1.8%) |
| Foreign Born, Citizen | 18,794 (98.6%) | 265 (1.4%) |
| Foreign Born, not a Citizen | 14,679 (84.4%) | 2,722 (15.6%) |
Health Insurance Coverage by Household Income in Las Cruces
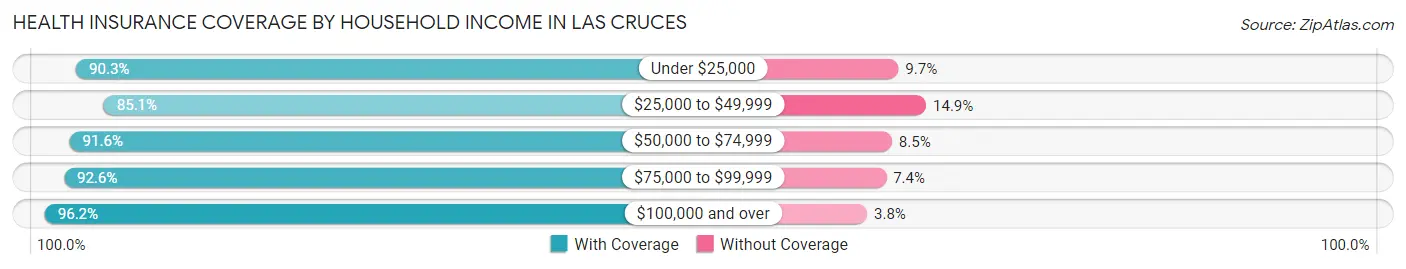
| Household Income | With Coverage | Without Coverage |
| Under $25,000 | 20,434 (90.3%) | 2,187 (9.7%) |
| $25,000 to $49,999 | 19,017 (85.1%) | 3,320 (14.9%) |
| $50,000 to $74,999 | 17,140 (91.5%) | 1,581 (8.5%) |
| $75,000 to $99,999 | 13,314 (92.6%) | 1,062 (7.4%) |
| $100,000 and over | 30,500 (96.2%) | 1,206 (3.8%) |
Public vs Private Health Insurance Coverage by Age in Las Cruces
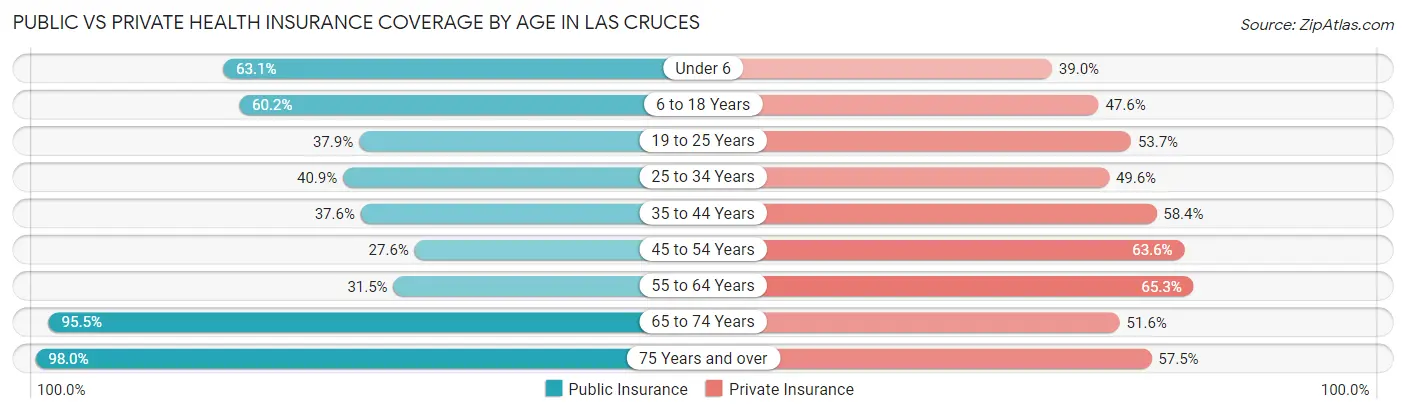
| Age Bracket | Public Insurance | Private Insurance |
| Under 6 | 5,141 (63.1%) | 3,175 (39.0%) |
| 6 to 18 Years | 11,471 (60.2%) | 9,080 (47.6%) |
| 19 to 25 Years | 6,600 (37.9%) | 9,339 (53.7%) |
| 25 to 34 Years | 6,121 (40.9%) | 7,421 (49.6%) |
| 35 to 44 Years | 4,668 (37.6%) | 7,244 (58.4%) |
| 45 to 54 Years | 2,853 (27.6%) | 6,573 (63.6%) |
| 55 to 64 Years | 3,485 (31.5%) | 7,216 (65.3%) |
| 65 to 74 Years | 9,370 (95.5%) | 5,058 (51.6%) |
| 75 Years and over | 6,806 (98.0%) | 3,991 (57.5%) |
| Total | 56,515 (51.3%) | 59,097 (53.7%) |
Disability Status by Sex by Age in Las Cruces
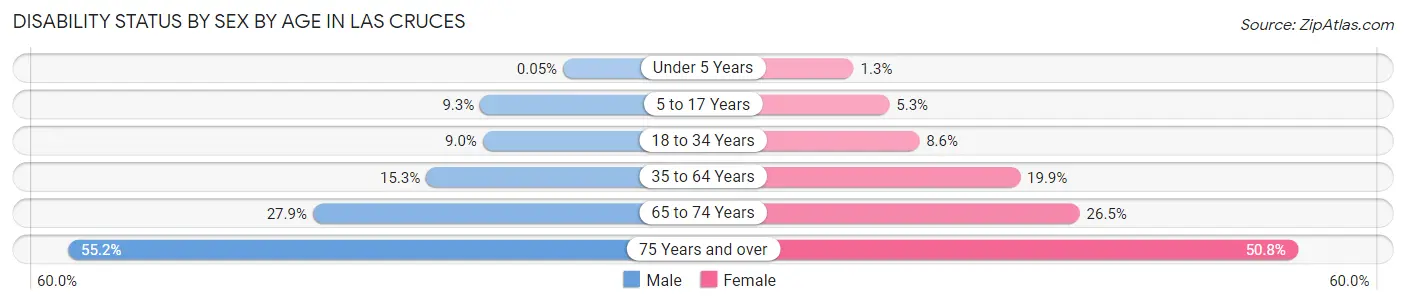
| Age Bracket | Male | Female |
| Under 5 Years | 2 (0.1%) | 41 (1.3%) |
| 5 to 17 Years | 818 (9.3%) | 524 (5.3%) |
| 18 to 34 Years | 1,558 (9.0%) | 1,437 (8.6%) |
| 35 to 64 Years | 2,438 (15.3%) | 3,545 (19.9%) |
| 65 to 74 Years | 1,298 (27.9%) | 1,366 (26.5%) |
| 75 Years and over | 1,864 (55.2%) | 1,810 (50.8%) |
Disability Class by Sex by Age in Las Cruces
Disability Class: Hearing Difficulty
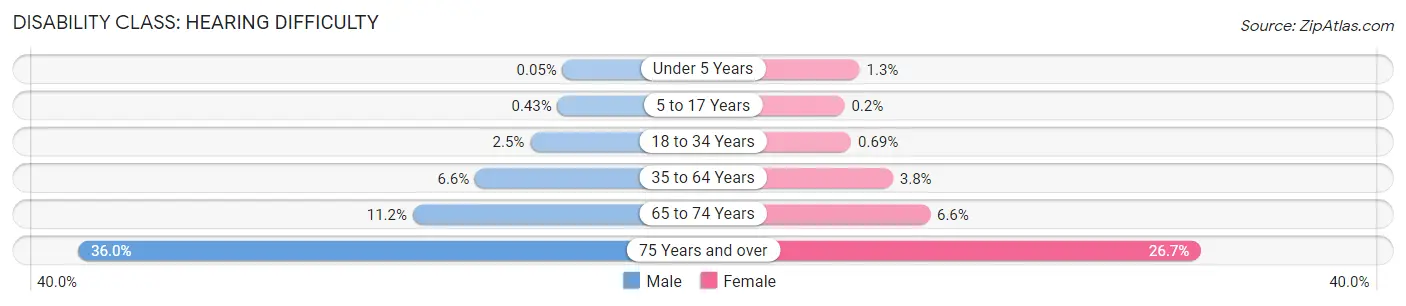
| Age Bracket | Male | Female |
| Under 5 Years | 2 (0.1%) | 41 (1.3%) |
| 5 to 17 Years | 38 (0.4%) | 20 (0.2%) |
| 18 to 34 Years | 426 (2.5%) | 115 (0.7%) |
| 35 to 64 Years | 1,044 (6.6%) | 676 (3.8%) |
| 65 to 74 Years | 520 (11.2%) | 338 (6.6%) |
| 75 Years and over | 1,217 (36.0%) | 951 (26.7%) |
Disability Class: Vision Difficulty
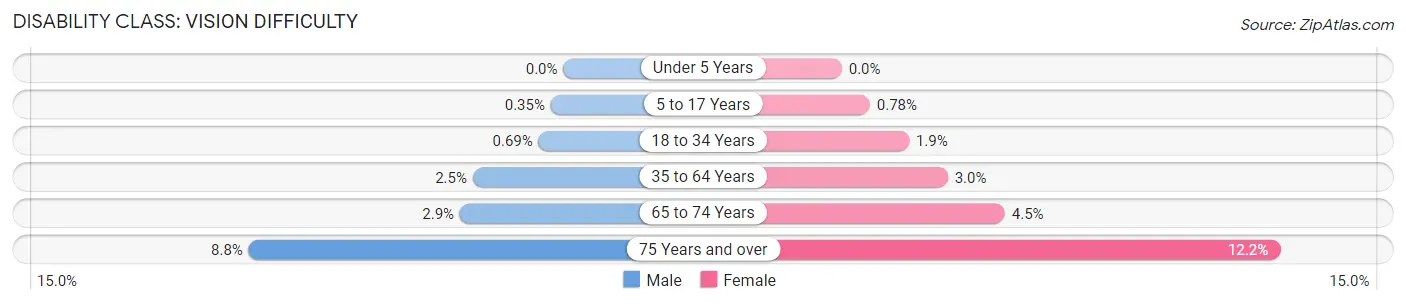
| Age Bracket | Male | Female |
| Under 5 Years | 0 (0.0%) | 0 (0.0%) |
| 5 to 17 Years | 31 (0.4%) | 77 (0.8%) |
| 18 to 34 Years | 120 (0.7%) | 312 (1.9%) |
| 35 to 64 Years | 401 (2.5%) | 527 (2.9%) |
| 65 to 74 Years | 134 (2.9%) | 234 (4.5%) |
| 75 Years and over | 296 (8.8%) | 435 (12.2%) |
Disability Class: Cognitive Difficulty
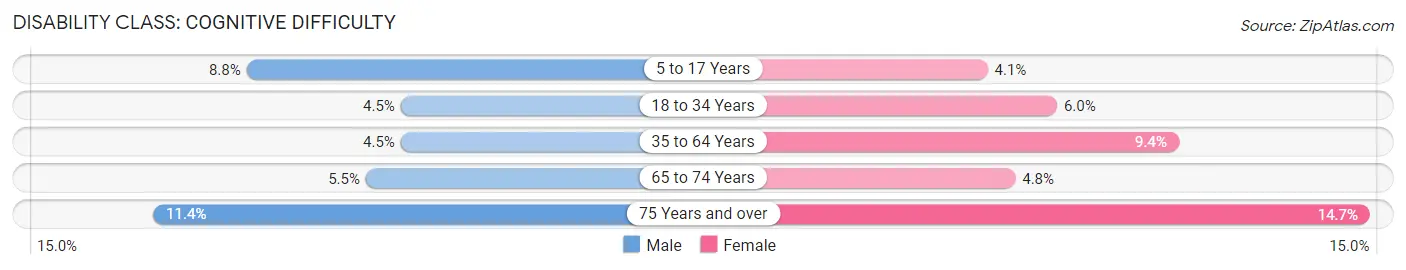
| Age Bracket | Male | Female |
| 5 to 17 Years | 778 (8.8%) | 401 (4.1%) |
| 18 to 34 Years | 785 (4.5%) | 998 (6.0%) |
| 35 to 64 Years | 723 (4.5%) | 1,674 (9.4%) |
| 65 to 74 Years | 256 (5.5%) | 249 (4.8%) |
| 75 Years and over | 386 (11.4%) | 524 (14.7%) |
Disability Class: Ambulatory Difficulty
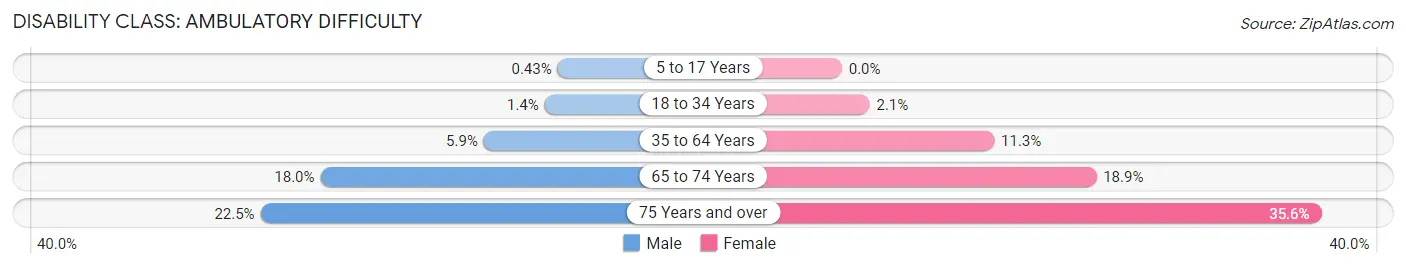
| Age Bracket | Male | Female |
| 5 to 17 Years | 38 (0.4%) | 0 (0.0%) |
| 18 to 34 Years | 241 (1.4%) | 343 (2.1%) |
| 35 to 64 Years | 942 (5.9%) | 2,019 (11.3%) |
| 65 to 74 Years | 839 (18.0%) | 974 (18.9%) |
| 75 Years and over | 760 (22.5%) | 1,269 (35.6%) |
Disability Class: Self-Care Difficulty
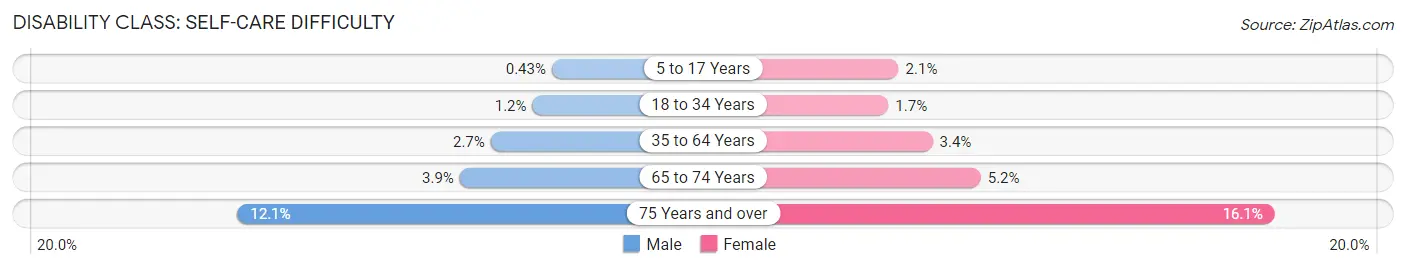
| Age Bracket | Male | Female |
| 5 to 17 Years | 38 (0.4%) | 209 (2.1%) |
| 18 to 34 Years | 199 (1.1%) | 288 (1.7%) |
| 35 to 64 Years | 430 (2.7%) | 602 (3.4%) |
| 65 to 74 Years | 179 (3.8%) | 266 (5.2%) |
| 75 Years and over | 409 (12.1%) | 573 (16.1%) |
Technology Access in Las Cruces
Computing Device Access in Las Cruces
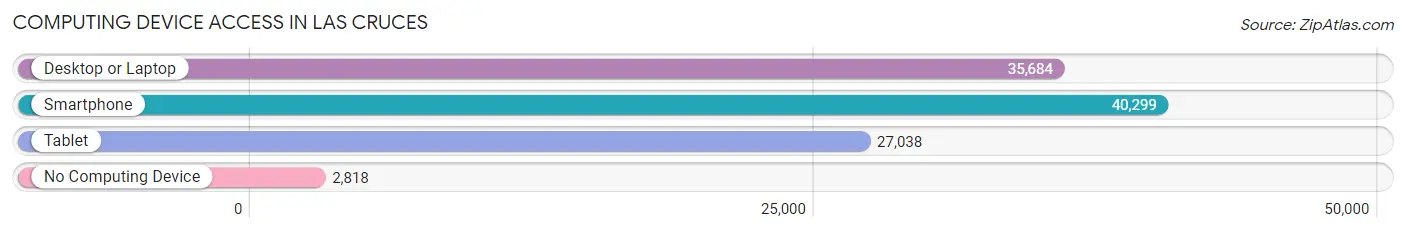
| Device Type | # Households | % Households |
| Desktop or Laptop | 35,684 | 78.8% |
| Smartphone | 40,299 | 89.0% |
| Tablet | 27,038 | 59.7% |
| No Computing Device | 2,818 | 6.2% |
| Total | 45,297 | 100.0% |
Internet Access in Las Cruces
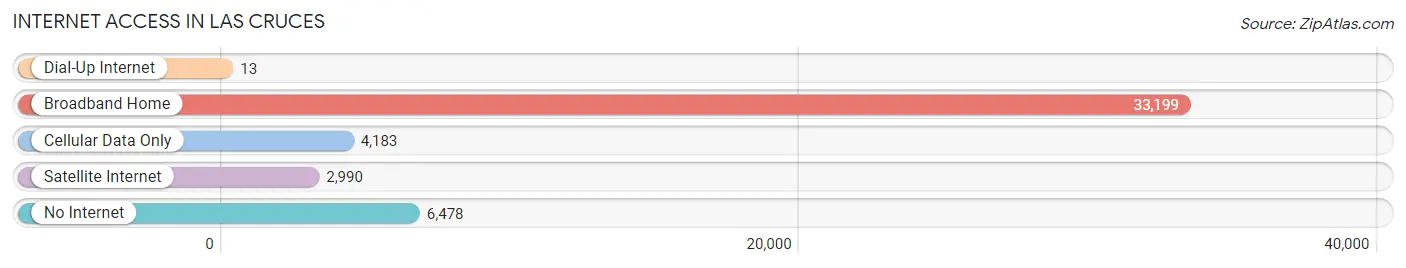
| Internet Type | # Households | % Households |
| Dial-Up Internet | 13 | 0.0% |
| Broadband Home | 33,199 | 73.3% |
| Cellular Data Only | 4,183 | 9.2% |
| Satellite Internet | 2,990 | 6.6% |
| No Internet | 6,478 | 14.3% |
| Total | 45,297 | 100.0% |
Las Cruces Summary
Las Cruces, New Mexico is a city located in the southern part of the state, in Dona Ana County. It is the second largest city in the state, with a population of 101,324 as of the 2019 census. The city is located in the Mesilla Valley, between the Organ Mountains to the east and the Rio Grande to the west. Las Cruces is the county seat of Dona Ana County, and is the economic and cultural hub of the region.
History
The area that is now Las Cruces was first inhabited by the Mescalero Apache, who lived in the area for centuries before the arrival of Spanish settlers in the late 16th century. The Spanish established a mission in the area in 1659, and the settlement of Las Cruces was founded in 1849. The city was named after the nearby Cruces Mountains, which were named for the crosses that were placed on the mountains by Spanish explorers.
Las Cruces was an important stop on the Butterfield Overland Mail route, which ran from St. Louis to San Francisco. The city was also an important stop on the Santa Fe Trail, which connected Missouri to California.
In the late 19th century, Las Cruces became an important agricultural center, with the establishment of the Mesilla Valley Irrigation District in 1881. The district provided water to the area, allowing for the growth of crops such as cotton, alfalfa, and pecans.
Geography
Las Cruces is located in the southern part of New Mexico, in Dona Ana County. The city is situated in the Mesilla Valley, between the Organ Mountains to the east and the Rio Grande to the west. The city is located at an elevation of 3,912 feet above sea level.
Las Cruces has a semi-arid climate, with hot summers and mild winters. The average annual temperature is 64°F, and the average annual precipitation is 8.5 inches.
Economy
Las Cruces is the economic and cultural hub of the region. The city is home to New Mexico State University, which is the largest university in the state. The university is a major employer in the city, and is also a major contributor to the local economy.
The city is also home to several major employers, including White Sands Missile Range, the U.S. Army's Fort Bliss, and the Las Cruces International Airport. The city is also home to several major manufacturing companies, including Intel, Lockheed Martin, and Boeing.
Demographics
As of the 2019 census, the population of Las Cruces was 101,324. The city has a diverse population, with a majority of the population being of Hispanic or Latino origin. The city also has a significant Native American population, with 8.3% of the population being Native American.
The median household income in Las Cruces is $41,945, and the median home value is $164,400. The city has a poverty rate of 22.3%, and the unemployment rate is 4.7%.
Las Cruces is a vibrant and diverse city, with a rich history and a bright future. The city is home to a thriving economy, and is a great place to live, work, and play.
Common Questions
What is the Total Population of Las Cruces?
Total Population of Las Cruces is 111,273.
What is the Total Male Population of Las Cruces?
Total Male Population of Las Cruces is 54,588.
What is the Total Female Population of Las Cruces?
Total Female Population of Las Cruces is 56,685.
What is the Ratio of Males per 100 Females in Las Cruces?
There are 96.30 Males per 100 Females in Las Cruces.
What is the Ratio of Females per 100 Males in Las Cruces?
There are 103.84 Females per 100 Males in Las Cruces.
What is the Median Population Age in Las Cruces?
Median Population Age in Las Cruces is 31.8 Years.
What is the Average Family Size in Las Cruces
Average Family Size in Las Cruces is 3.2 People.
What is the Average Household Size in Las Cruces
Average Household Size in Las Cruces is 2.4 People.
What is Per Capita Income in Las Cruces?
Per Capita income in Las Cruces is $28,239.
What is the Median Family Income in Las Cruces?
Median Family Income in Las Cruces is $60,507.
What is the Median Household income in Las Cruces?
Median Household Income in Las Cruces is $51,013.
What is Income or Wage Gap in Las Cruces?
Income or Wage Gap in Las Cruces is 21.3%.
Women in Las Cruces earn 78.7 cents for every dollar earned by a man.
What is Family Income Deficit in Las Cruces?
Family Income Deficit in Las Cruces is $10,685.
Families that are below poverty line in Las Cruces earn $10,685 less on average than the poverty threshold level.
What is Inequality or Gini Index in Las Cruces?
Inequality or Gini Index in Las Cruces is 0.48.
How Large is the Labor Force in Las Cruces?
There are 52,774 People in the Labor Forcein in Las Cruces.
What is the Percentage of People in the Labor Force in Las Cruces?
59.5% of People are in the Labor Force in Las Cruces.
What is the Unemployment Rate in Las Cruces?
Unemployment Rate in Las Cruces is 7.5%.