Cedro, NM
Cedro Map
Cedro Overview
577
TOTAL POPULATION
341
MALE POPULATION
236
FEMALE POPULATION
144.49
MALES / 100 FEMALES
69.21
FEMALES / 100 MALES
41.3
MEDIAN AGE
2.5
AVG FAMILY SIZE
2.4
AVG HOUSEHOLD SIZE
$53,927
PER CAPITA INCOME
$102,153
AVG FAMILY INCOME
$100,694
AVG HOUSEHOLD INCOME
36.7%
WAGE / INCOME GAP [ % ]
63.3¢/ $1
WAGE / INCOME GAP [ $ ]
0.38
INEQUALITY / GINI INDEX
233
LABOR FORCE [ PEOPLE ]
52.7%
PERCENT IN LABOR FORCE
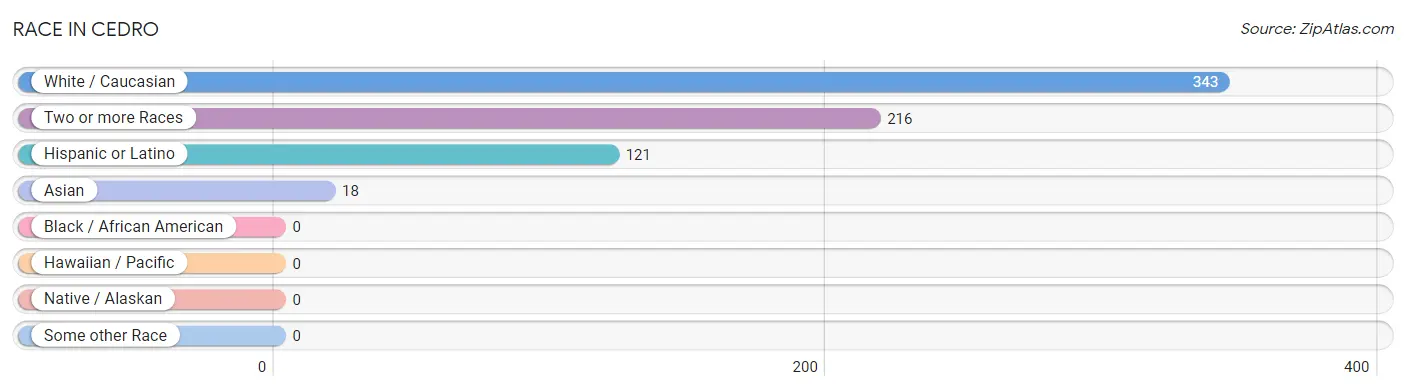
Race in Cedro
The most populous races in Cedro are White / Caucasian (343 | 59.5%), Two or more Races (216 | 37.4%), and Hispanic or Latino (121 | 21.0%).
| Race | # Population | % Population |
| Asian | 18 | 3.1% |
| Black / African American | 0 | 0.0% |
| Hawaiian / Pacific | 0 | 0.0% |
| Hispanic or Latino | 121 | 21.0% |
| Native / Alaskan | 0 | 0.0% |
| White / Caucasian | 343 | 59.5% |
| Two or more Races | 216 | 37.4% |
| Some other Race | 0 | 0.0% |
| Total | 577 | 100.0% |
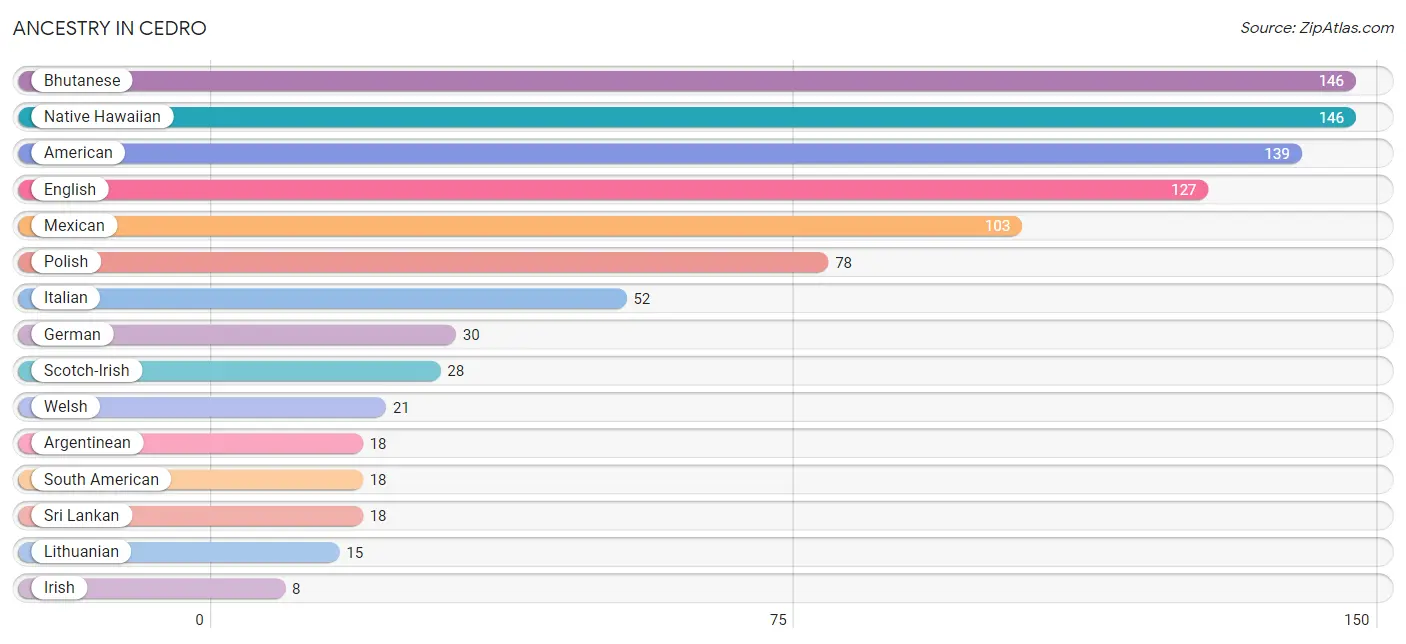
Ancestry in Cedro
The most populous ancestries reported in Cedro are Bhutanese (146 | 25.3%), Native Hawaiian (146 | 25.3%), American (139 | 24.1%), English (127 | 22.0%), and Mexican (103 | 17.8%), together accounting for 114.5% of all Cedro residents.
| Ancestry | # Population | % Population |
| American | 139 | 24.1% |
| Argentinean | 18 | 3.1% |
| Bhutanese | 146 | 25.3% |
| English | 127 | 22.0% |
| German | 30 | 5.2% |
| Irish | 8 | 1.4% |
| Italian | 52 | 9.0% |
| Lithuanian | 15 | 2.6% |
| Mexican | 103 | 17.8% |
| Native Hawaiian | 146 | 25.3% |
| Polish | 78 | 13.5% |
| Scotch-Irish | 28 | 4.9% |
| Scottish | 8 | 1.4% |
| South American | 18 | 3.1% |
| Sri Lankan | 18 | 3.1% |
| Welsh | 21 | 3.6% | View All 16 Rows |
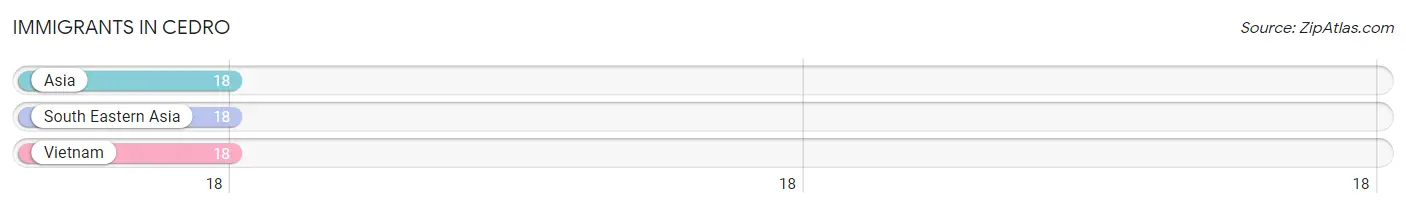
Immigrants in Cedro
The most numerous immigrant groups reported in Cedro came from Asia (18 | 3.1%), South Eastern Asia (18 | 3.1%), and Vietnam (18 | 3.1%), together accounting for 9.4% of all Cedro residents.
| Immigration Origin | # Population | % Population |
| Asia | 18 | 3.1% |
| South Eastern Asia | 18 | 3.1% |
| Vietnam | 18 | 3.1% | View All 3 Rows |
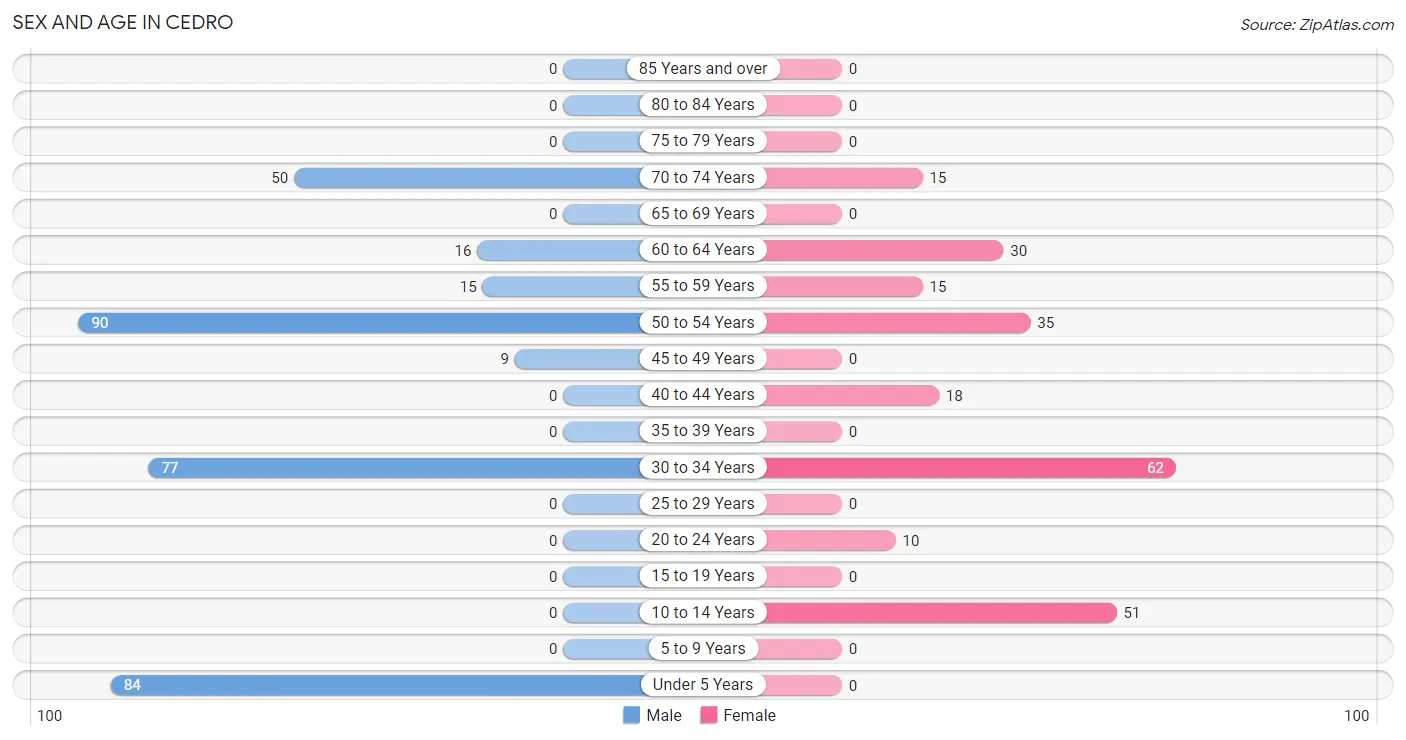
Sex and Age in Cedro
Sex and Age in Cedro
The most populous age groups in Cedro are 50 to 54 Years (90 | 26.4%) for men and 30 to 34 Years (62 | 26.3%) for women.
| Age Bracket | Male | Female |
| Under 5 Years | 84 (24.6%) | 0 (0.0%) |
| 5 to 9 Years | 0 (0.0%) | 0 (0.0%) |
| 10 to 14 Years | 0 (0.0%) | 51 (21.6%) |
| 15 to 19 Years | 0 (0.0%) | 0 (0.0%) |
| 20 to 24 Years | 0 (0.0%) | 10 (4.2%) |
| 25 to 29 Years | 0 (0.0%) | 0 (0.0%) |
| 30 to 34 Years | 77 (22.6%) | 62 (26.3%) |
| 35 to 39 Years | 0 (0.0%) | 0 (0.0%) |
| 40 to 44 Years | 0 (0.0%) | 18 (7.6%) |
| 45 to 49 Years | 9 (2.6%) | 0 (0.0%) |
| 50 to 54 Years | 90 (26.4%) | 35 (14.8%) |
| 55 to 59 Years | 15 (4.4%) | 15 (6.4%) |
| 60 to 64 Years | 16 (4.7%) | 30 (12.7%) |
| 65 to 69 Years | 0 (0.0%) | 0 (0.0%) |
| 70 to 74 Years | 50 (14.7%) | 15 (6.4%) |
| 75 to 79 Years | 0 (0.0%) | 0 (0.0%) |
| 80 to 84 Years | 0 (0.0%) | 0 (0.0%) |
| 85 Years and over | 0 (0.0%) | 0 (0.0%) |
| Total | 341 (100.0%) | 236 (100.0%) |
Families and Households in Cedro
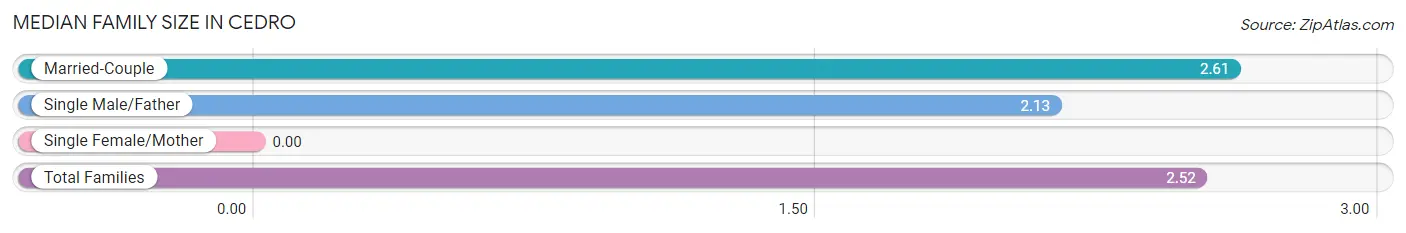
Median Family Size in Cedro
| Family Type | # Families | Family Size |
| Married-Couple | 176 (79.6%) | 2.61 |
| Single Male/Father | 45 (20.4%) | 2.13 |
| Single Female/Mother | 0 (0.0%) | - |
| Total Families | 221 (100.0%) | 2.52 |
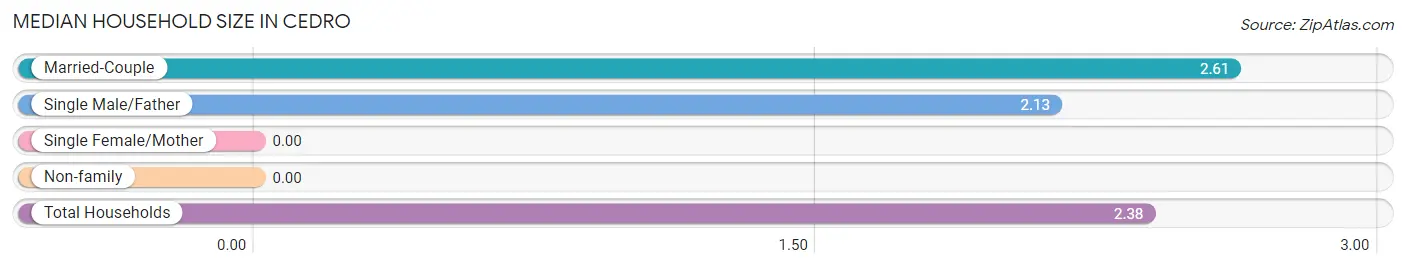
Median Household Size in Cedro
| Household Type | # Households | Household Size |
| Married-Couple | 176 (72.7%) | 2.61 |
| Single Male/Father | 45 (18.6%) | 2.13 |
| Single Female/Mother | 0 (0.0%) | - |
| Non-family | 21 (8.7%) | - |
| Total Households | 242 (100.0%) | 2.38 |
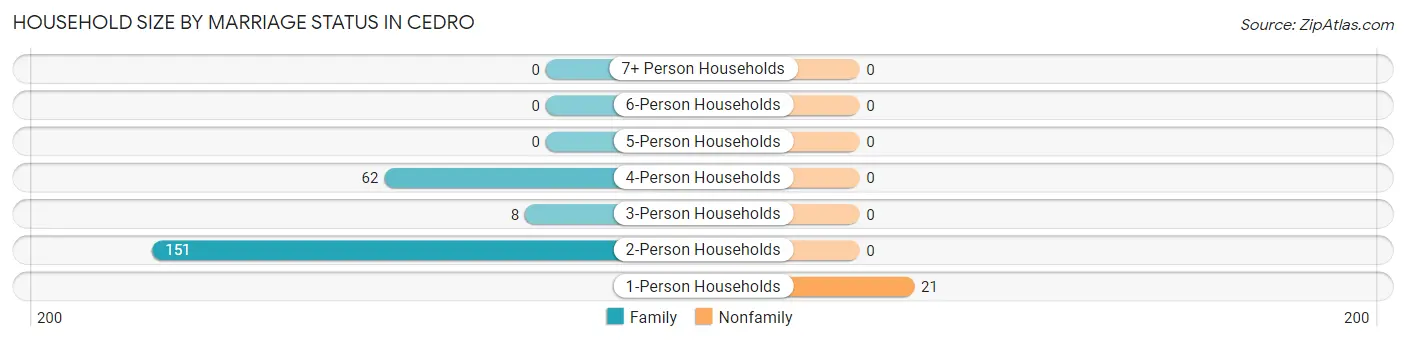
Household Size by Marriage Status in Cedro
Out of a total of 242 households in Cedro, 221 (91.3%) are family households, while 21 (8.7%) are nonfamily households. The most numerous type of family households are 2-person households, comprising 151, and the most common type of nonfamily households are 1-person households, comprising 21.
| Household Size | Family Households | Nonfamily Households |
| 1-Person Households | - | 21 (8.7%) |
| 2-Person Households | 151 (62.4%) | 0 (0.0%) |
| 3-Person Households | 8 (3.3%) | 0 (0.0%) |
| 4-Person Households | 62 (25.6%) | 0 (0.0%) |
| 5-Person Households | 0 (0.0%) | 0 (0.0%) |
| 6-Person Households | 0 (0.0%) | 0 (0.0%) |
| 7+ Person Households | 0 (0.0%) | 0 (0.0%) |
| Total | 221 (91.3%) | 21 (8.7%) |
Female Fertility in Cedro
Fertility by Age in Cedro
| Age Bracket | Women with Births | Births / 1,000 Women |
| 15 to 19 years | 0 (0.0%) | 0.0 |
| 20 to 34 years | 0 (0.0%) | 0.0 |
| 35 to 50 years | 0 (0.0%) | 0.0 |
| Total | 0 (0.0%) | 0.0 |
Fertility by Age by Marriage Status in Cedro
| Age Bracket | Married | Unmarried |
| 15 to 19 years | 0 (0.0%) | 0 (0.0%) |
| 20 to 34 years | 0 (0.0%) | 0 (0.0%) |
| 35 to 50 years | 0 (0.0%) | 0 (0.0%) |
| Total | 0 (0.0%) | 0 (0.0%) |
Fertility by Education in Cedro
| Educational Attainment | Women with Births | Births / 1,000 Women |
| Less than High School | 0 (0.0%) | 0.0 |
| High School Diploma | 0 (0.0%) | 0.0 |
| College or Associate's Degree | 0 (0.0%) | 0.0 |
| Bachelor's Degree | 0 (0.0%) | 0.0 |
| Graduate Degree | 0 (0.0%) | 0.0 |
| Total | 0 (0.0%) | 0.0 |
Fertility by Education by Marriage Status in Cedro
| Educational Attainment | Married | Unmarried |
| Less than High School | 0 (0.0%) | 0 (0.0%) |
| High School Diploma | 0 (0.0%) | 0 (0.0%) |
| College or Associate's Degree | 0 (0.0%) | 0 (0.0%) |
| Bachelor's Degree | 0 (0.0%) | 0 (0.0%) |
| Graduate Degree | 0 (0.0%) | 0 (0.0%) |
| Total | 0 (0.0%) | 0 (0.0%) |
Income in Cedro
Income Overview in Cedro
Per Capita Income in Cedro is $53,927, while median incomes of families and households are $102,153 and $100,694 respectively.
| Characteristic | Number | Measure |
| Per Capita Income | 577 | $53,927 |
| Median Family Income | 221 | $102,153 |
| Mean Family Income | 221 | $139,439 |
| Median Household Income | 242 | $100,694 |
| Mean Household Income | 242 | $128,552 |
| Income Deficit | 221 | $0 |
| Wage / Income Gap (%) | 577 | 36.74% |
| Wage / Income Gap ($) | 577 | 63.26¢ per $1 |
| Gini / Inequality Index | 577 | 0.38 |
Earnings by Sex in Cedro
Average Earnings in Cedro are $99,028, $113,361 for men and $71,714 for women, a difference of 36.7%.
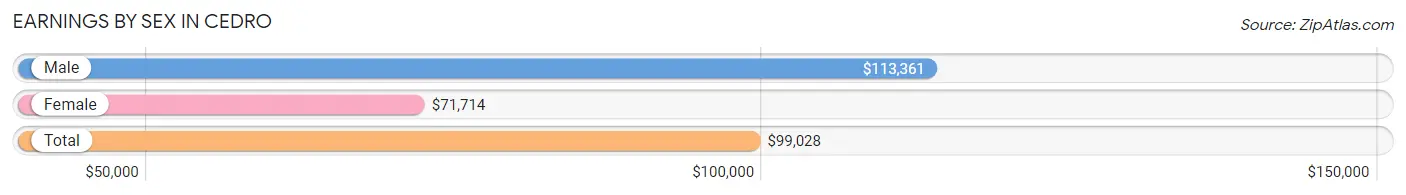
| Sex | Number | Average Earnings |
| Male | 77 (31.0%) | $113,361 |
| Female | 171 (69.0%) | $71,714 |
| Total | 248 (100.0%) | $99,028 |
Earnings by Sex by Income Bracket in Cedro
The most common earnings brackets in Cedro are $100,000+ for men (69 | 89.6%) and $65,000 to $74,999 for women (62 | 36.3%).
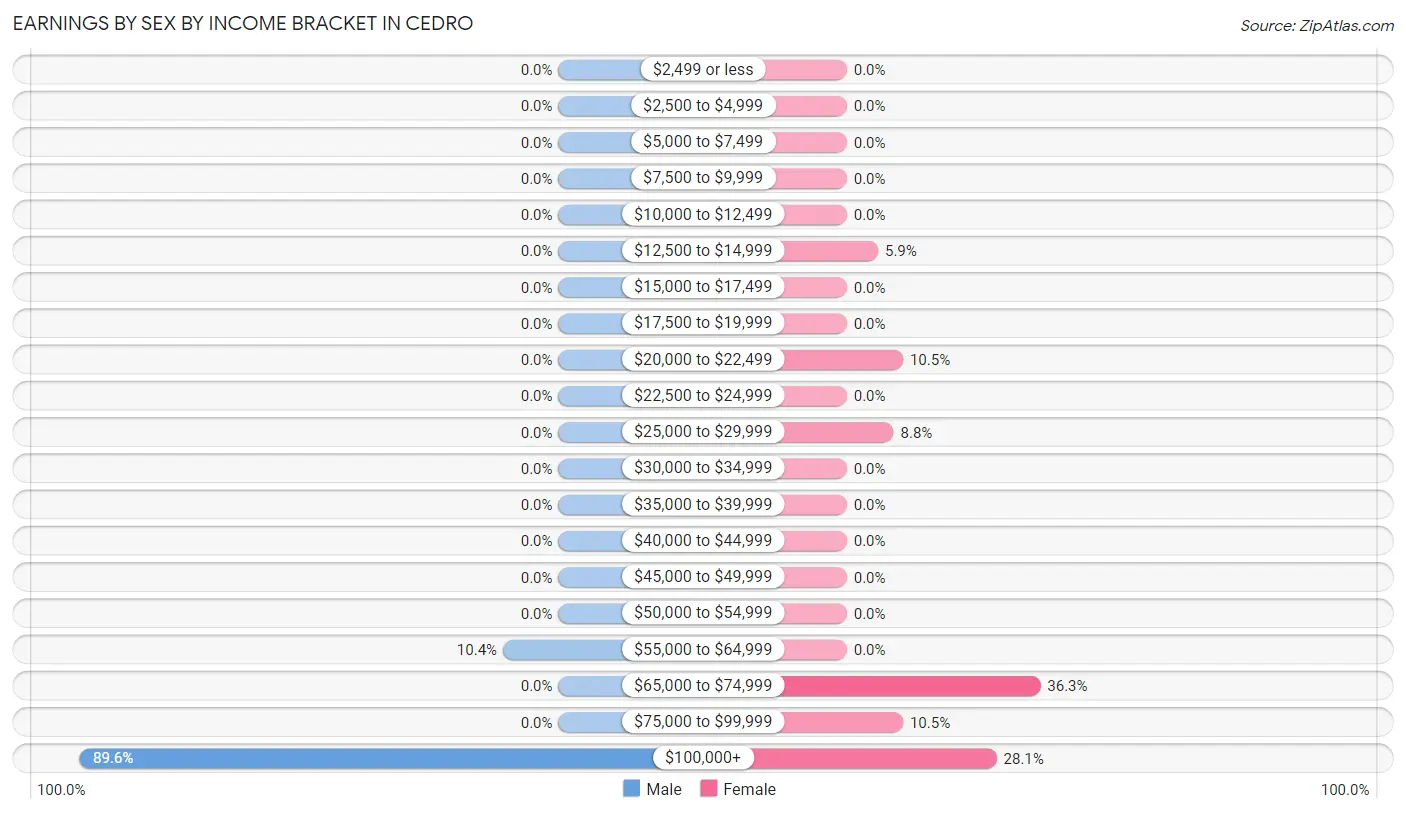
| Income | Male | Female |
| $2,499 or less | 0 (0.0%) | 0 (0.0%) |
| $2,500 to $4,999 | 0 (0.0%) | 0 (0.0%) |
| $5,000 to $7,499 | 0 (0.0%) | 0 (0.0%) |
| $7,500 to $9,999 | 0 (0.0%) | 0 (0.0%) |
| $10,000 to $12,499 | 0 (0.0%) | 0 (0.0%) |
| $12,500 to $14,999 | 0 (0.0%) | 10 (5.9%) |
| $15,000 to $17,499 | 0 (0.0%) | 0 (0.0%) |
| $17,500 to $19,999 | 0 (0.0%) | 0 (0.0%) |
| $20,000 to $22,499 | 0 (0.0%) | 18 (10.5%) |
| $22,500 to $24,999 | 0 (0.0%) | 0 (0.0%) |
| $25,000 to $29,999 | 0 (0.0%) | 15 (8.8%) |
| $30,000 to $34,999 | 0 (0.0%) | 0 (0.0%) |
| $35,000 to $39,999 | 0 (0.0%) | 0 (0.0%) |
| $40,000 to $44,999 | 0 (0.0%) | 0 (0.0%) |
| $45,000 to $49,999 | 0 (0.0%) | 0 (0.0%) |
| $50,000 to $54,999 | 0 (0.0%) | 0 (0.0%) |
| $55,000 to $64,999 | 8 (10.4%) | 0 (0.0%) |
| $65,000 to $74,999 | 0 (0.0%) | 62 (36.3%) |
| $75,000 to $99,999 | 0 (0.0%) | 18 (10.5%) |
| $100,000+ | 69 (89.6%) | 48 (28.1%) |
| Total | 77 (100.0%) | 171 (100.0%) |
Earnings by Sex by Educational Attainment in Cedro
| Educational Attainment | Male Income | Female Income |
| Less than High School | - | - |
| High School Diploma | - | - |
| College or Associate's Degree | - | - |
| Bachelor's Degree | - | - |
| Graduate Degree | - | - |
| Total | $113,361 | $71,915 |
Family Income in Cedro
Family Income Brackets in Cedro
According to the Cedro family income data, there are 78 families falling into the $100,000 to $149,999 income range, which is the most common income bracket and makes up 35.3% of all families.
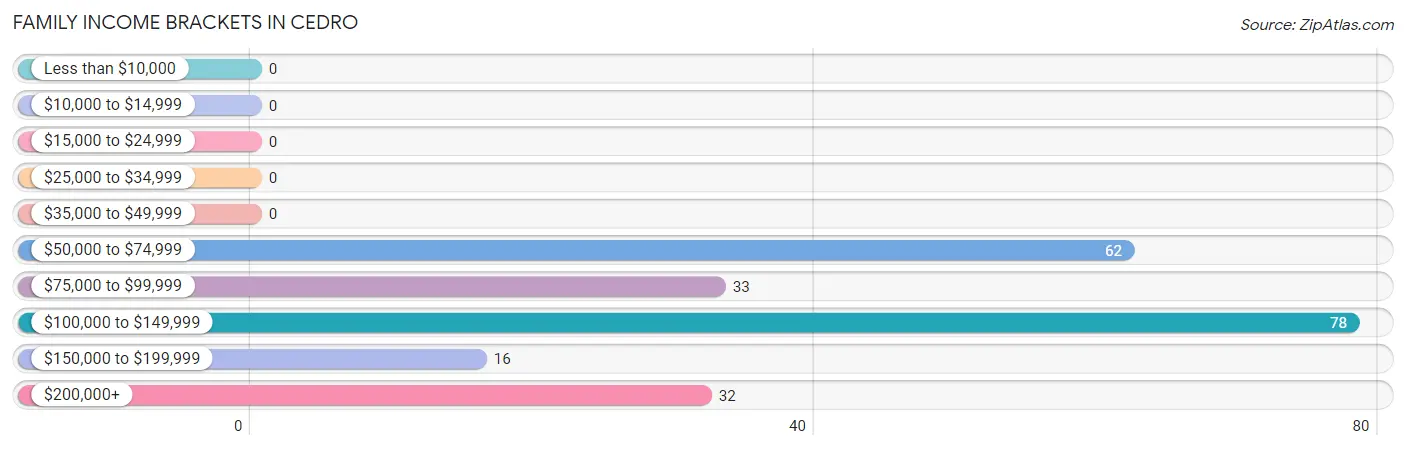
| Income Bracket | # Families | % Families |
| Less than $10,000 | 0 | 0.0% |
| $10,000 to $14,999 | 0 | 0.0% |
| $15,000 to $24,999 | 0 | 0.0% |
| $25,000 to $34,999 | 0 | 0.0% |
| $35,000 to $49,999 | 0 | 0.0% |
| $50,000 to $74,999 | 62 | 28.1% |
| $75,000 to $99,999 | 33 | 14.9% |
| $100,000 to $149,999 | 78 | 35.3% |
| $150,000 to $199,999 | 16 | 7.2% |
| $200,000+ | 32 | 14.5% |
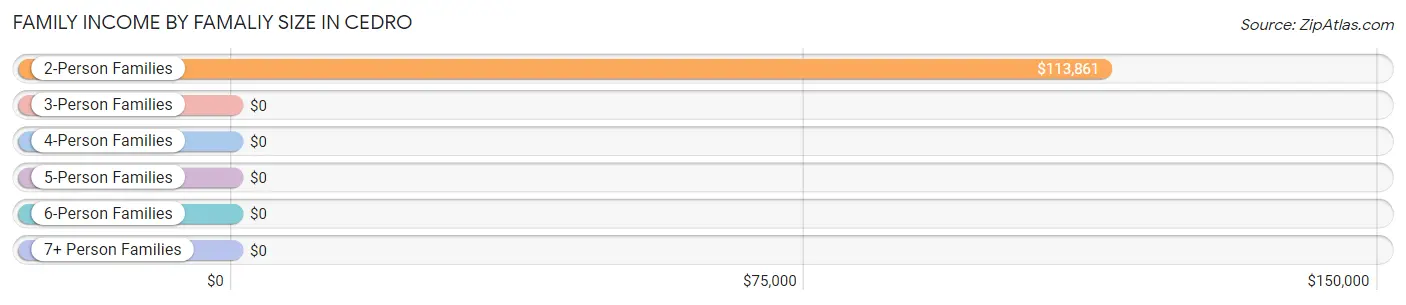
Family Income by Famaliy Size in Cedro
2-person families (151 | 68.3%) account for the highest median family income in Cedro with $113,861 per family, while 2-person families (151 | 68.3%) have the highest median income of $56,930 per family member.
| Income Bracket | # Families | Median Income |
| 2-Person Families | 151 (68.3%) | $113,861 |
| 3-Person Families | 8 (3.6%) | $0 |
| 4-Person Families | 62 (28.1%) | $0 |
| 5-Person Families | 0 (0.0%) | $0 |
| 6-Person Families | 0 (0.0%) | $0 |
| 7+ Person Families | 0 (0.0%) | $0 |
| Total | 221 (100.0%) | $102,153 |
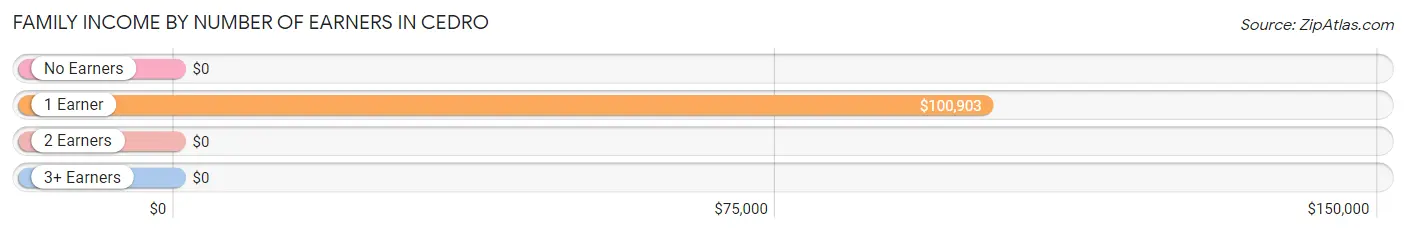
Family Income by Number of Earners in Cedro
| Number of Earners | # Families | Median Income |
| No Earners | 14 (6.3%) | $0 |
| 1 Earner | 175 (79.2%) | $100,903 |
| 2 Earners | 24 (10.9%) | $0 |
| 3+ Earners | 8 (3.6%) | $0 |
| Total | 221 (100.0%) | $102,153 |
Household Income in Cedro
Household Income Brackets in Cedro
With 78 households falling in the category, the $100,000 to $149,999 income range is the most frequent in Cedro, accounting for 32.2% of all households.
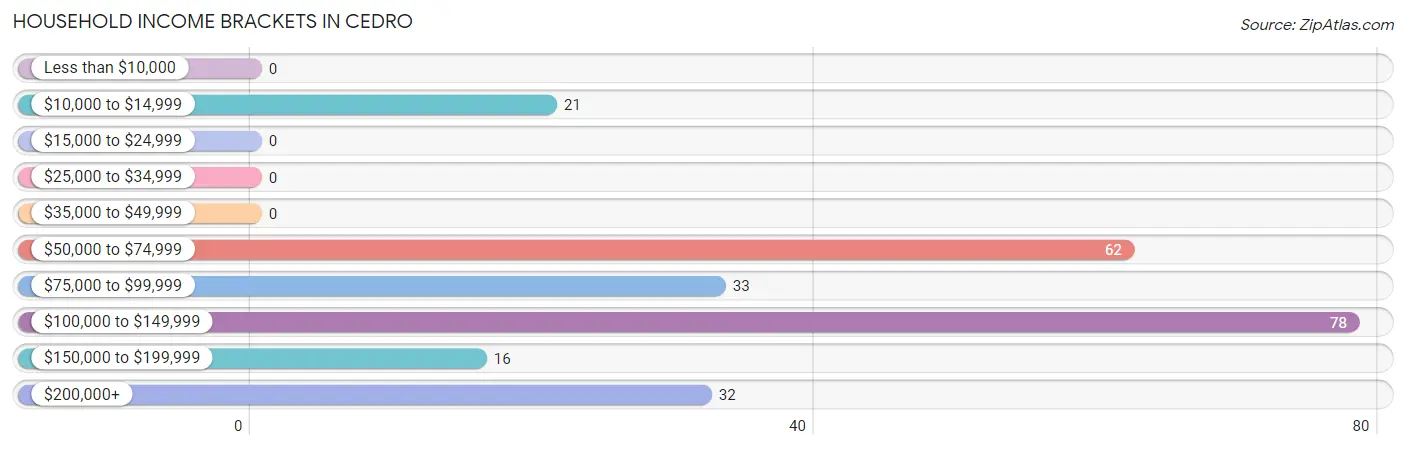
| Income Bracket | # Households | % Households |
| Less than $10,000 | 0 | 0.0% |
| $10,000 to $14,999 | 21 | 8.7% |
| $15,000 to $24,999 | 0 | 0.0% |
| $25,000 to $34,999 | 0 | 0.0% |
| $35,000 to $49,999 | 0 | 0.0% |
| $50,000 to $74,999 | 62 | 25.6% |
| $75,000 to $99,999 | 33 | 13.6% |
| $100,000 to $149,999 | 78 | 32.2% |
| $150,000 to $199,999 | 16 | 6.6% |
| $200,000+ | 32 | 13.2% |
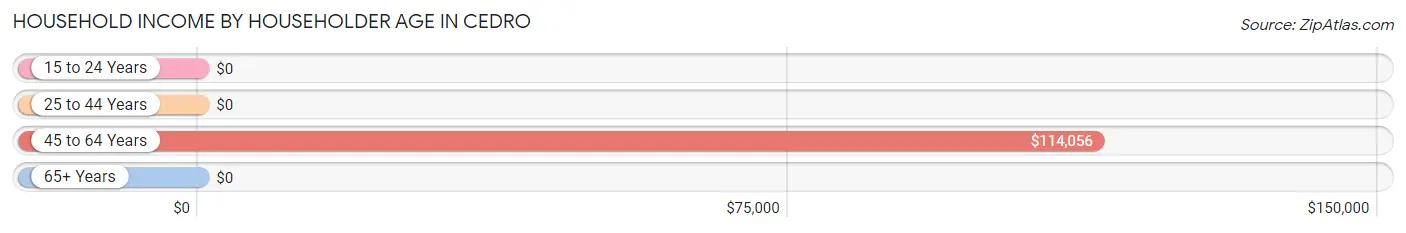
Household Income by Householder Age in Cedro
The median household income in Cedro is $100,694, with the highest median household income of $114,056 found in the 45 to 64 years age bracket for the primary householder. A total of 130 households (53.7%) fall into this category.
| Income Bracket | # Households | Median Income |
| 15 to 24 Years | 0 (0.0%) | $0 |
| 25 to 44 Years | 62 (25.6%) | $0 |
| 45 to 64 Years | 130 (53.7%) | $114,056 |
| 65+ Years | 50 (20.7%) | $0 |
| Total | 242 (100.0%) | $100,694 |
Poverty in Cedro
Income Below Poverty by Sex and Age in Cedro
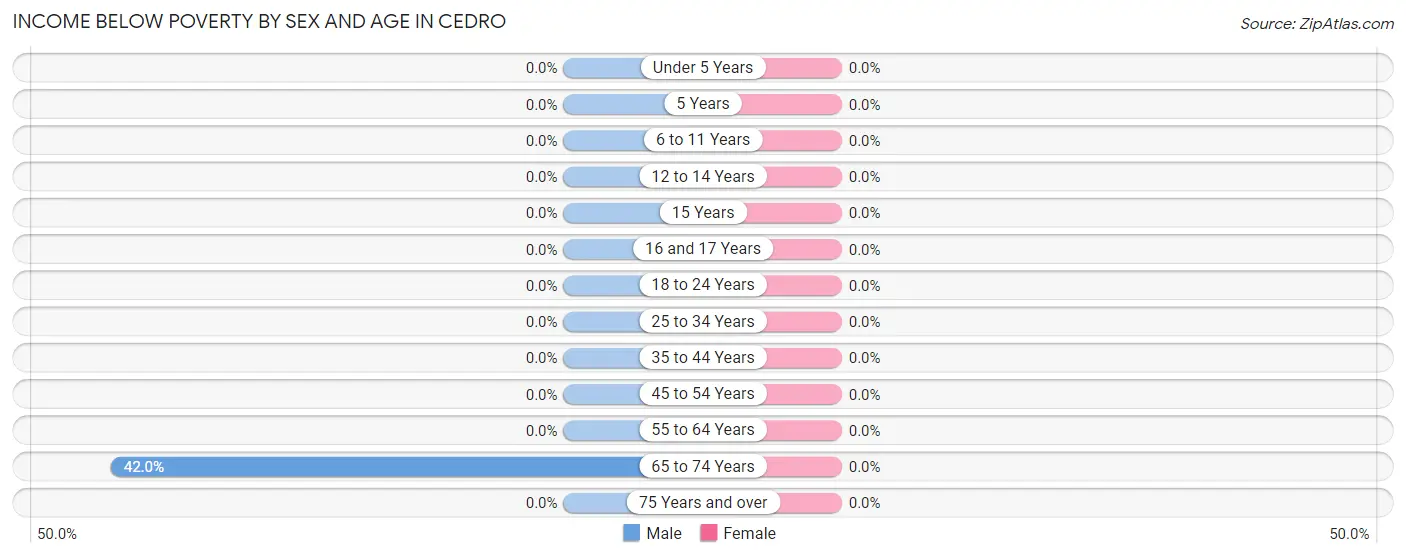
| Age Bracket | Male | Female |
| Under 5 Years | 0 (0.0%) | 0 (0.0%) |
| 5 Years | 0 (0.0%) | 0 (0.0%) |
| 6 to 11 Years | 0 (0.0%) | 0 (0.0%) |
| 12 to 14 Years | 0 (0.0%) | 0 (0.0%) |
| 15 Years | 0 (0.0%) | 0 (0.0%) |
| 16 and 17 Years | 0 (0.0%) | 0 (0.0%) |
| 18 to 24 Years | 0 (0.0%) | 0 (0.0%) |
| 25 to 34 Years | 0 (0.0%) | 0 (0.0%) |
| 35 to 44 Years | 0 (0.0%) | 0 (0.0%) |
| 45 to 54 Years | 0 (0.0%) | 0 (0.0%) |
| 55 to 64 Years | 0 (0.0%) | 0 (0.0%) |
| 65 to 74 Years | 21 (42.0%) | 0 (0.0%) |
| 75 Years and over | 0 (0.0%) | 0 (0.0%) |
| Total | 21 (6.2%) | 0 (0.0%) |
Income Above Poverty by Sex and Age in Cedro
According to the poverty statistics in Cedro, males aged under 5 years and females aged 12 to 14 years are the age groups that are most secure financially, with 100.0% of males and 100.0% of females in these age groups living above the poverty line.
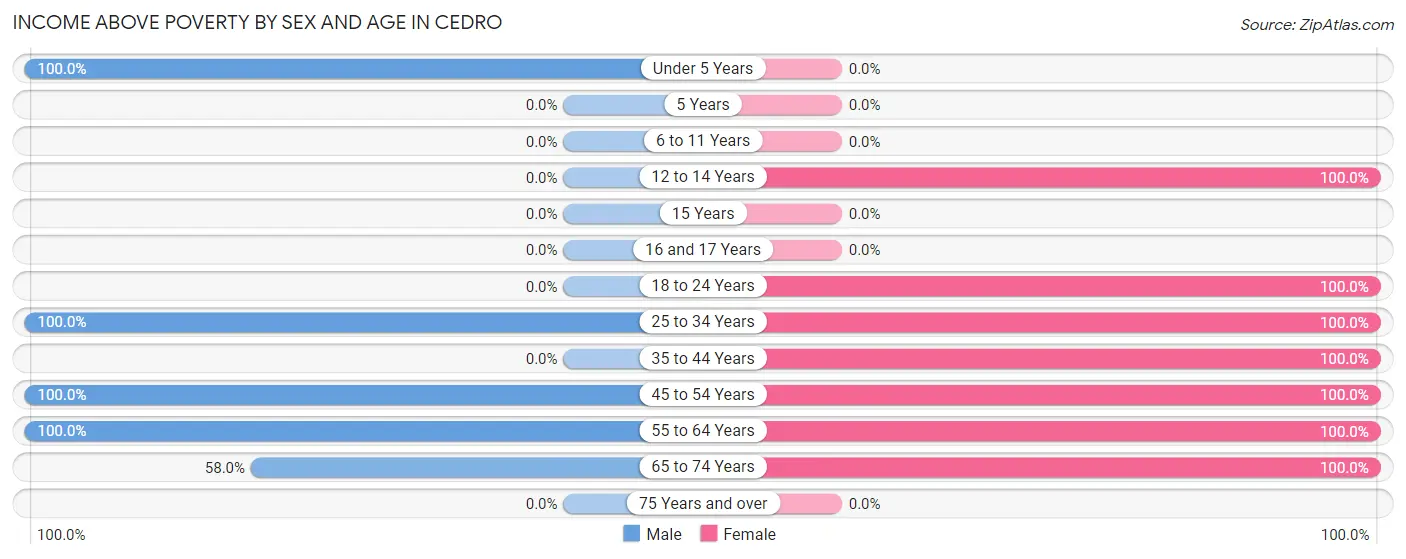
| Age Bracket | Male | Female |
| Under 5 Years | 84 (100.0%) | 0 (0.0%) |
| 5 Years | 0 (0.0%) | 0 (0.0%) |
| 6 to 11 Years | 0 (0.0%) | 0 (0.0%) |
| 12 to 14 Years | 0 (0.0%) | 51 (100.0%) |
| 15 Years | 0 (0.0%) | 0 (0.0%) |
| 16 and 17 Years | 0 (0.0%) | 0 (0.0%) |
| 18 to 24 Years | 0 (0.0%) | 10 (100.0%) |
| 25 to 34 Years | 77 (100.0%) | 62 (100.0%) |
| 35 to 44 Years | 0 (0.0%) | 18 (100.0%) |
| 45 to 54 Years | 99 (100.0%) | 35 (100.0%) |
| 55 to 64 Years | 31 (100.0%) | 45 (100.0%) |
| 65 to 74 Years | 29 (58.0%) | 15 (100.0%) |
| 75 Years and over | 0 (0.0%) | 0 (0.0%) |
| Total | 320 (93.8%) | 236 (100.0%) |
Income Below Poverty Among Married-Couple Families in Cedro
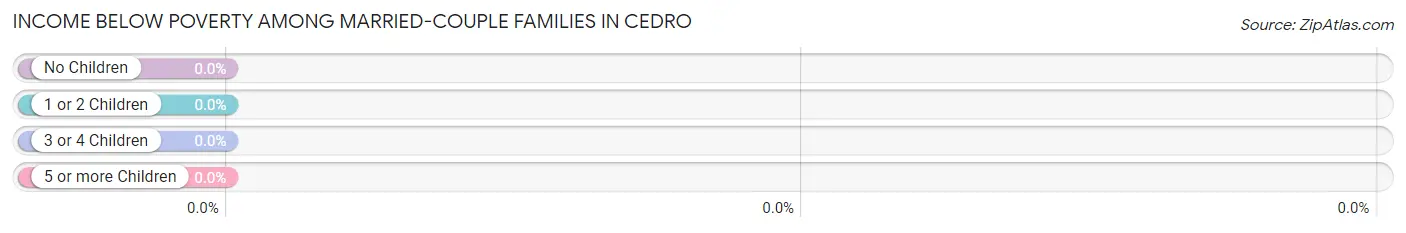
| Children | Above Poverty | Below Poverty |
| No Children | 114 (100.0%) | 0 (0.0%) |
| 1 or 2 Children | 62 (100.0%) | 0 (0.0%) |
| 3 or 4 Children | 0 (0.0%) | 0 (0.0%) |
| 5 or more Children | 0 (0.0%) | 0 (0.0%) |
| Total | 176 (100.0%) | 0 (0.0%) |
Income Below Poverty Among Single-Parent Households in Cedro
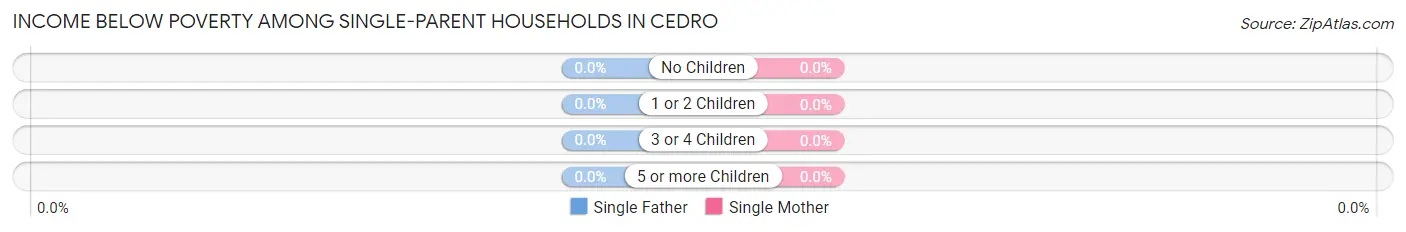
| Children | Single Father | Single Mother |
| No Children | 0 (0.0%) | 0 (0.0%) |
| 1 or 2 Children | 0 (0.0%) | 0 (0.0%) |
| 3 or 4 Children | 0 (0.0%) | 0 (0.0%) |
| 5 or more Children | 0 (0.0%) | 0 (0.0%) |
| Total | 0 (0.0%) | 0 (0.0%) |
Income Below Poverty Among Married-Couple vs Single-Parent Households in Cedro
| Children | Married-Couple Families | Single-Parent Households |
| No Children | 0 (0.0%) | 0 (0.0%) |
| 1 or 2 Children | 0 (0.0%) | 0 (0.0%) |
| 3 or 4 Children | 0 (0.0%) | 0 (0.0%) |
| 5 or more Children | 0 (0.0%) | 0 (0.0%) |
| Total | 0 (0.0%) | 0 (0.0%) |
Employment Characteristics in Cedro
Employment by Class of Employer in Cedro
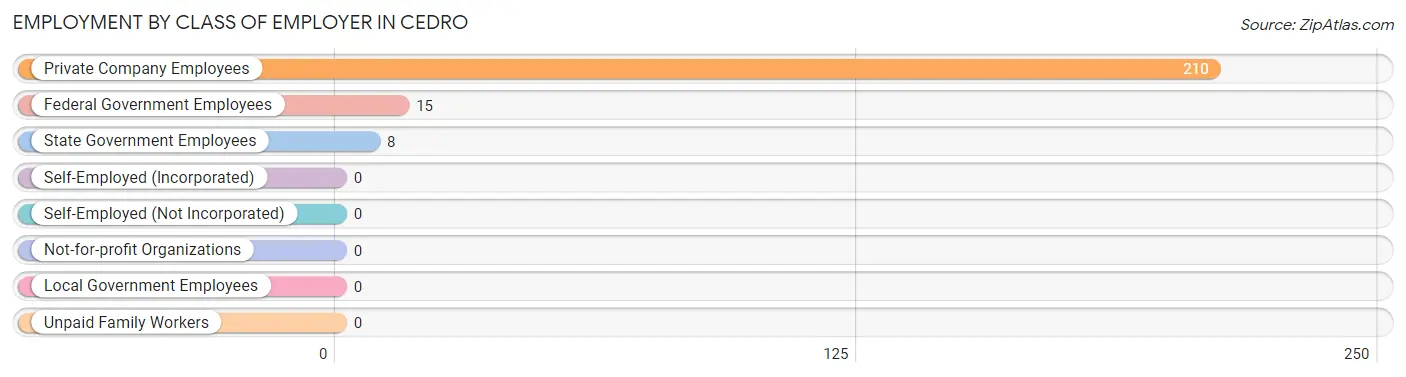
Among the 233 employed individuals in Cedro, private company employees (210 | 90.1%), federal government employees (15 | 6.4%), and state government employees (8 | 3.4%) make up the most common classes of employment.
| Employer Class | # Employees | % Employees |
| Private Company Employees | 210 | 90.1% |
| Self-Employed (Incorporated) | 0 | 0.0% |
| Self-Employed (Not Incorporated) | 0 | 0.0% |
| Not-for-profit Organizations | 0 | 0.0% |
| Local Government Employees | 0 | 0.0% |
| State Government Employees | 8 | 3.4% |
| Federal Government Employees | 15 | 6.4% |
| Unpaid Family Workers | 0 | 0.0% |
| Total | 233 | 100.0% |
Employment Status by Age in Cedro
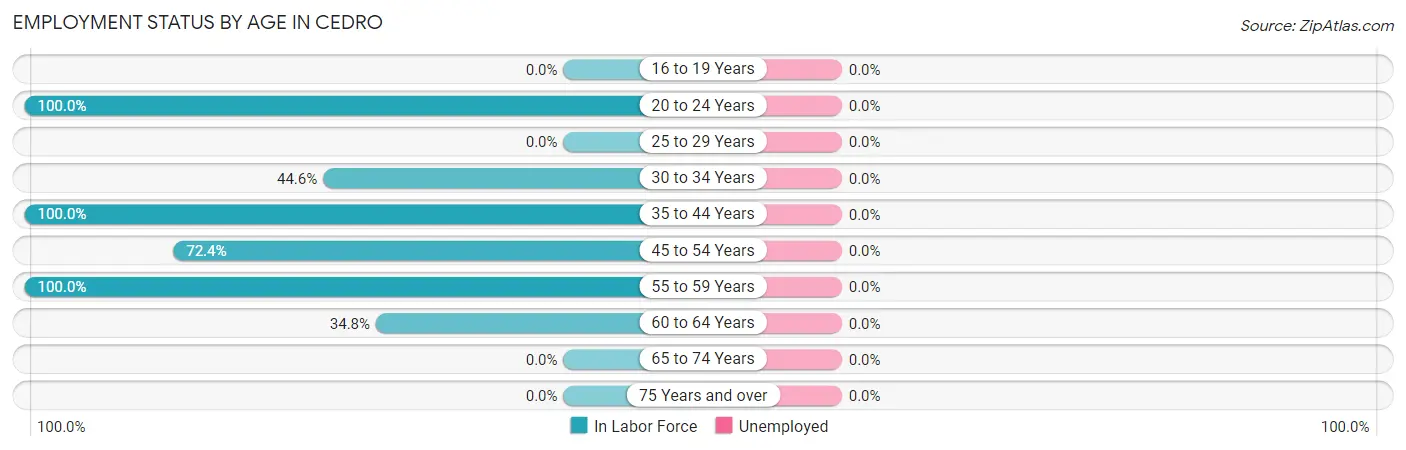
| Age Bracket | In Labor Force | Unemployed |
| 16 to 19 Years | 0 (0.0%) | 0 (0.0%) |
| 20 to 24 Years | 10 (100.0%) | 0 (0.0%) |
| 25 to 29 Years | 0 (0.0%) | 0 (0.0%) |
| 30 to 34 Years | 62 (44.6%) | 0 (0.0%) |
| 35 to 44 Years | 18 (100.0%) | 0 (0.0%) |
| 45 to 54 Years | 97 (72.4%) | 0 (0.0%) |
| 55 to 59 Years | 30 (100.0%) | 0 (0.0%) |
| 60 to 64 Years | 16 (34.8%) | 0 (0.0%) |
| 65 to 74 Years | 0 (0.0%) | 0 (0.0%) |
| 75 Years and over | 0 (0.0%) | 0 (0.0%) |
| Total | 233 (52.7%) | 0 (0.0%) |
Employment Status by Educational Attainment in Cedro
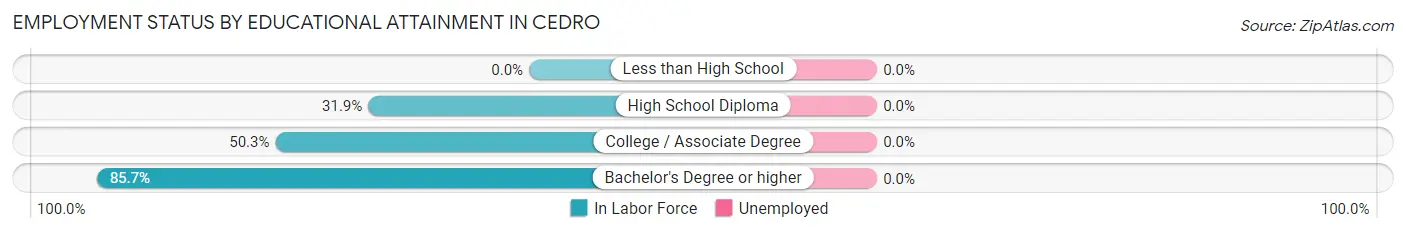
| Educational Attainment | In Labor Force | Unemployed |
| Less than High School | 0 (0.0%) | 0 (0.0%) |
| High School Diploma | 15 (31.9%) | 0 (0.0%) |
| College / Associate Degree | 94 (50.3%) | 0 (0.0%) |
| Bachelor's Degree or higher | 114 (85.7%) | 0 (0.0%) |
| Total | 223 (60.8%) | 0 (0.0%) |
Employment Occupations by Sex in Cedro
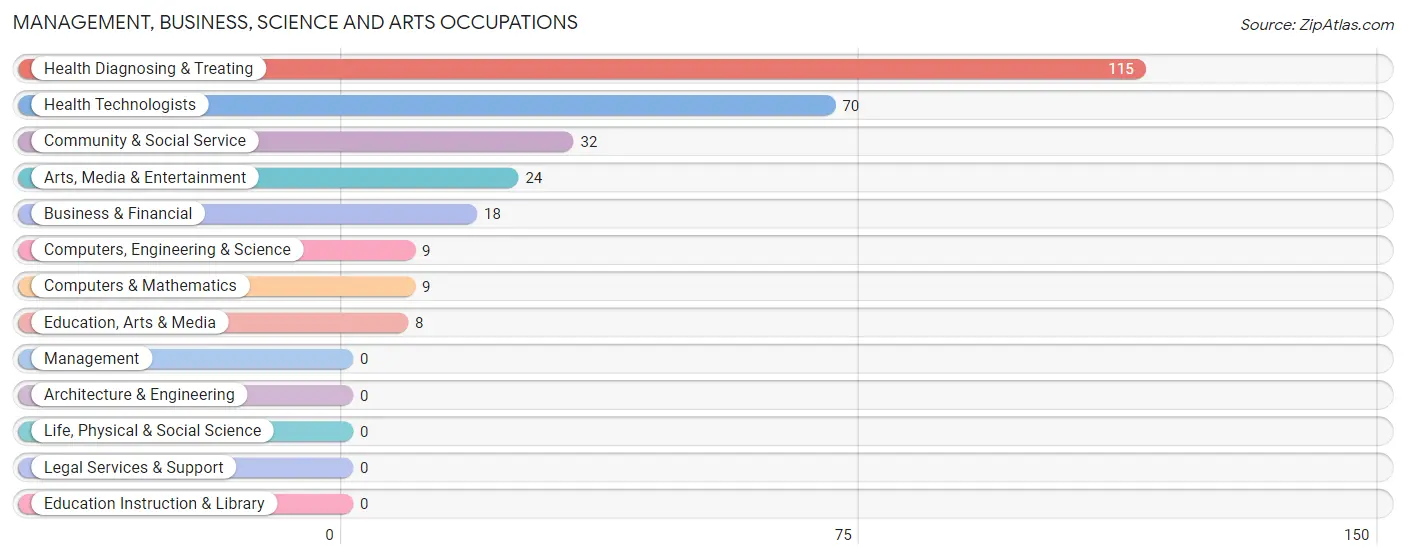
Management, Business, Science and Arts Occupations
The most common Management, Business, Science and Arts occupations in Cedro are Health Diagnosing & Treating (115 | 49.4%), Health Technologists (70 | 30.0%), Community & Social Service (32 | 13.7%), Arts, Media & Entertainment (24 | 10.3%), and Business & Financial (18 | 7.7%).
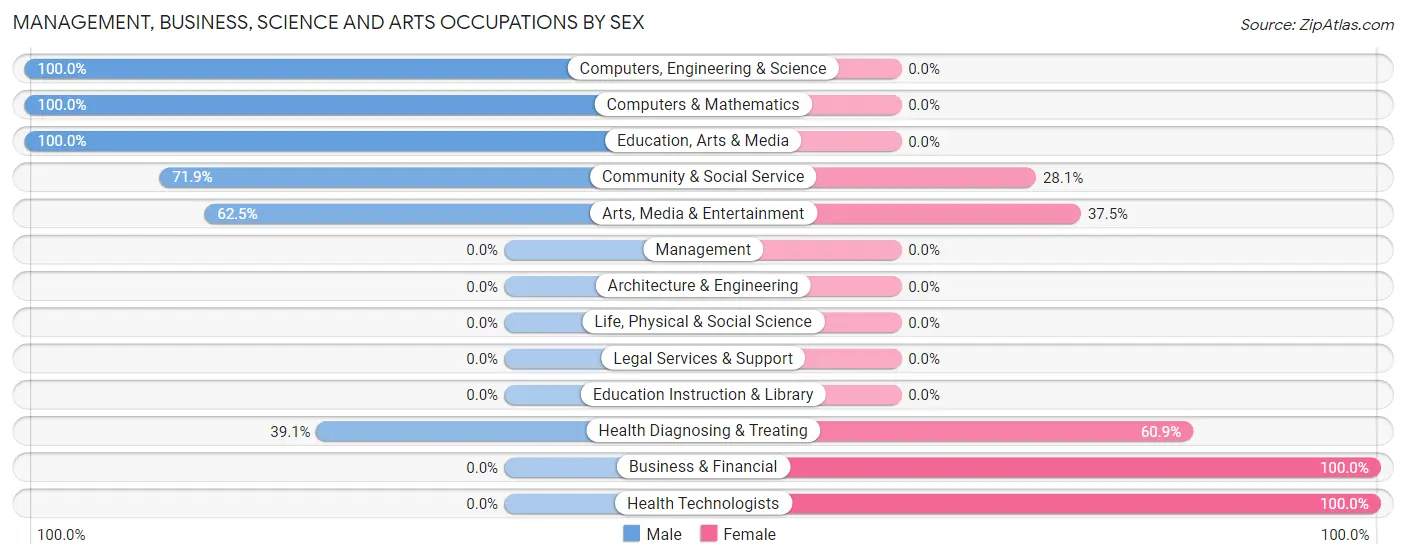
Management, Business, Science and Arts Occupations by Sex
Within the Management, Business, Science and Arts occupations in Cedro, the most male-oriented occupations are Computers, Engineering & Science (100.0%), Computers & Mathematics (100.0%), and Education, Arts & Media (100.0%), while the most female-oriented occupations are Business & Financial (100.0%), Health Technologists (100.0%), and Health Diagnosing & Treating (60.9%).
| Occupation | Male | Female |
| Management | 0 (0.0%) | 0 (0.0%) |
| Business & Financial | 0 (0.0%) | 18 (100.0%) |
| Computers, Engineering & Science | 9 (100.0%) | 0 (0.0%) |
| Computers & Mathematics | 9 (100.0%) | 0 (0.0%) |
| Architecture & Engineering | 0 (0.0%) | 0 (0.0%) |
| Life, Physical & Social Science | 0 (0.0%) | 0 (0.0%) |
| Community & Social Service | 23 (71.9%) | 9 (28.1%) |
| Education, Arts & Media | 8 (100.0%) | 0 (0.0%) |
| Legal Services & Support | 0 (0.0%) | 0 (0.0%) |
| Education Instruction & Library | 0 (0.0%) | 0 (0.0%) |
| Arts, Media & Entertainment | 15 (62.5%) | 9 (37.5%) |
| Health Diagnosing & Treating | 45 (39.1%) | 70 (60.9%) |
| Health Technologists | 0 (0.0%) | 70 (100.0%) |
| Total (Category) | 77 (44.3%) | 97 (55.7%) |
| Total (Overall) | 77 (33.1%) | 156 (66.9%) |
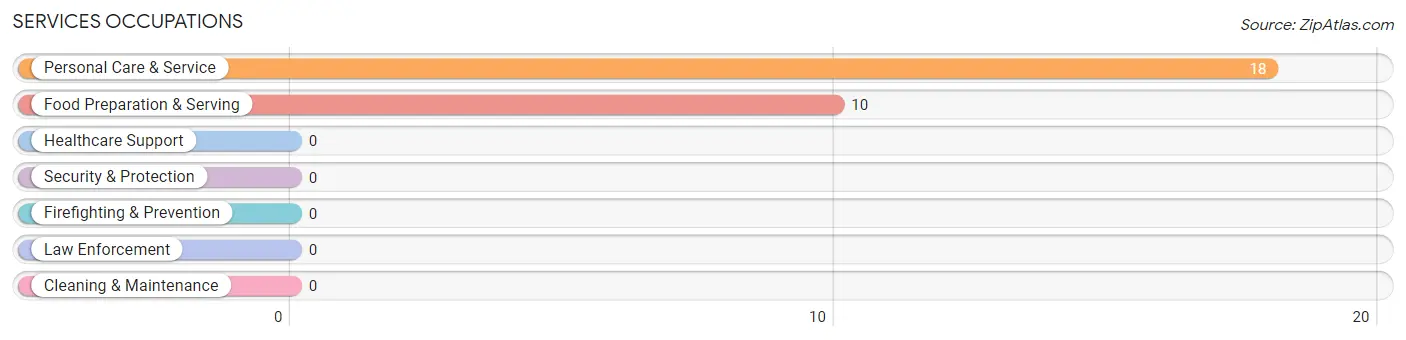
Services Occupations
The most common Services occupations in Cedro are Personal Care & Service (18 | 7.7%), and Food Preparation & Serving (10 | 4.3%).
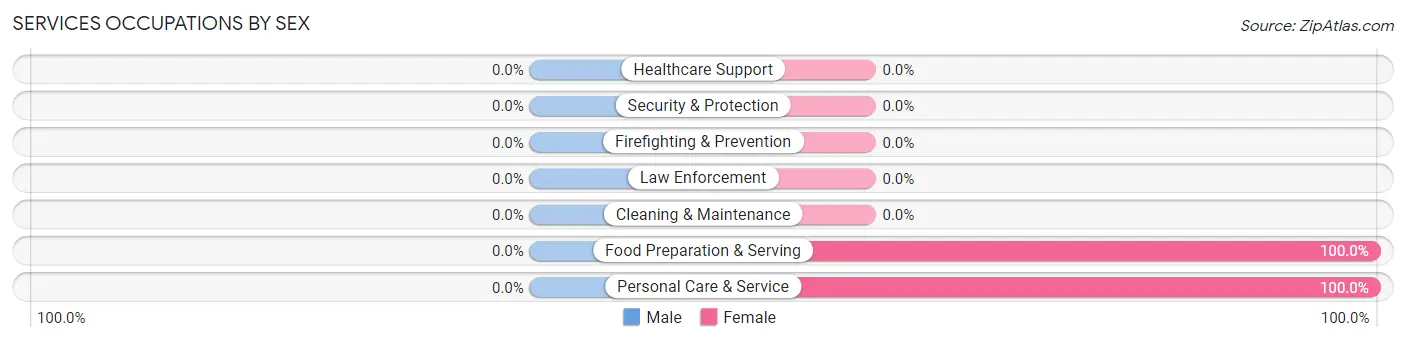
Services Occupations by Sex
| Occupation | Male | Female |
| Healthcare Support | 0 (0.0%) | 0 (0.0%) |
| Security & Protection | 0 (0.0%) | 0 (0.0%) |
| Firefighting & Prevention | 0 (0.0%) | 0 (0.0%) |
| Law Enforcement | 0 (0.0%) | 0 (0.0%) |
| Food Preparation & Serving | 0 (0.0%) | 10 (100.0%) |
| Cleaning & Maintenance | 0 (0.0%) | 0 (0.0%) |
| Personal Care & Service | 0 (0.0%) | 18 (100.0%) |
| Total (Category) | 0 (0.0%) | 28 (100.0%) |
| Total (Overall) | 77 (33.1%) | 156 (66.9%) |
Sales and Office Occupations
The most common Sales and Office occupations in Cedro are , and Sales & Related (31 | 13.3%).
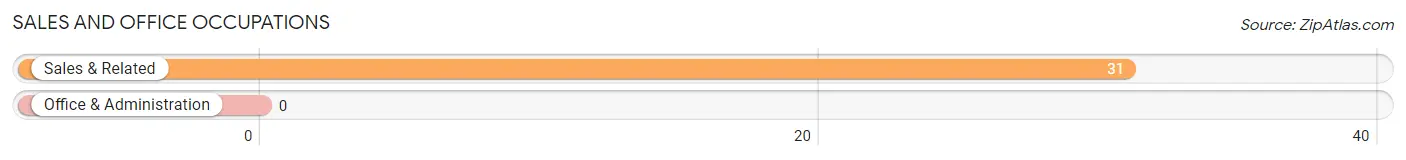
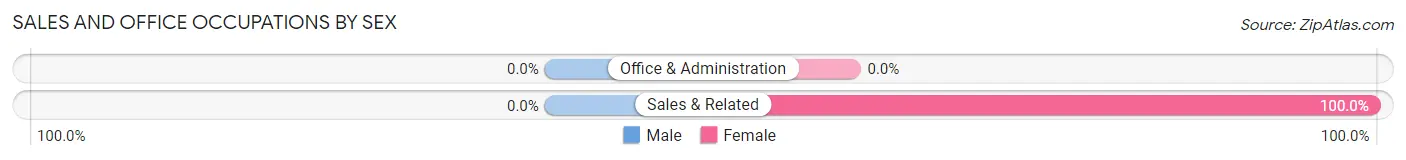
Sales and Office Occupations by Sex
| Occupation | Male | Female |
| Sales & Related | 0 (0.0%) | 31 (100.0%) |
| Office & Administration | 0 (0.0%) | 0 (0.0%) |
| Total (Category) | 0 (0.0%) | 31 (100.0%) |
| Total (Overall) | 77 (33.1%) | 156 (66.9%) |
Natural Resources, Construction and Maintenance Occupations
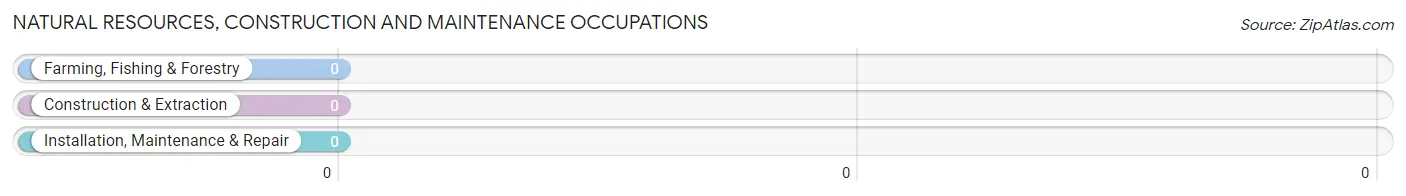
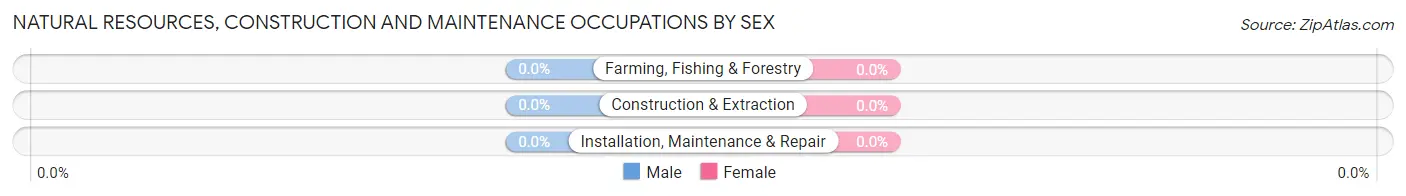
Natural Resources, Construction and Maintenance Occupations by Sex
| Occupation | Male | Female |
| Farming, Fishing & Forestry | 0 (0.0%) | 0 (0.0%) |
| Construction & Extraction | 0 (0.0%) | 0 (0.0%) |
| Installation, Maintenance & Repair | 0 (0.0%) | 0 (0.0%) |
| Total (Category) | 0 (0.0%) | 0 (0.0%) |
| Total (Overall) | 77 (33.1%) | 156 (66.9%) |
Production, Transportation and Moving Occupations
Production, Transportation and Moving Occupations by Sex
| Occupation | Male | Female |
| Production | 0 (0.0%) | 0 (0.0%) |
| Transportation | 0 (0.0%) | 0 (0.0%) |
| Material Moving | 0 (0.0%) | 0 (0.0%) |
| Total (Category) | 0 (0.0%) | 0 (0.0%) |
| Total (Overall) | 77 (33.1%) | 156 (66.9%) |
Employment Industries by Sex in Cedro
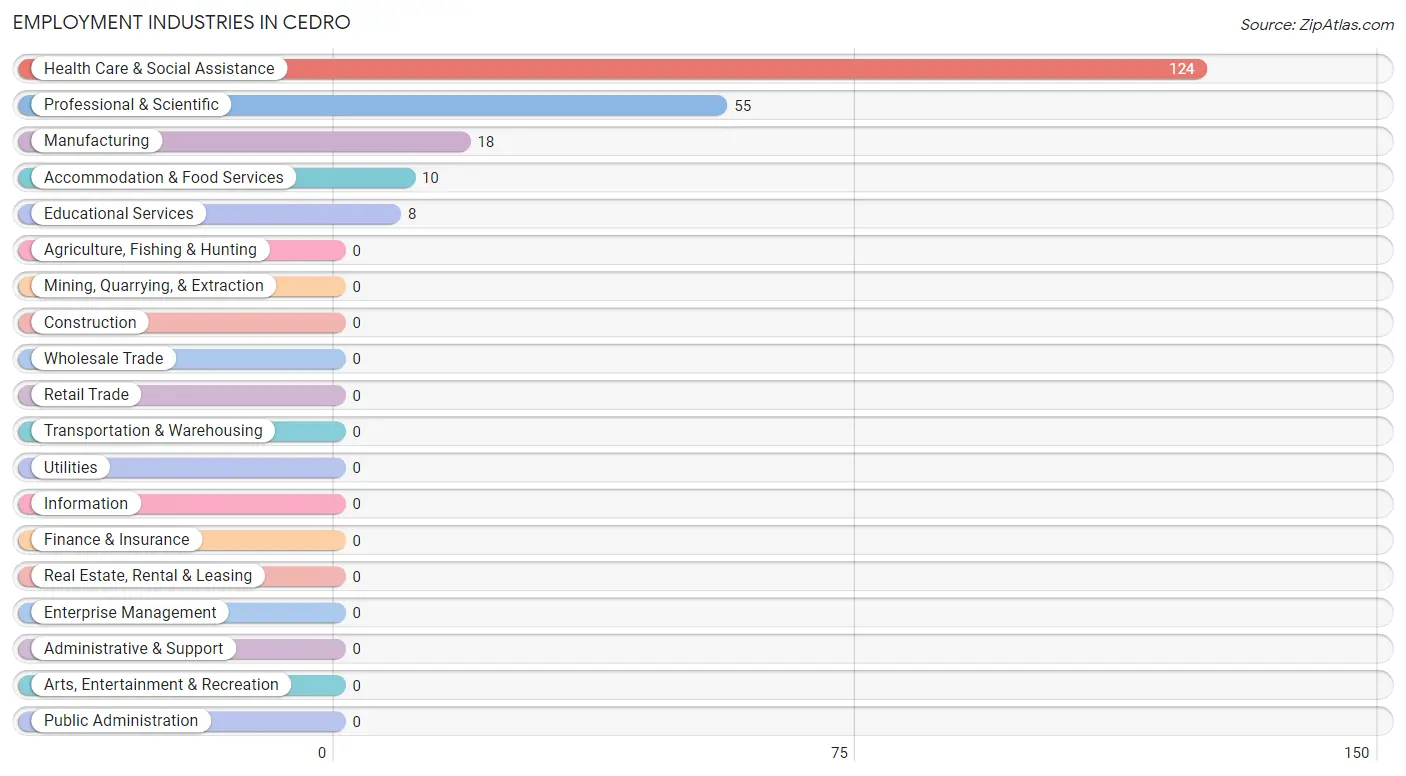
Employment Industries in Cedro
The major employment industries in Cedro include Health Care & Social Assistance (124 | 53.2%), Professional & Scientific (55 | 23.6%), Manufacturing (18 | 7.7%), Accommodation & Food Services (10 | 4.3%), and Educational Services (8 | 3.4%).
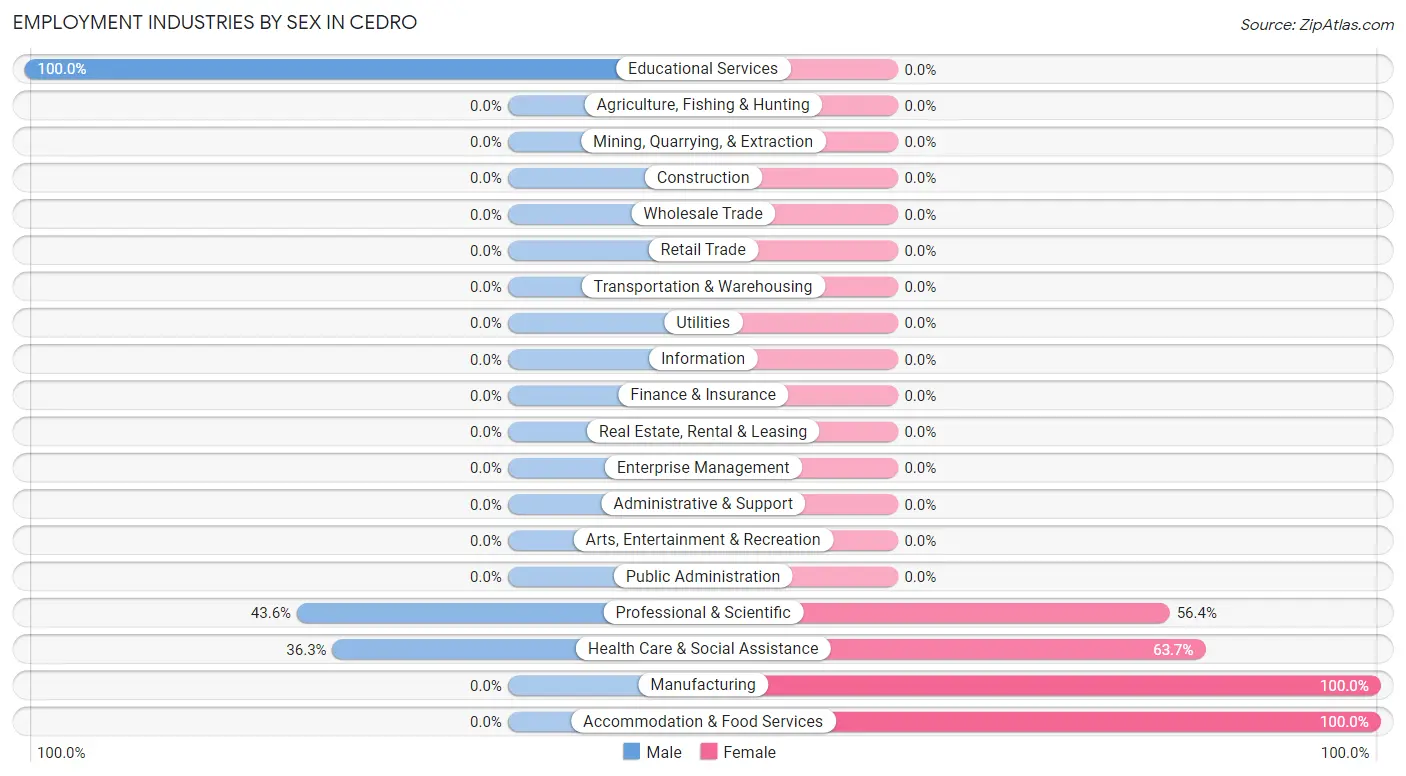
Employment Industries by Sex in Cedro
The Cedro industries that see more men than women are Educational Services (100.0%), Professional & Scientific (43.6%), and Health Care & Social Assistance (36.3%), whereas the industries that tend to have a higher number of women are Manufacturing (100.0%), Accommodation & Food Services (100.0%), and Health Care & Social Assistance (63.7%).
| Industry | Male | Female |
| Agriculture, Fishing & Hunting | 0 (0.0%) | 0 (0.0%) |
| Mining, Quarrying, & Extraction | 0 (0.0%) | 0 (0.0%) |
| Construction | 0 (0.0%) | 0 (0.0%) |
| Manufacturing | 0 (0.0%) | 18 (100.0%) |
| Wholesale Trade | 0 (0.0%) | 0 (0.0%) |
| Retail Trade | 0 (0.0%) | 0 (0.0%) |
| Transportation & Warehousing | 0 (0.0%) | 0 (0.0%) |
| Utilities | 0 (0.0%) | 0 (0.0%) |
| Information | 0 (0.0%) | 0 (0.0%) |
| Finance & Insurance | 0 (0.0%) | 0 (0.0%) |
| Real Estate, Rental & Leasing | 0 (0.0%) | 0 (0.0%) |
| Professional & Scientific | 24 (43.6%) | 31 (56.4%) |
| Enterprise Management | 0 (0.0%) | 0 (0.0%) |
| Administrative & Support | 0 (0.0%) | 0 (0.0%) |
| Educational Services | 8 (100.0%) | 0 (0.0%) |
| Health Care & Social Assistance | 45 (36.3%) | 79 (63.7%) |
| Arts, Entertainment & Recreation | 0 (0.0%) | 0 (0.0%) |
| Accommodation & Food Services | 0 (0.0%) | 10 (100.0%) |
| Public Administration | 0 (0.0%) | 0 (0.0%) |
| Total | 77 (33.1%) | 156 (66.9%) |
Education in Cedro
School Enrollment in Cedro
The most common levels of schooling among the 232 students in Cedro are college / undergraduate (77 | 33.2%), graduate / professional (62 | 26.7%), and middle school (51 | 22.0%).
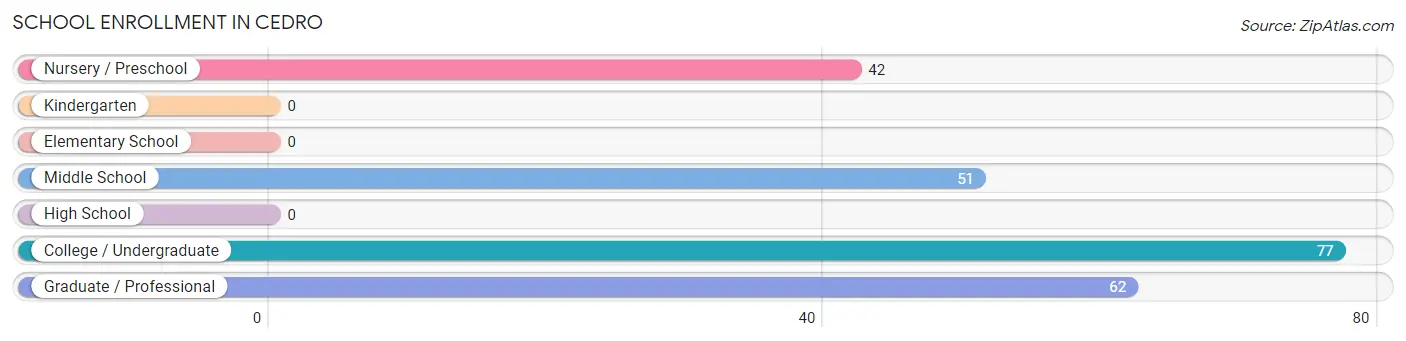
| School Level | # Students | % Students |
| Nursery / Preschool | 42 | 18.1% |
| Kindergarten | 0 | 0.0% |
| Elementary School | 0 | 0.0% |
| Middle School | 51 | 22.0% |
| High School | 0 | 0.0% |
| College / Undergraduate | 77 | 33.2% |
| Graduate / Professional | 62 | 26.7% |
| Total | 232 | 100.0% |
School Enrollment by Age by Funding Source in Cedro
Out of a total of 232 students who are enrolled in schools in Cedro, 181 (78.0%) attend a private institution, while the remaining 51 (22.0%) are enrolled in public schools. The age group of 3 to 4 year olds has the highest likelihood of being enrolled in private schools, with 42 (100.0% in the age bracket) enrolled. Conversely, the age group of 10 to 14 year olds has the lowest likelihood of being enrolled in a private school, with 51 (100.0% in the age bracket) attending a public institution.
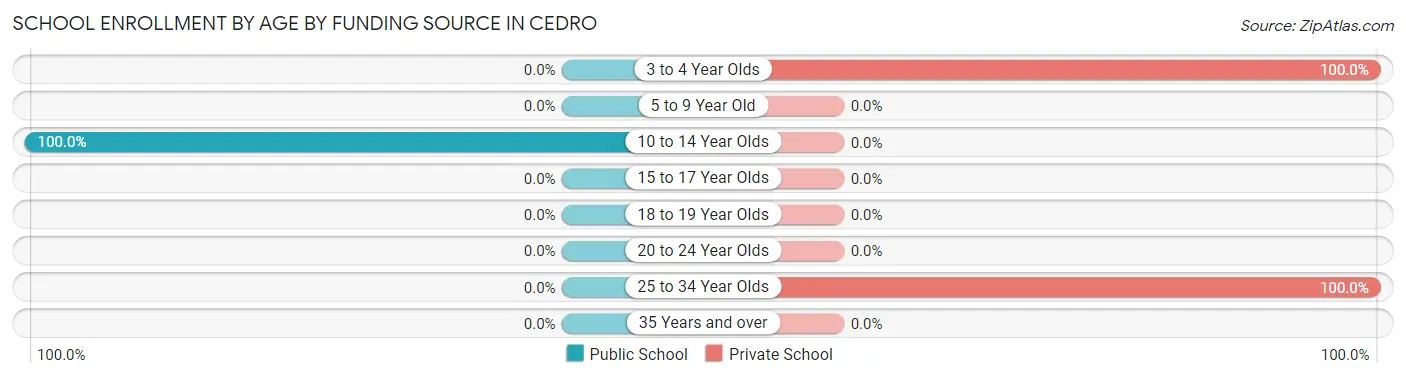
| Age Bracket | Public School | Private School |
| 3 to 4 Year Olds | 0 (0.0%) | 42 (100.0%) |
| 5 to 9 Year Old | 0 (0.0%) | 0 (0.0%) |
| 10 to 14 Year Olds | 51 (100.0%) | 0 (0.0%) |
| 15 to 17 Year Olds | 0 (0.0%) | 0 (0.0%) |
| 18 to 19 Year Olds | 0 (0.0%) | 0 (0.0%) |
| 20 to 24 Year Olds | 0 (0.0%) | 0 (0.0%) |
| 25 to 34 Year Olds | 0 (0.0%) | 139 (100.0%) |
| 35 Years and over | 0 (0.0%) | 0 (0.0%) |
| Total | 51 (22.0%) | 181 (78.0%) |
Educational Attainment by Field of Study in Cedro
Liberal arts & history (71 | 46.1%), business (47 | 30.5%), physical & health sciences (19 | 12.3%), literature & languages (9 | 5.8%), and bio, nature & agricultural (8 | 5.2%) are the most common fields of study among 154 individuals in Cedro who have obtained a bachelor's degree or higher.
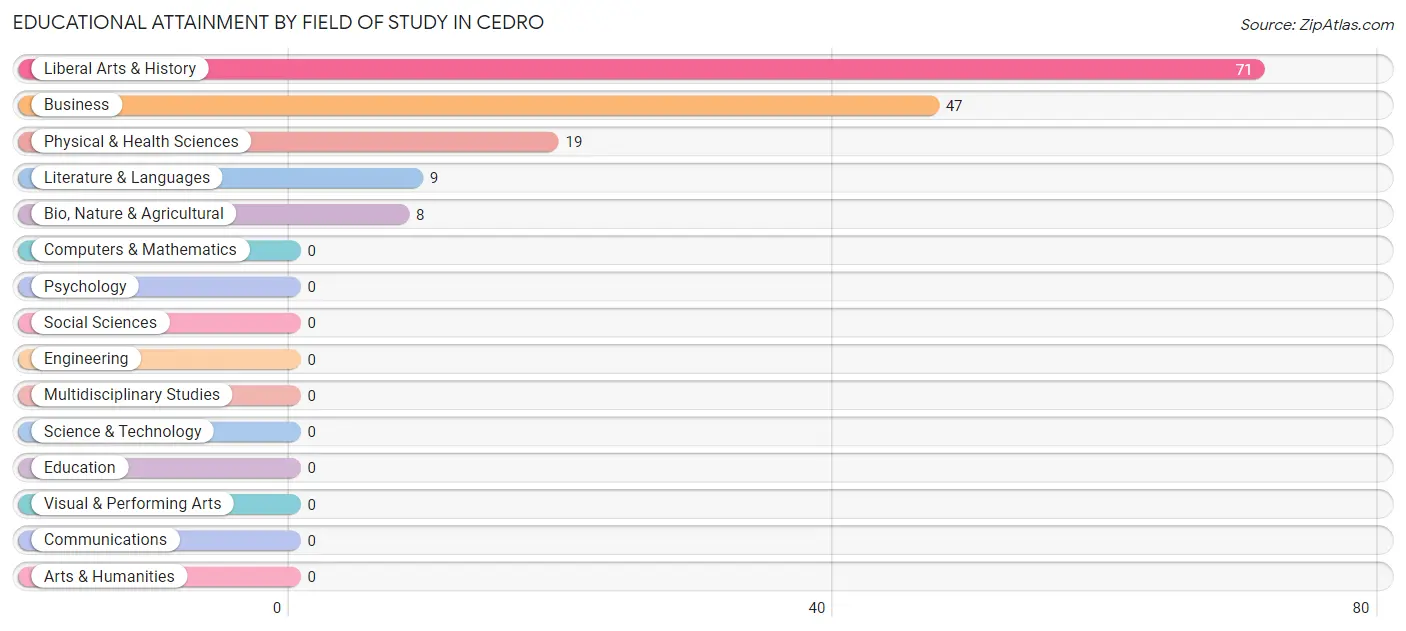
| Field of Study | # Graduates | % Graduates |
| Computers & Mathematics | 0 | 0.0% |
| Bio, Nature & Agricultural | 8 | 5.2% |
| Physical & Health Sciences | 19 | 12.3% |
| Psychology | 0 | 0.0% |
| Social Sciences | 0 | 0.0% |
| Engineering | 0 | 0.0% |
| Multidisciplinary Studies | 0 | 0.0% |
| Science & Technology | 0 | 0.0% |
| Business | 47 | 30.5% |
| Education | 0 | 0.0% |
| Literature & Languages | 9 | 5.8% |
| Liberal Arts & History | 71 | 46.1% |
| Visual & Performing Arts | 0 | 0.0% |
| Communications | 0 | 0.0% |
| Arts & Humanities | 0 | 0.0% |
| Total | 154 | 100.0% |
Transportation & Commute in Cedro
Vehicle Availability by Sex in Cedro
The most prevalent vehicle ownership categories in Cedro are males with 1 vehicle (45, accounting for 58.4%) and females with 1 vehicle (0, making up 28.8%).
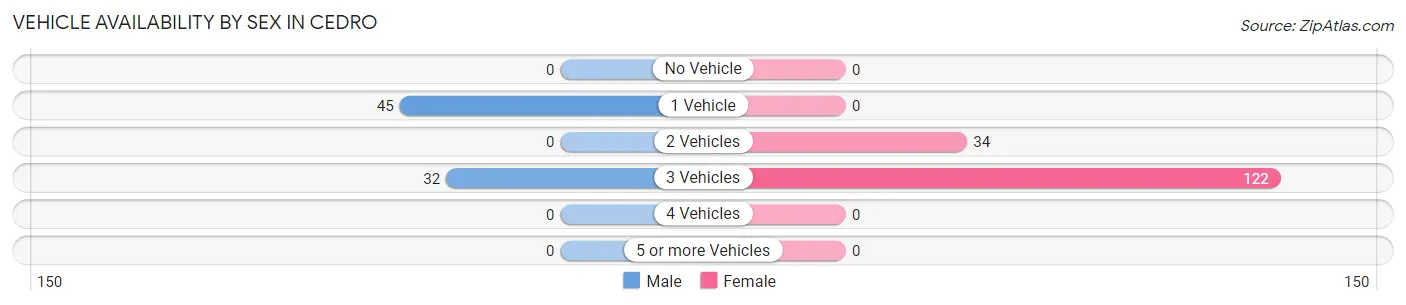
| Vehicles Available | Male | Female |
| No Vehicle | 0 (0.0%) | 0 (0.0%) |
| 1 Vehicle | 45 (58.4%) | 0 (0.0%) |
| 2 Vehicles | 0 (0.0%) | 34 (21.8%) |
| 3 Vehicles | 32 (41.6%) | 122 (78.2%) |
| 4 Vehicles | 0 (0.0%) | 0 (0.0%) |
| 5 or more Vehicles | 0 (0.0%) | 0 (0.0%) |
| Total | 77 (100.0%) | 156 (100.0%) |
Commute Time in Cedro
The most frequently occuring commute durations in Cedro are 30 to 34 minutes (151 commuters, 72.6%), 45 to 59 minutes (18 commuters, 8.6%), and 25 to 29 minutes (15 commuters, 7.2%).
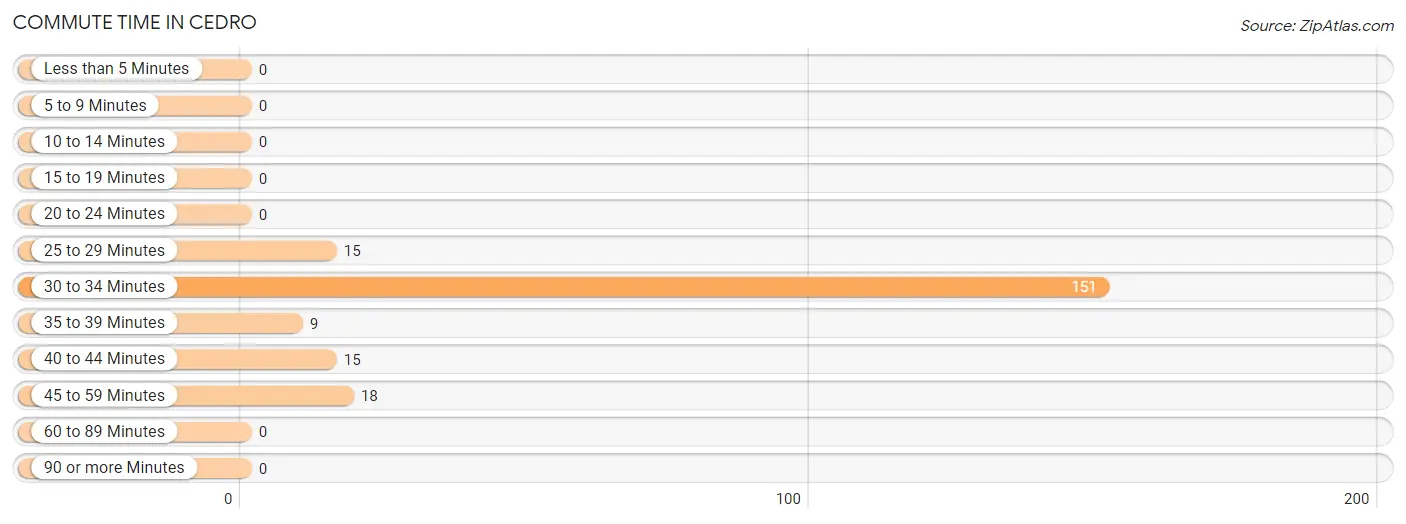
| Commute Time | # Commuters | % Commuters |
| Less than 5 Minutes | 0 | 0.0% |
| 5 to 9 Minutes | 0 | 0.0% |
| 10 to 14 Minutes | 0 | 0.0% |
| 15 to 19 Minutes | 0 | 0.0% |
| 20 to 24 Minutes | 0 | 0.0% |
| 25 to 29 Minutes | 15 | 7.2% |
| 30 to 34 Minutes | 151 | 72.6% |
| 35 to 39 Minutes | 9 | 4.3% |
| 40 to 44 Minutes | 15 | 7.2% |
| 45 to 59 Minutes | 18 | 8.6% |
| 60 to 89 Minutes | 0 | 0.0% |
| 90 or more Minutes | 0 | 0.0% |
Commute Time by Sex in Cedro
The most common commute times in Cedro are 30 to 34 minutes (53 commuters, 68.8%) for males and 30 to 34 minutes (98 commuters, 74.8%) for females.
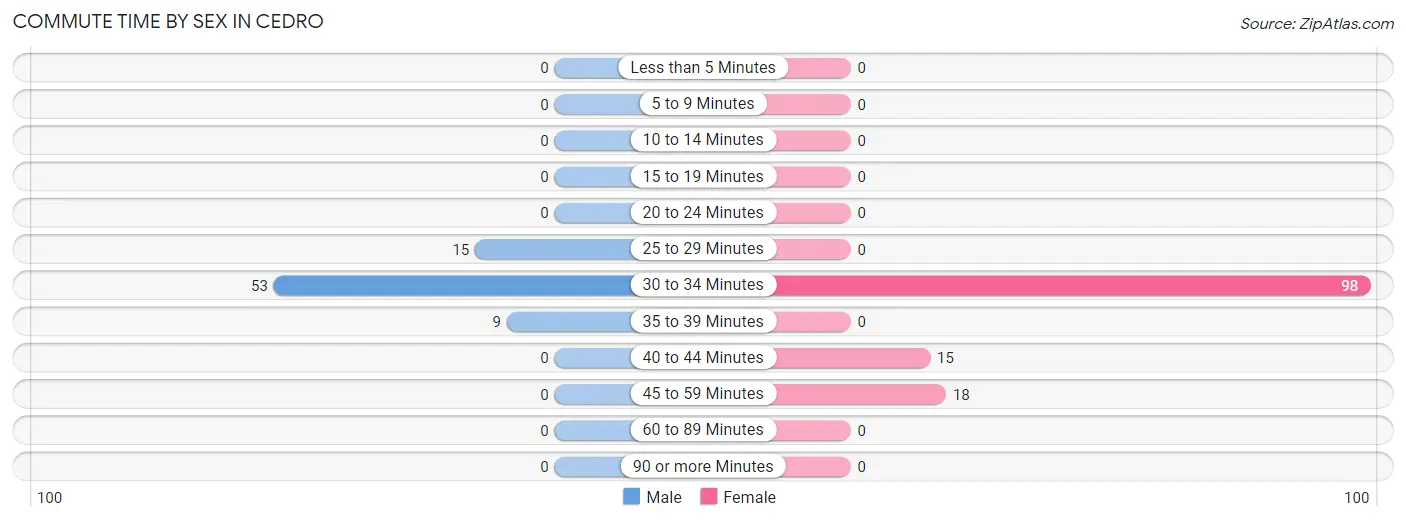
| Commute Time | Male | Female |
| Less than 5 Minutes | 0 (0.0%) | 0 (0.0%) |
| 5 to 9 Minutes | 0 (0.0%) | 0 (0.0%) |
| 10 to 14 Minutes | 0 (0.0%) | 0 (0.0%) |
| 15 to 19 Minutes | 0 (0.0%) | 0 (0.0%) |
| 20 to 24 Minutes | 0 (0.0%) | 0 (0.0%) |
| 25 to 29 Minutes | 15 (19.5%) | 0 (0.0%) |
| 30 to 34 Minutes | 53 (68.8%) | 98 (74.8%) |
| 35 to 39 Minutes | 9 (11.7%) | 0 (0.0%) |
| 40 to 44 Minutes | 0 (0.0%) | 15 (11.5%) |
| 45 to 59 Minutes | 0 (0.0%) | 18 (13.7%) |
| 60 to 89 Minutes | 0 (0.0%) | 0 (0.0%) |
| 90 or more Minutes | 0 (0.0%) | 0 (0.0%) |
Time of Departure to Work by Sex in Cedro
The most frequent times of departure to work in Cedro are 7:30 AM to 7:59 AM (45, 58.4%) for males and 7:00 AM to 7:29 AM (85, 64.9%) for females.

| Time of Departure | Male | Female |
| 12:00 AM to 4:59 AM | 0 (0.0%) | 0 (0.0%) |
| 5:00 AM to 5:29 AM | 0 (0.0%) | 0 (0.0%) |
| 5:30 AM to 5:59 AM | 0 (0.0%) | 0 (0.0%) |
| 6:00 AM to 6:29 AM | 0 (0.0%) | 0 (0.0%) |
| 6:30 AM to 6:59 AM | 15 (19.5%) | 18 (13.7%) |
| 7:00 AM to 7:29 AM | 8 (10.4%) | 85 (64.9%) |
| 7:30 AM to 7:59 AM | 45 (58.4%) | 0 (0.0%) |
| 8:00 AM to 8:29 AM | 9 (11.7%) | 0 (0.0%) |
| 8:30 AM to 8:59 AM | 0 (0.0%) | 0 (0.0%) |
| 9:00 AM to 9:59 AM | 0 (0.0%) | 0 (0.0%) |
| 10:00 AM to 10:59 AM | 0 (0.0%) | 18 (13.7%) |
| 11:00 AM to 11:59 AM | 0 (0.0%) | 0 (0.0%) |
| 12:00 PM to 3:59 PM | 0 (0.0%) | 0 (0.0%) |
| 4:00 PM to 11:59 PM | 0 (0.0%) | 10 (7.6%) |
| Total | 77 (100.0%) | 131 (100.0%) |
Housing Occupancy in Cedro
Occupancy by Ownership in Cedro
Of the total 242 dwellings in Cedro, owner-occupied units account for 171 (70.7%), while renter-occupied units make up 71 (29.3%).
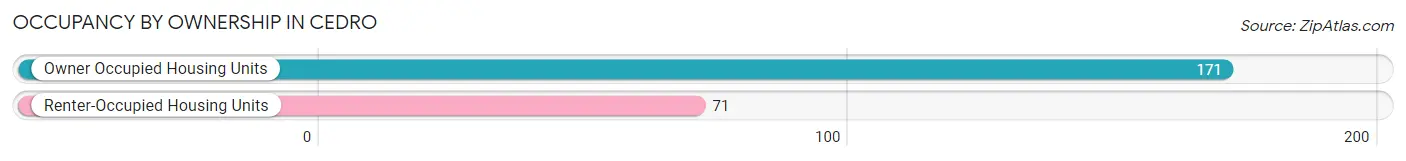
| Occupancy | # Housing Units | % Housing Units |
| Owner Occupied Housing Units | 171 | 70.7% |
| Renter-Occupied Housing Units | 71 | 29.3% |
| Total Occupied Housing Units | 242 | 100.0% |
Occupancy by Household Size in Cedro
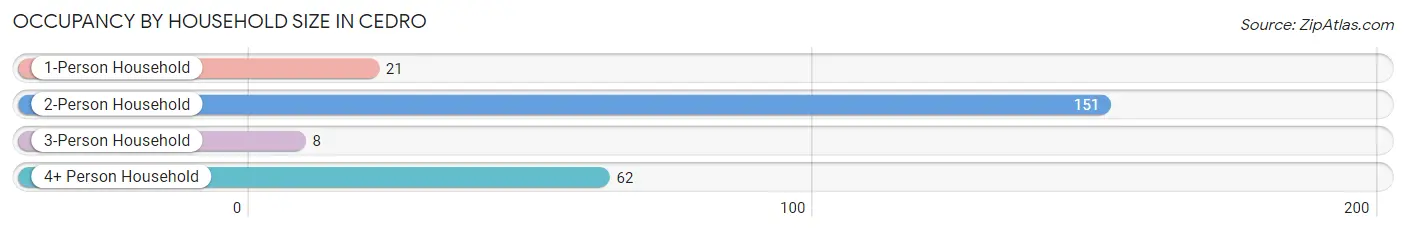
| Household Size | # Housing Units | % Housing Units |
| 1-Person Household | 21 | 8.7% |
| 2-Person Household | 151 | 62.4% |
| 3-Person Household | 8 | 3.3% |
| 4+ Person Household | 62 | 25.6% |
| Total Housing Units | 242 | 100.0% |
Occupancy by Ownership by Household Size in Cedro
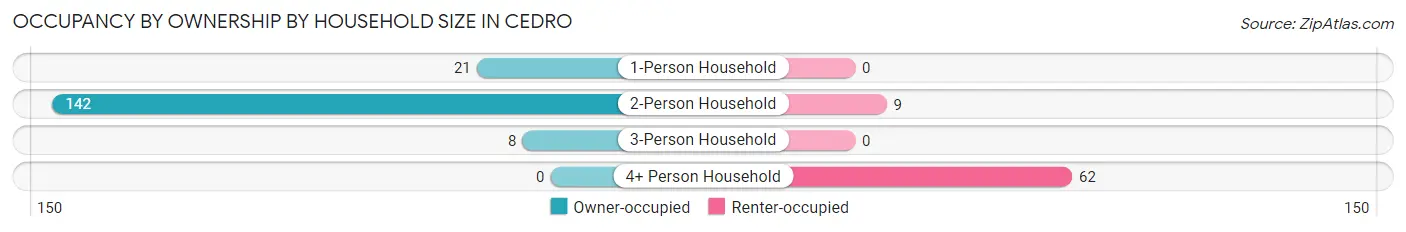
| Household Size | Owner-occupied | Renter-occupied |
| 1-Person Household | 21 (100.0%) | 0 (0.0%) |
| 2-Person Household | 142 (94.0%) | 9 (6.0%) |
| 3-Person Household | 8 (100.0%) | 0 (0.0%) |
| 4+ Person Household | 0 (0.0%) | 62 (100.0%) |
| Total Housing Units | 171 (70.7%) | 71 (29.3%) |
Occupancy by Educational Attainment in Cedro
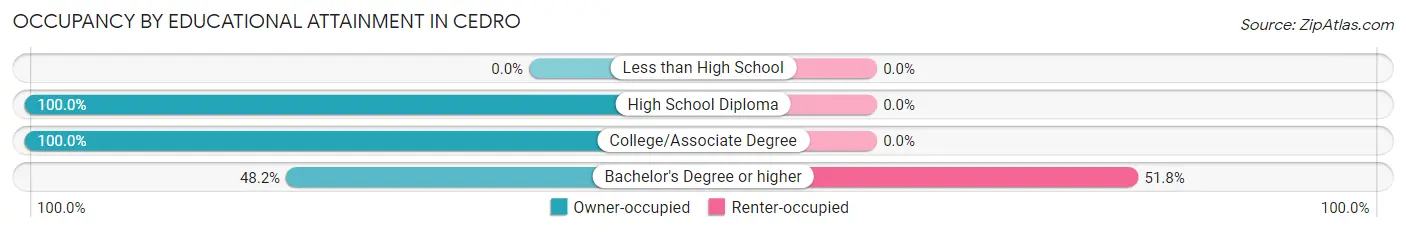
| Household Size | Owner-occupied | Renter-occupied |
| Less than High School | 0 (0.0%) | 0 (0.0%) |
| High School Diploma | 30 (100.0%) | 0 (0.0%) |
| College/Associate Degree | 75 (100.0%) | 0 (0.0%) |
| Bachelor's Degree or higher | 66 (48.2%) | 71 (51.8%) |
Occupancy by Age of Householder in Cedro
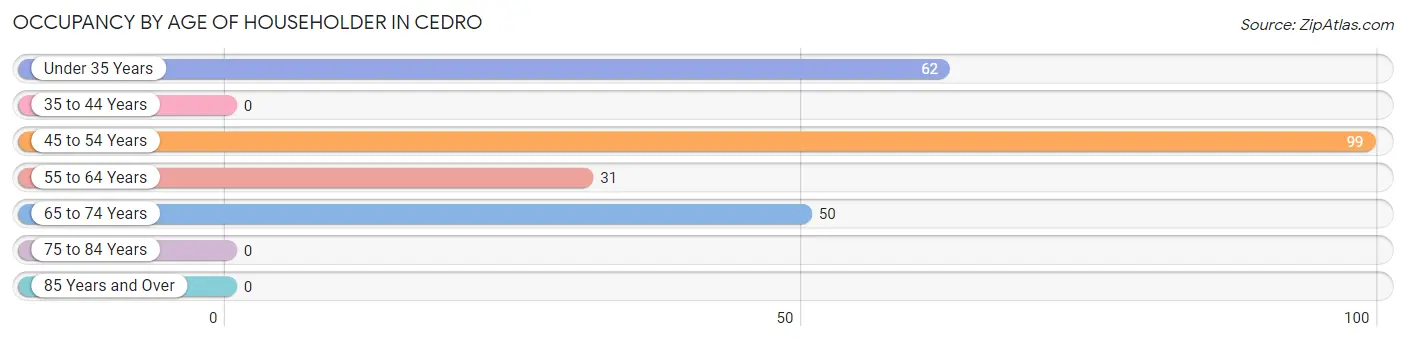
| Age Bracket | # Households | % Households |
| Under 35 Years | 62 | 25.6% |
| 35 to 44 Years | 0 | 0.0% |
| 45 to 54 Years | 99 | 40.9% |
| 55 to 64 Years | 31 | 12.8% |
| 65 to 74 Years | 50 | 20.7% |
| 75 to 84 Years | 0 | 0.0% |
| 85 Years and Over | 0 | 0.0% |
| Total | 242 | 100.0% |
Housing Finances in Cedro
Median Income by Occupancy in Cedro
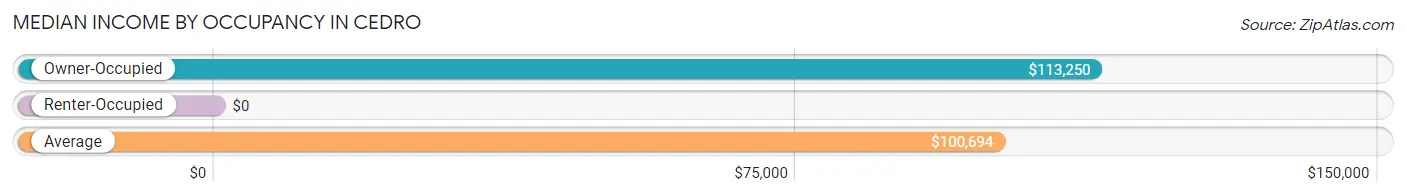
| Occupancy Type | # Households | Median Income |
| Owner-Occupied | 171 (70.7%) | $113,250 |
| Renter-Occupied | 71 (29.3%) | $0 |
| Average | 242 (100.0%) | $100,694 |
Occupancy by Householder Income Bracket in Cedro
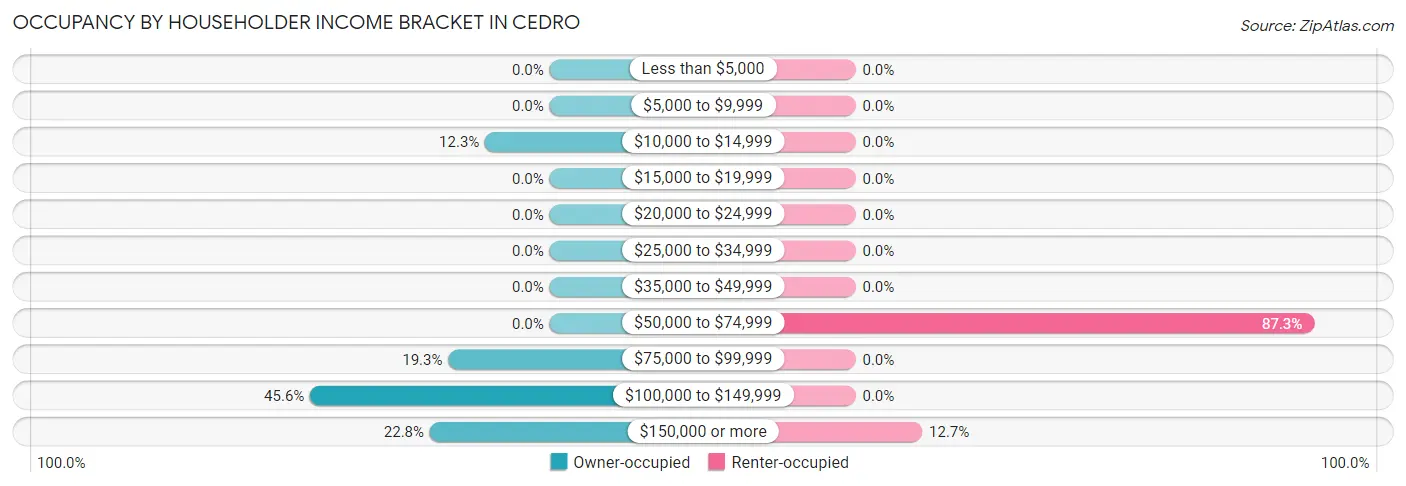
| Income Bracket | Owner-occupied | Renter-occupied |
| Less than $5,000 | 0 (0.0%) | 0 (0.0%) |
| $5,000 to $9,999 | 0 (0.0%) | 0 (0.0%) |
| $10,000 to $14,999 | 21 (12.3%) | 0 (0.0%) |
| $15,000 to $19,999 | 0 (0.0%) | 0 (0.0%) |
| $20,000 to $24,999 | 0 (0.0%) | 0 (0.0%) |
| $25,000 to $34,999 | 0 (0.0%) | 0 (0.0%) |
| $35,000 to $49,999 | 0 (0.0%) | 0 (0.0%) |
| $50,000 to $74,999 | 0 (0.0%) | 62 (87.3%) |
| $75,000 to $99,999 | 33 (19.3%) | 0 (0.0%) |
| $100,000 to $149,999 | 78 (45.6%) | 0 (0.0%) |
| $150,000 or more | 39 (22.8%) | 9 (12.7%) |
| Total | 171 (100.0%) | 71 (100.0%) |
Monthly Housing Cost Tiers in Cedro
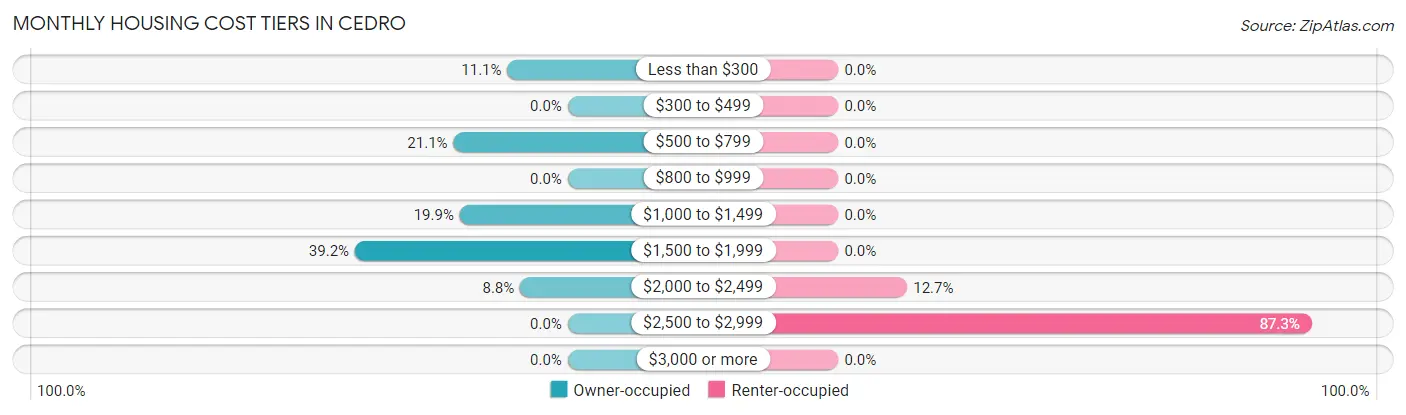
| Monthly Cost | Owner-occupied | Renter-occupied |
| Less than $300 | 19 (11.1%) | 0 (0.0%) |
| $300 to $499 | 0 (0.0%) | 0 (0.0%) |
| $500 to $799 | 36 (21.0%) | 0 (0.0%) |
| $800 to $999 | 0 (0.0%) | 0 (0.0%) |
| $1,000 to $1,499 | 34 (19.9%) | 0 (0.0%) |
| $1,500 to $1,999 | 67 (39.2%) | 0 (0.0%) |
| $2,000 to $2,499 | 15 (8.8%) | 9 (12.7%) |
| $2,500 to $2,999 | 0 (0.0%) | 62 (87.3%) |
| $3,000 or more | 0 (0.0%) | 0 (0.0%) |
| Total | 171 (100.0%) | 71 (100.0%) |
Physical Housing Characteristics in Cedro
Housing Structures in Cedro
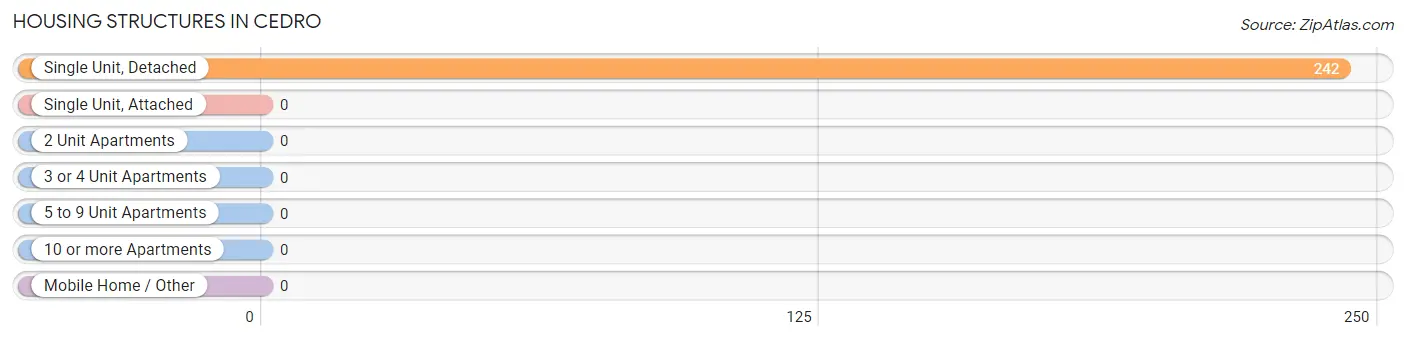
| Structure Type | # Housing Units | % Housing Units |
| Single Unit, Detached | 242 | 100.0% |
| Single Unit, Attached | 0 | 0.0% |
| 2 Unit Apartments | 0 | 0.0% |
| 3 or 4 Unit Apartments | 0 | 0.0% |
| 5 to 9 Unit Apartments | 0 | 0.0% |
| 10 or more Apartments | 0 | 0.0% |
| Mobile Home / Other | 0 | 0.0% |
| Total | 242 | 100.0% |
Housing Structures by Occupancy in Cedro
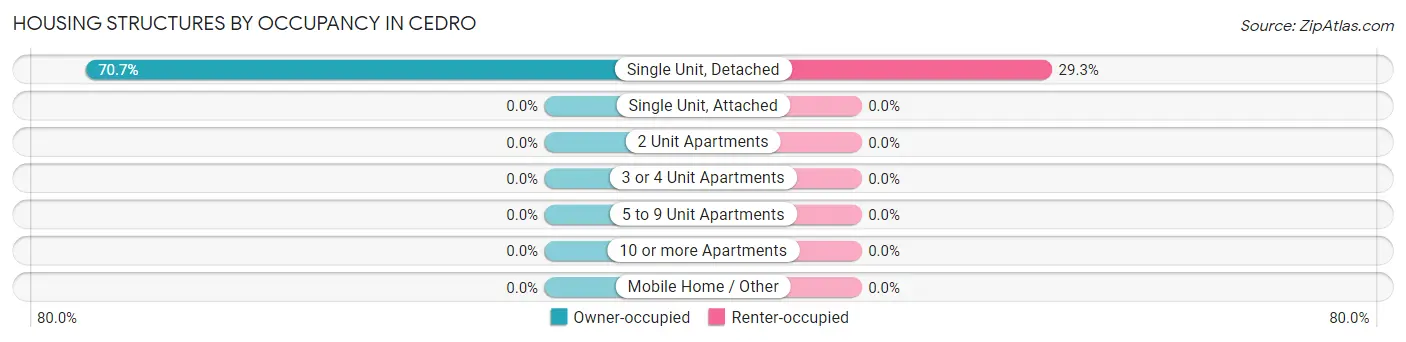
| Structure Type | Owner-occupied | Renter-occupied |
| Single Unit, Detached | 171 (70.7%) | 71 (29.3%) |
| Single Unit, Attached | 0 (0.0%) | 0 (0.0%) |
| 2 Unit Apartments | 0 (0.0%) | 0 (0.0%) |
| 3 or 4 Unit Apartments | 0 (0.0%) | 0 (0.0%) |
| 5 to 9 Unit Apartments | 0 (0.0%) | 0 (0.0%) |
| 10 or more Apartments | 0 (0.0%) | 0 (0.0%) |
| Mobile Home / Other | 0 (0.0%) | 0 (0.0%) |
| Total | 171 (70.7%) | 71 (29.3%) |
Housing Structures by Number of Rooms in Cedro
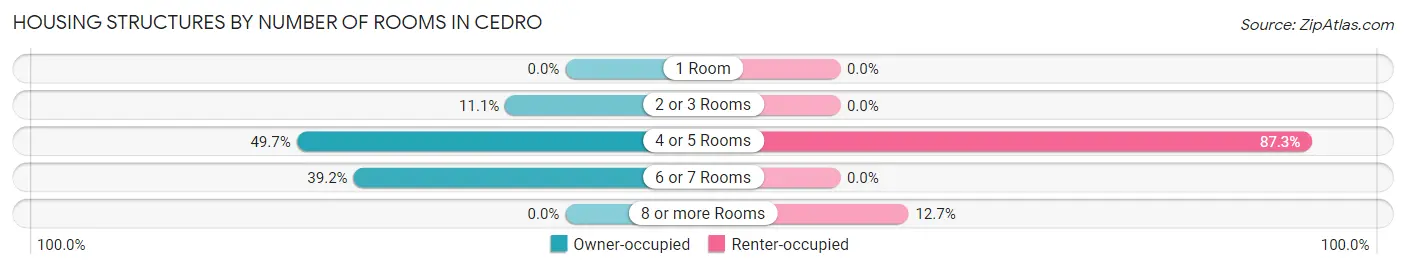
| Number of Rooms | Owner-occupied | Renter-occupied |
| 1 Room | 0 (0.0%) | 0 (0.0%) |
| 2 or 3 Rooms | 19 (11.1%) | 0 (0.0%) |
| 4 or 5 Rooms | 85 (49.7%) | 62 (87.3%) |
| 6 or 7 Rooms | 67 (39.2%) | 0 (0.0%) |
| 8 or more Rooms | 0 (0.0%) | 9 (12.7%) |
| Total | 171 (100.0%) | 71 (100.0%) |
Housing Structure by Heating Type in Cedro
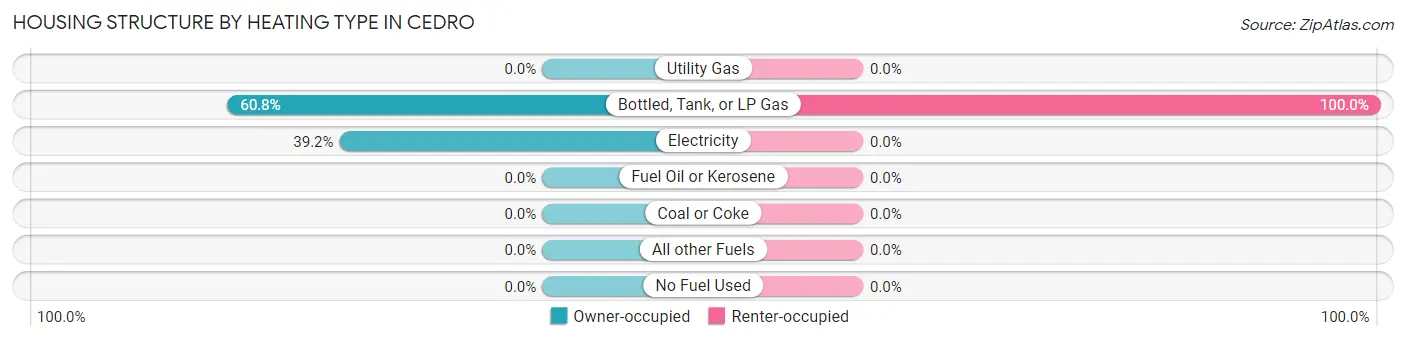
| Heating Type | Owner-occupied | Renter-occupied |
| Utility Gas | 0 (0.0%) | 0 (0.0%) |
| Bottled, Tank, or LP Gas | 104 (60.8%) | 71 (100.0%) |
| Electricity | 67 (39.2%) | 0 (0.0%) |
| Fuel Oil or Kerosene | 0 (0.0%) | 0 (0.0%) |
| Coal or Coke | 0 (0.0%) | 0 (0.0%) |
| All other Fuels | 0 (0.0%) | 0 (0.0%) |
| No Fuel Used | 0 (0.0%) | 0 (0.0%) |
| Total | 171 (100.0%) | 71 (100.0%) |
Household Vehicle Usage in Cedro
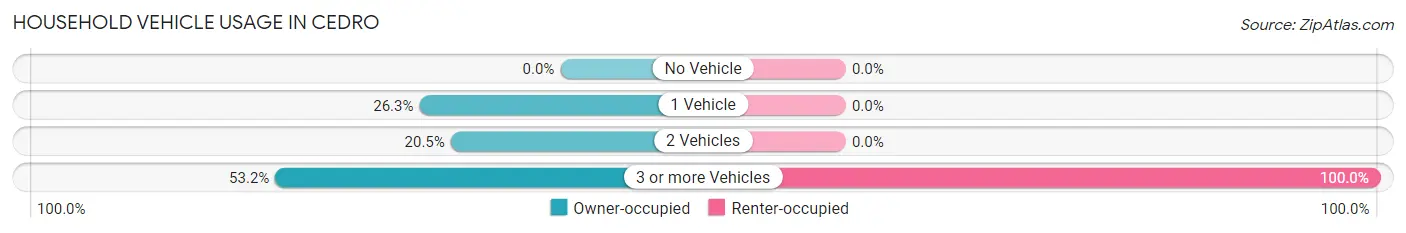
| Vehicles per Household | Owner-occupied | Renter-occupied |
| No Vehicle | 0 (0.0%) | 0 (0.0%) |
| 1 Vehicle | 45 (26.3%) | 0 (0.0%) |
| 2 Vehicles | 35 (20.5%) | 0 (0.0%) |
| 3 or more Vehicles | 91 (53.2%) | 71 (100.0%) |
| Total | 171 (100.0%) | 71 (100.0%) |
Real Estate & Mortgages in Cedro
Real Estate and Mortgage Overview in Cedro
| Characteristic | Without Mortgage | With Mortgage |
| Housing Units | 55 | 116 |
| Median Property Value | - | - |
| Median Household Income | - | - |
| Monthly Housing Costs | $540 | $0 |
| Real Estate Taxes | - | - |
Property Value by Mortgage Status in Cedro
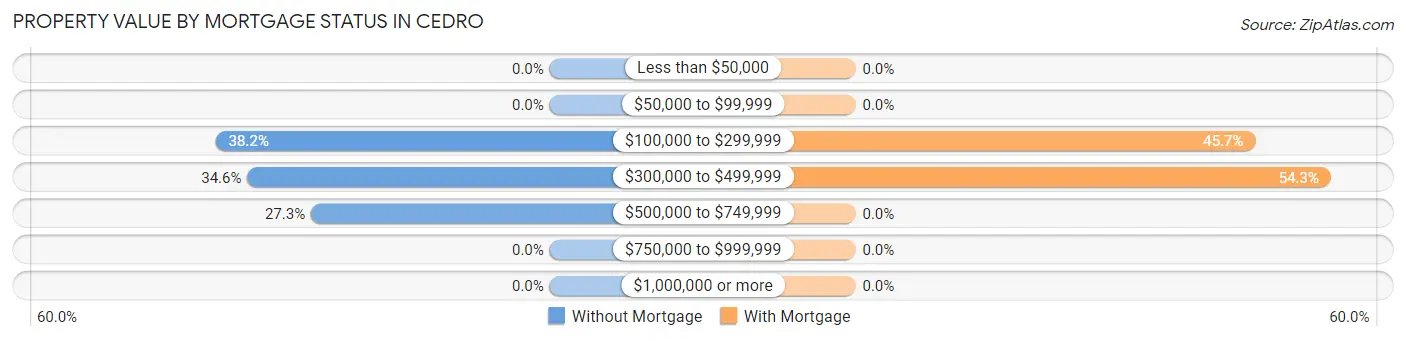
| Property Value | Without Mortgage | With Mortgage |
| Less than $50,000 | 0 (0.0%) | 0 (0.0%) |
| $50,000 to $99,999 | 0 (0.0%) | 0 (0.0%) |
| $100,000 to $299,999 | 21 (38.2%) | 53 (45.7%) |
| $300,000 to $499,999 | 19 (34.5%) | 63 (54.3%) |
| $500,000 to $749,999 | 15 (27.3%) | 0 (0.0%) |
| $750,000 to $999,999 | 0 (0.0%) | 0 (0.0%) |
| $1,000,000 or more | 0 (0.0%) | 0 (0.0%) |
| Total | 55 (100.0%) | 116 (100.0%) |
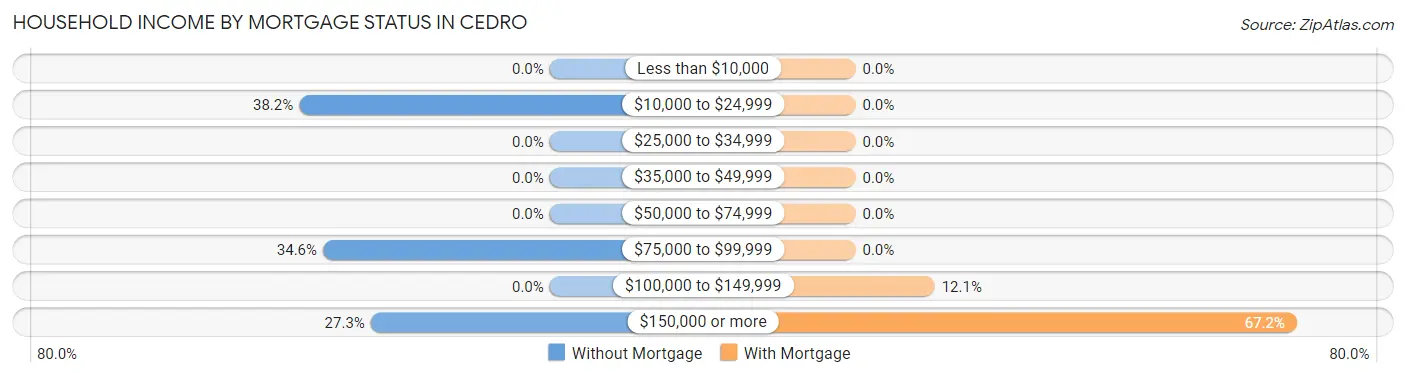
Household Income by Mortgage Status in Cedro
| Household Income | Without Mortgage | With Mortgage |
| Less than $10,000 | 0 (0.0%) | 0 (0.0%) |
| $10,000 to $24,999 | 21 (38.2%) | 0 (0.0%) |
| $25,000 to $34,999 | 0 (0.0%) | 0 (0.0%) |
| $35,000 to $49,999 | 0 (0.0%) | 0 (0.0%) |
| $50,000 to $74,999 | 0 (0.0%) | 0 (0.0%) |
| $75,000 to $99,999 | 19 (34.5%) | 0 (0.0%) |
| $100,000 to $149,999 | 0 (0.0%) | 14 (12.1%) |
| $150,000 or more | 15 (27.3%) | 78 (67.2%) |
| Total | 55 (100.0%) | 116 (100.0%) |
Property Value to Household Income Ratio in Cedro
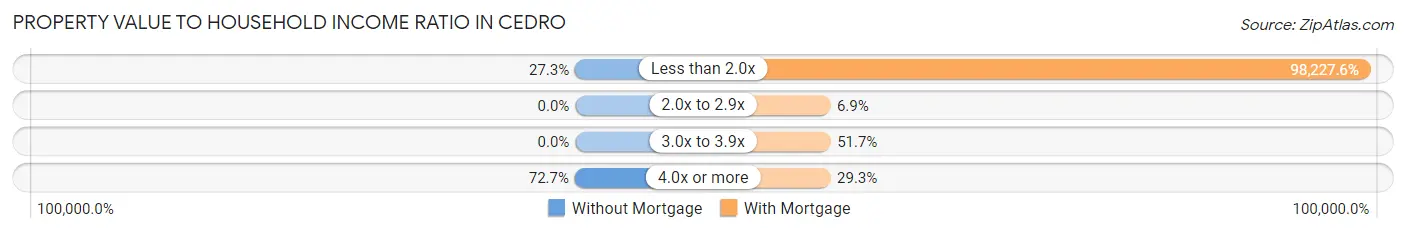
| Value-to-Income Ratio | Without Mortgage | With Mortgage |
| Less than 2.0x | 15 (27.3%) | 113,944 (98,227.6%) |
| 2.0x to 2.9x | 0 (0.0%) | 8 (6.9%) |
| 3.0x to 3.9x | 0 (0.0%) | 60 (51.7%) |
| 4.0x or more | 40 (72.7%) | 34 (29.3%) |
| Total | 55 (100.0%) | 116 (100.0%) |
Real Estate Taxes by Mortgage Status in Cedro
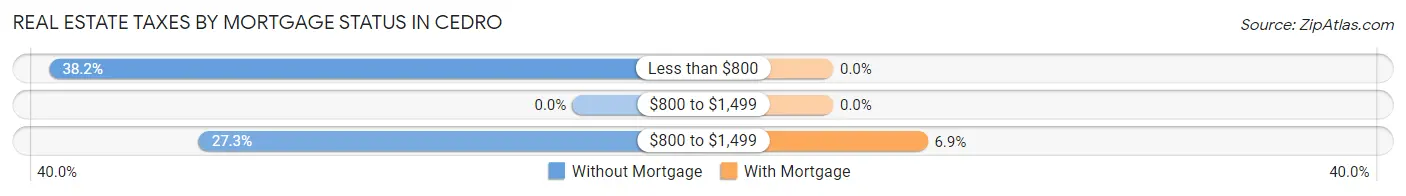
| Property Taxes | Without Mortgage | With Mortgage |
| Less than $800 | 21 (38.2%) | 0 (0.0%) |
| $800 to $1,499 | 0 (0.0%) | 0 (0.0%) |
| $800 to $1,499 | 15 (27.3%) | 8 (6.9%) |
| Total | 55 (100.0%) | 116 (100.0%) |
Health & Disability in Cedro
Health Insurance Coverage by Age in Cedro
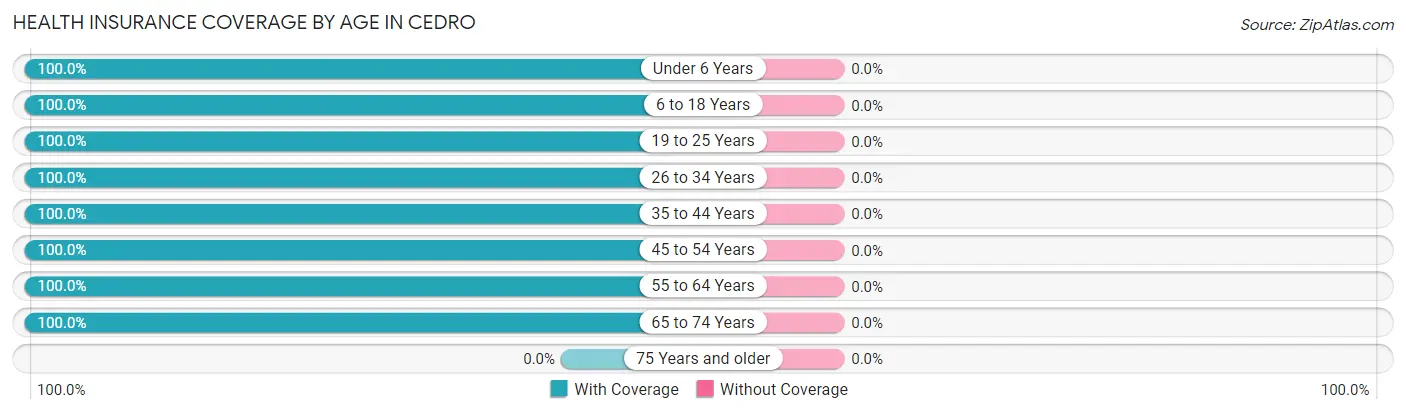
| Age Bracket | With Coverage | Without Coverage |
| Under 6 Years | 84 (100.0%) | 0 (0.0%) |
| 6 to 18 Years | 51 (100.0%) | 0 (0.0%) |
| 19 to 25 Years | 10 (100.0%) | 0 (0.0%) |
| 26 to 34 Years | 139 (100.0%) | 0 (0.0%) |
| 35 to 44 Years | 18 (100.0%) | 0 (0.0%) |
| 45 to 54 Years | 134 (100.0%) | 0 (0.0%) |
| 55 to 64 Years | 76 (100.0%) | 0 (0.0%) |
| 65 to 74 Years | 65 (100.0%) | 0 (0.0%) |
| 75 Years and older | 0 (0.0%) | 0 (0.0%) |
| Total | 577 (100.0%) | 0 (0.0%) |
Health Insurance Coverage by Citizenship Status in Cedro

| Citizenship Status | With Coverage | Without Coverage |
| Native Born | 84 (100.0%) | 0 (0.0%) |
| Foreign Born, Citizen | 51 (100.0%) | 0 (0.0%) |
| Foreign Born, not a Citizen | 10 (100.0%) | 0 (0.0%) |
Health Insurance Coverage by Household Income in Cedro
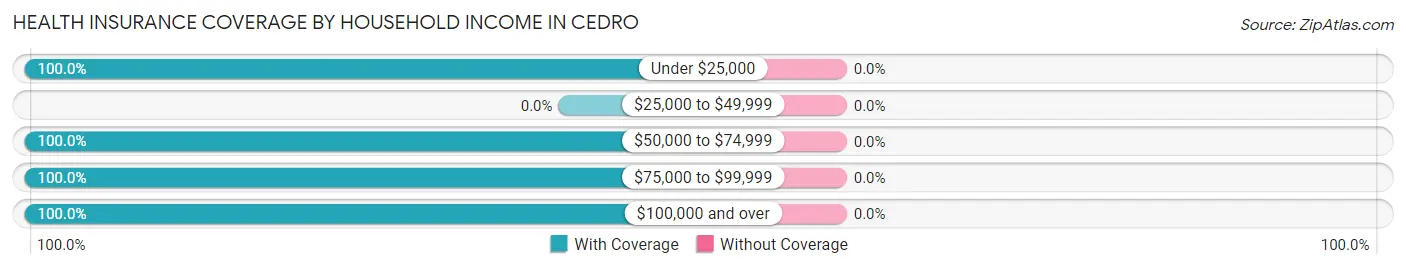
| Household Income | With Coverage | Without Coverage |
| Under $25,000 | 21 (100.0%) | 0 (0.0%) |
| $25,000 to $49,999 | 0 (0.0%) | 0 (0.0%) |
| $50,000 to $74,999 | 223 (100.0%) | 0 (0.0%) |
| $75,000 to $99,999 | 65 (100.0%) | 0 (0.0%) |
| $100,000 and over | 268 (100.0%) | 0 (0.0%) |
Public vs Private Health Insurance Coverage by Age in Cedro
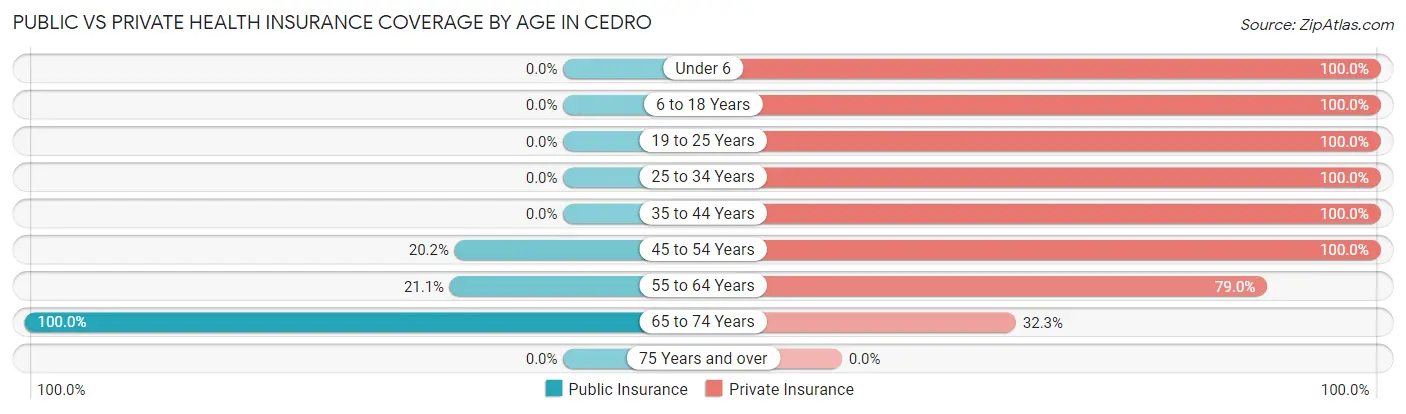
| Age Bracket | Public Insurance | Private Insurance |
| Under 6 | 0 (0.0%) | 84 (100.0%) |
| 6 to 18 Years | 0 (0.0%) | 51 (100.0%) |
| 19 to 25 Years | 0 (0.0%) | 10 (100.0%) |
| 25 to 34 Years | 0 (0.0%) | 139 (100.0%) |
| 35 to 44 Years | 0 (0.0%) | 18 (100.0%) |
| 45 to 54 Years | 27 (20.2%) | 134 (100.0%) |
| 55 to 64 Years | 16 (21.0%) | 60 (78.9%) |
| 65 to 74 Years | 65 (100.0%) | 21 (32.3%) |
| 75 Years and over | 0 (0.0%) | 0 (0.0%) |
| Total | 108 (18.7%) | 517 (89.6%) |
Disability Status by Sex by Age in Cedro
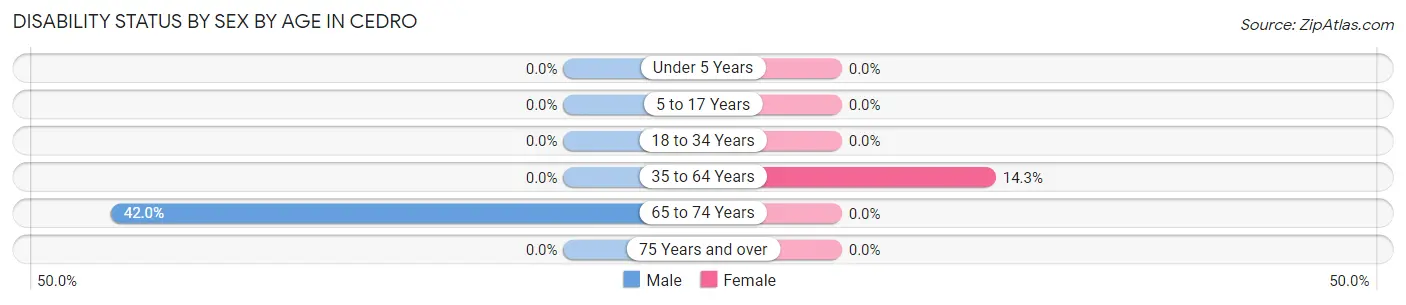
| Age Bracket | Male | Female |
| Under 5 Years | 0 (0.0%) | 0 (0.0%) |
| 5 to 17 Years | 0 (0.0%) | 0 (0.0%) |
| 18 to 34 Years | 0 (0.0%) | 0 (0.0%) |
| 35 to 64 Years | 0 (0.0%) | 14 (14.3%) |
| 65 to 74 Years | 21 (42.0%) | 0 (0.0%) |
| 75 Years and over | 0 (0.0%) | 0 (0.0%) |
Disability Class by Sex by Age in Cedro
Disability Class: Hearing Difficulty
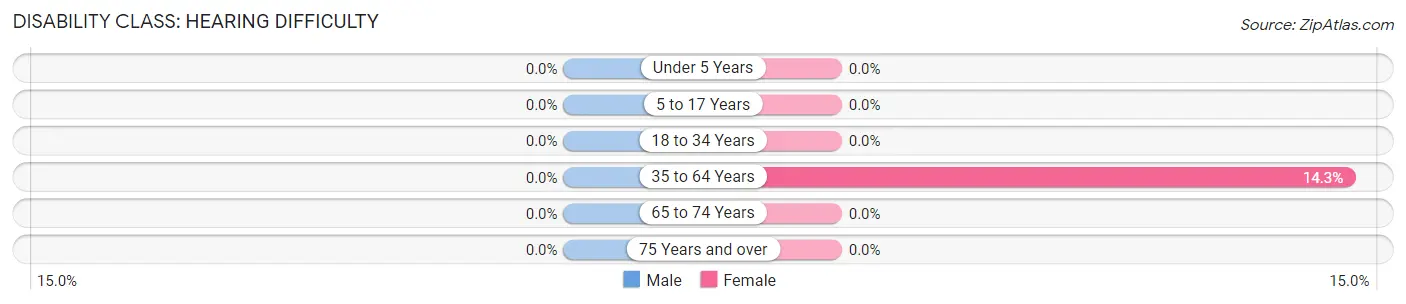
| Age Bracket | Male | Female |
| Under 5 Years | 0 (0.0%) | 0 (0.0%) |
| 5 to 17 Years | 0 (0.0%) | 0 (0.0%) |
| 18 to 34 Years | 0 (0.0%) | 0 (0.0%) |
| 35 to 64 Years | 0 (0.0%) | 14 (14.3%) |
| 65 to 74 Years | 0 (0.0%) | 0 (0.0%) |
| 75 Years and over | 0 (0.0%) | 0 (0.0%) |
Disability Class: Vision Difficulty
| Age Bracket | Male | Female |
| Under 5 Years | 0 (0.0%) | 0 (0.0%) |
| 5 to 17 Years | 0 (0.0%) | 0 (0.0%) |
| 18 to 34 Years | 0 (0.0%) | 0 (0.0%) |
| 35 to 64 Years | 0 (0.0%) | 0 (0.0%) |
| 65 to 74 Years | 0 (0.0%) | 0 (0.0%) |
| 75 Years and over | 0 (0.0%) | 0 (0.0%) |
Disability Class: Cognitive Difficulty
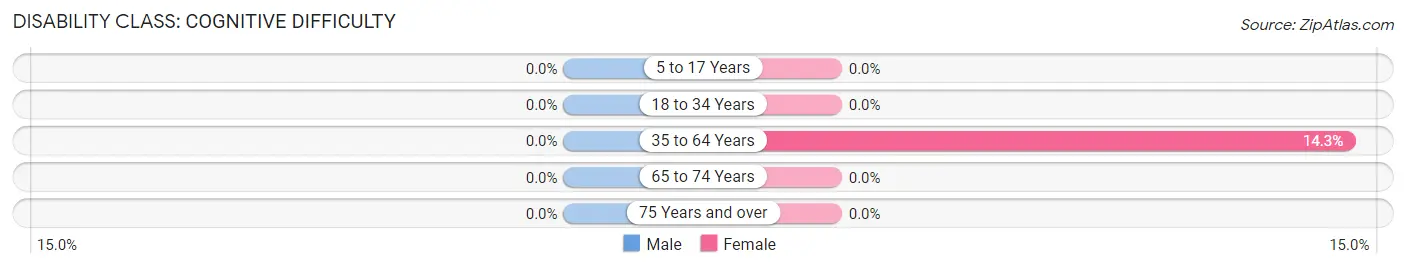
| Age Bracket | Male | Female |
| 5 to 17 Years | 0 (0.0%) | 0 (0.0%) |
| 18 to 34 Years | 0 (0.0%) | 0 (0.0%) |
| 35 to 64 Years | 0 (0.0%) | 14 (14.3%) |
| 65 to 74 Years | 0 (0.0%) | 0 (0.0%) |
| 75 Years and over | 0 (0.0%) | 0 (0.0%) |
Disability Class: Ambulatory Difficulty
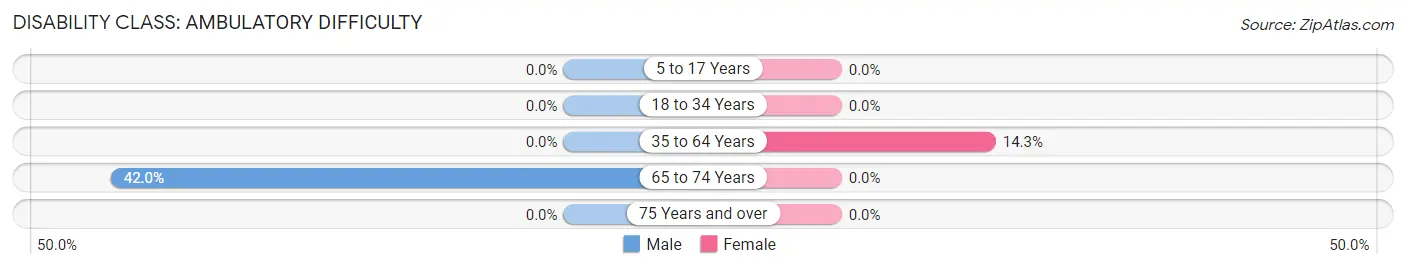
| Age Bracket | Male | Female |
| 5 to 17 Years | 0 (0.0%) | 0 (0.0%) |
| 18 to 34 Years | 0 (0.0%) | 0 (0.0%) |
| 35 to 64 Years | 0 (0.0%) | 14 (14.3%) |
| 65 to 74 Years | 21 (42.0%) | 0 (0.0%) |
| 75 Years and over | 0 (0.0%) | 0 (0.0%) |
Disability Class: Self-Care Difficulty
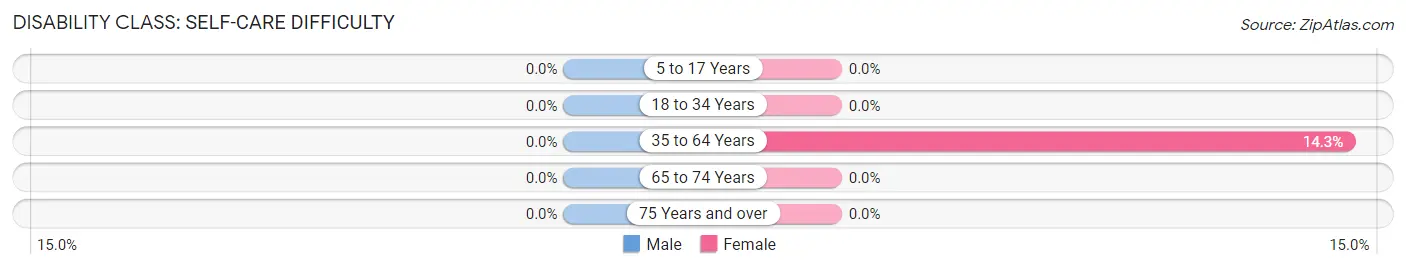
| Age Bracket | Male | Female |
| 5 to 17 Years | 0 (0.0%) | 0 (0.0%) |
| 18 to 34 Years | 0 (0.0%) | 0 (0.0%) |
| 35 to 64 Years | 0 (0.0%) | 14 (14.3%) |
| 65 to 74 Years | 0 (0.0%) | 0 (0.0%) |
| 75 Years and over | 0 (0.0%) | 0 (0.0%) |
Technology Access in Cedro
Computing Device Access in Cedro
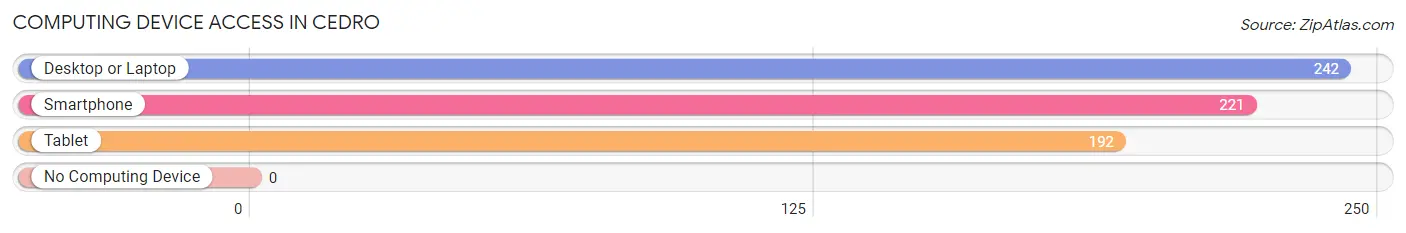
| Device Type | # Households | % Households |
| Desktop or Laptop | 242 | 100.0% |
| Smartphone | 221 | 91.3% |
| Tablet | 192 | 79.3% |
| No Computing Device | 0 | 0.0% |
| Total | 242 | 100.0% |
Internet Access in Cedro
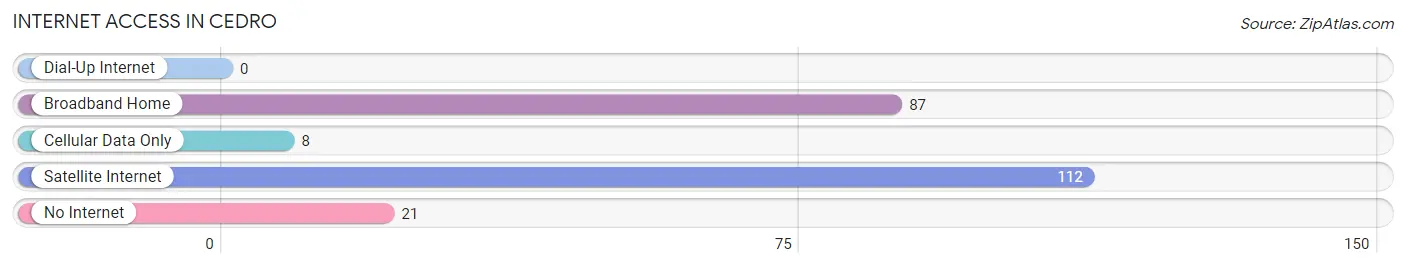
| Internet Type | # Households | % Households |
| Dial-Up Internet | 0 | 0.0% |
| Broadband Home | 87 | 35.9% |
| Cellular Data Only | 8 | 3.3% |
| Satellite Internet | 112 | 46.3% |
| No Internet | 21 | 8.7% |
| Total | 242 | 100.0% |
Cedro Summary
Cedro is a small unincorporated community located in the state of New Mexico. It is situated in the northern part of the state, in the county of San Miguel. The population of Cedro was estimated to be around 200 people in the year 2000.
History
Cedro was founded in the late 1800s by a group of settlers from the nearby town of Las Vegas. The settlers were looking for a place to settle and start a new life. They chose the area around Cedro because of its fertile soil and abundant water sources. The settlers built a small village and named it Cedro, after the Spanish word for cedar.
The town grew slowly but steadily over the years, and by the early 1900s it had become a thriving community. The town was home to a variety of businesses, including a general store, a blacksmith, a saloon, and a post office. The town also had a school, which was attended by the children of the settlers.
Geography
Cedro is located in the northern part of New Mexico, in the county of San Miguel. The town is situated in a valley surrounded by mountains. The area is known for its dry climate and is prone to drought. The nearest major city is Las Vegas, which is located about 30 miles away.
The terrain around Cedro is mostly flat, with some rolling hills. The area is mostly covered in grasslands and shrublands, with some areas of pine and juniper forests. The nearby mountains provide a scenic backdrop to the town.
Economy
The economy of Cedro is largely based on agriculture. The town is home to several farms, which produce a variety of crops, including alfalfa, corn, wheat, and hay. The town also has a few small businesses, including a general store, a gas station, and a post office.
Demographics
The population of Cedro was estimated to be around 200 people in the year 2000. The majority of the population is of Hispanic or Latino descent. The town also has a small Native American population. The median household income in Cedro is around $25,000, which is lower than the national average. The town has a high poverty rate, with around 40% of the population living below the poverty line.
Common Questions
What is the Total Population of Cedro?
Total Population of Cedro is 577.
What is the Total Male Population of Cedro?
Total Male Population of Cedro is 341.
What is the Total Female Population of Cedro?
Total Female Population of Cedro is 236.
What is the Ratio of Males per 100 Females in Cedro?
There are 144.49 Males per 100 Females in Cedro.
What is the Ratio of Females per 100 Males in Cedro?
There are 69.21 Females per 100 Males in Cedro.
What is the Median Population Age in Cedro?
Median Population Age in Cedro is 41.3 Years.
What is the Average Family Size in Cedro
Average Family Size in Cedro is 2.5 People.
What is the Average Household Size in Cedro
Average Household Size in Cedro is 2.4 People.
What is Per Capita Income in Cedro?
Per Capita income in Cedro is $53,927.
What is the Median Family Income in Cedro?
Median Family Income in Cedro is $102,153.
What is the Median Household income in Cedro?
Median Household Income in Cedro is $100,694.
What is Income or Wage Gap in Cedro?
Income or Wage Gap in Cedro is 36.7%.
Women in Cedro earn 63.3 cents for every dollar earned by a man.
What is Inequality or Gini Index in Cedro?
Inequality or Gini Index in Cedro is 0.38.
How Large is the Labor Force in Cedro?
There are 233 People in the Labor Forcein in Cedro.
What is the Percentage of People in the Labor Force in Cedro?
52.7% of People are in the Labor Force in Cedro.