Ponderosa Pine, NM
Ponderosa Pine Map
Ponderosa Pine Overview
1,246
TOTAL POPULATION
545
MALE POPULATION
701
FEMALE POPULATION
77.75
MALES / 100 FEMALES
128.62
FEMALES / 100 MALES
56.0
MEDIAN AGE
2.4
AVG FAMILY SIZE
2.3
AVG HOUSEHOLD SIZE
$42,662
PER CAPITA INCOME
$88,429
AVG FAMILY INCOME
$88,253
AVG HOUSEHOLD INCOME
0.35
INEQUALITY / GINI INDEX
436
LABOR FORCE [ PEOPLE ]
39.5%
PERCENT IN LABOR FORCE
11.4%
UNEMPLOYMENT RATE
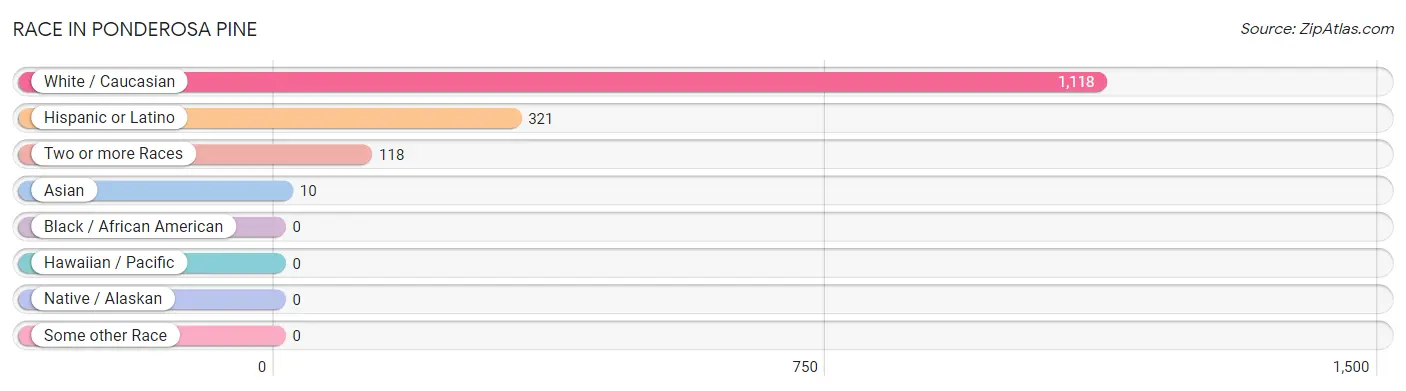
Race in Ponderosa Pine
The most populous races in Ponderosa Pine are White / Caucasian (1,118 | 89.7%), Hispanic or Latino (321 | 25.8%), and Two or more Races (118 | 9.5%).
| Race | # Population | % Population |
| Asian | 10 | 0.8% |
| Black / African American | 0 | 0.0% |
| Hawaiian / Pacific | 0 | 0.0% |
| Hispanic or Latino | 321 | 25.8% |
| Native / Alaskan | 0 | 0.0% |
| White / Caucasian | 1,118 | 89.7% |
| Two or more Races | 118 | 9.5% |
| Some other Race | 0 | 0.0% |
| Total | 1,246 | 100.0% |
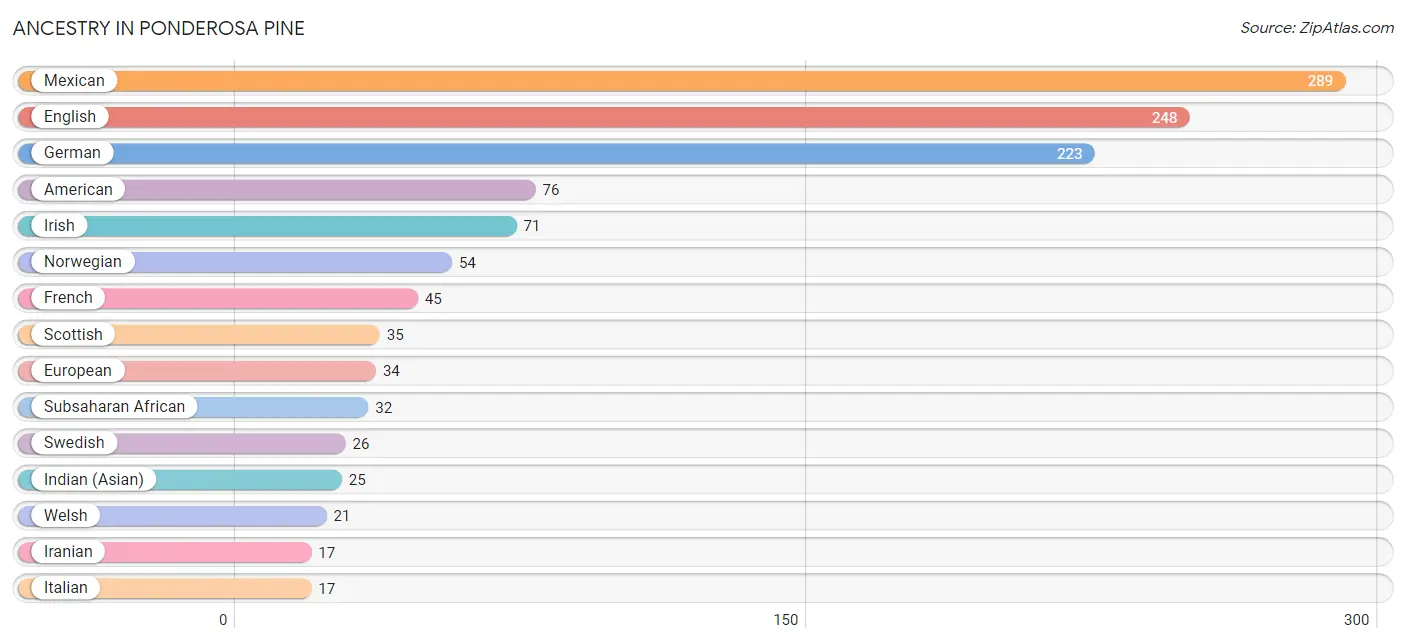
Ancestry in Ponderosa Pine
The most populous ancestries reported in Ponderosa Pine are Mexican (289 | 23.2%), English (248 | 19.9%), German (223 | 17.9%), American (76 | 6.1%), and Irish (71 | 5.7%), together accounting for 72.8% of all Ponderosa Pine residents.
| Ancestry | # Population | % Population |
| American | 76 | 6.1% |
| Apache | 8 | 0.6% |
| English | 248 | 19.9% |
| European | 34 | 2.7% |
| French | 45 | 3.6% |
| German | 223 | 17.9% |
| Indian (Asian) | 25 | 2.0% |
| Iranian | 17 | 1.4% |
| Irish | 71 | 5.7% |
| Italian | 17 | 1.4% |
| Mexican | 289 | 23.2% |
| Northern European | 6 | 0.5% |
| Norwegian | 54 | 4.3% |
| Romanian | 15 | 1.2% |
| Scotch-Irish | 2 | 0.2% |
| Scottish | 35 | 2.8% |
| South American | 15 | 1.2% |
| Spaniard | 9 | 0.7% |
| Spanish | 8 | 0.6% |
| Subsaharan African | 32 | 2.6% |
| Swedish | 26 | 2.1% |
| Welsh | 21 | 1.7% | View All 22 Rows |
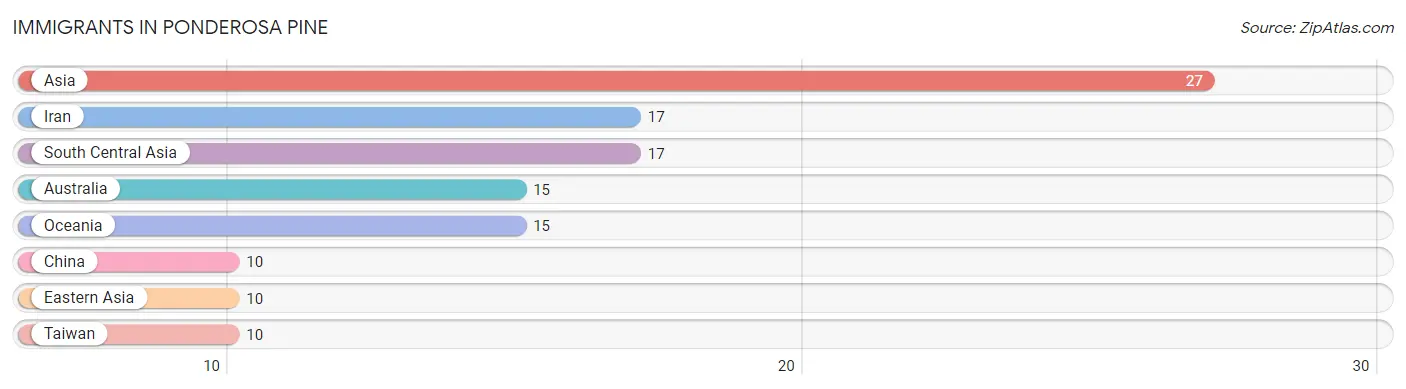
Immigrants in Ponderosa Pine
The most numerous immigrant groups reported in Ponderosa Pine came from Asia (27 | 2.2%), Iran (17 | 1.4%), South Central Asia (17 | 1.4%), Australia (15 | 1.2%), and Oceania (15 | 1.2%), together accounting for 7.3% of all Ponderosa Pine residents.
| Immigration Origin | # Population | % Population |
| Asia | 27 | 2.2% |
| Australia | 15 | 1.2% |
| China | 10 | 0.8% |
| Eastern Asia | 10 | 0.8% |
| Iran | 17 | 1.4% |
| Oceania | 15 | 1.2% |
| South Central Asia | 17 | 1.4% |
| Taiwan | 10 | 0.8% | View All 8 Rows |
Sex and Age in Ponderosa Pine
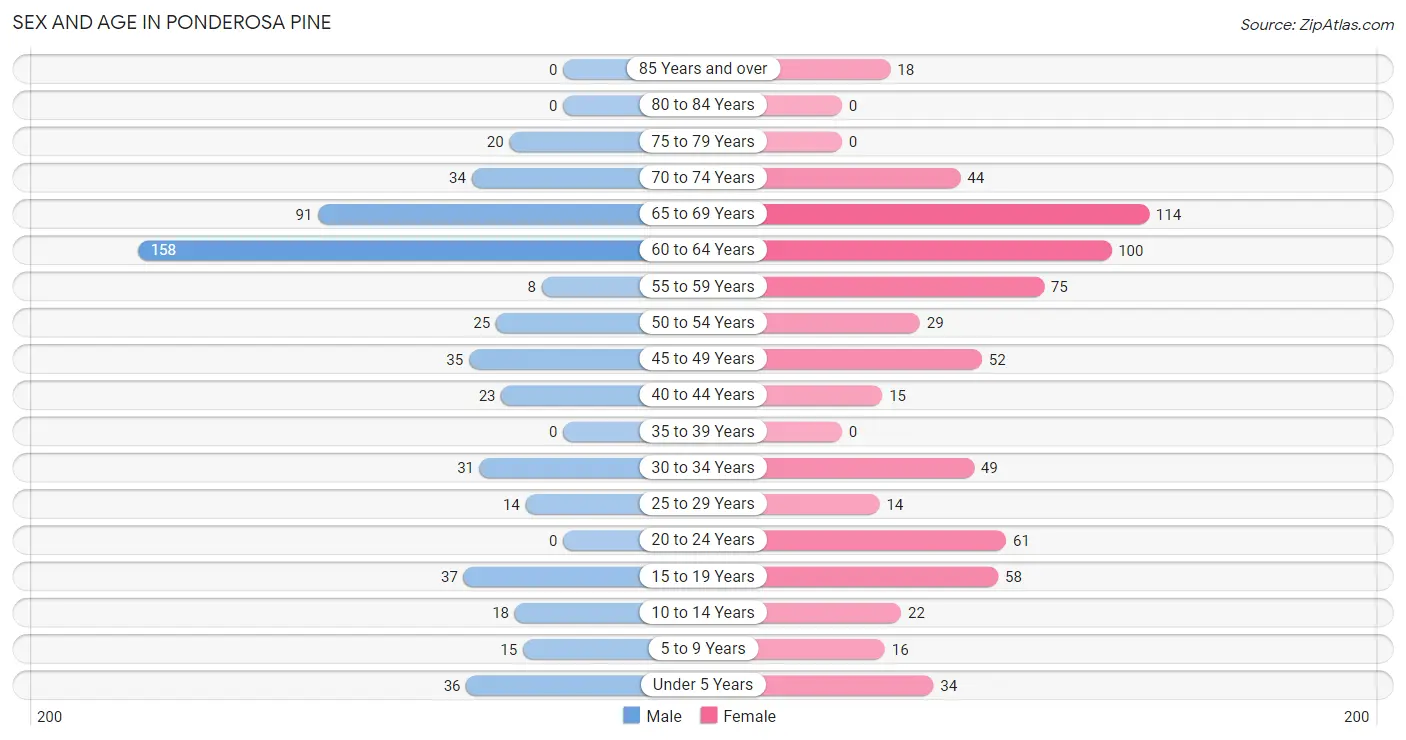
Sex and Age in Ponderosa Pine
The most populous age groups in Ponderosa Pine are 60 to 64 Years (158 | 29.0%) for men and 65 to 69 Years (114 | 16.3%) for women.
| Age Bracket | Male | Female |
| Under 5 Years | 36 (6.6%) | 34 (4.9%) |
| 5 to 9 Years | 15 (2.8%) | 16 (2.3%) |
| 10 to 14 Years | 18 (3.3%) | 22 (3.1%) |
| 15 to 19 Years | 37 (6.8%) | 58 (8.3%) |
| 20 to 24 Years | 0 (0.0%) | 61 (8.7%) |
| 25 to 29 Years | 14 (2.6%) | 14 (2.0%) |
| 30 to 34 Years | 31 (5.7%) | 49 (7.0%) |
| 35 to 39 Years | 0 (0.0%) | 0 (0.0%) |
| 40 to 44 Years | 23 (4.2%) | 15 (2.1%) |
| 45 to 49 Years | 35 (6.4%) | 52 (7.4%) |
| 50 to 54 Years | 25 (4.6%) | 29 (4.1%) |
| 55 to 59 Years | 8 (1.5%) | 75 (10.7%) |
| 60 to 64 Years | 158 (29.0%) | 100 (14.3%) |
| 65 to 69 Years | 91 (16.7%) | 114 (16.3%) |
| 70 to 74 Years | 34 (6.2%) | 44 (6.3%) |
| 75 to 79 Years | 20 (3.7%) | 0 (0.0%) |
| 80 to 84 Years | 0 (0.0%) | 0 (0.0%) |
| 85 Years and over | 0 (0.0%) | 18 (2.6%) |
| Total | 545 (100.0%) | 701 (100.0%) |
Families and Households in Ponderosa Pine
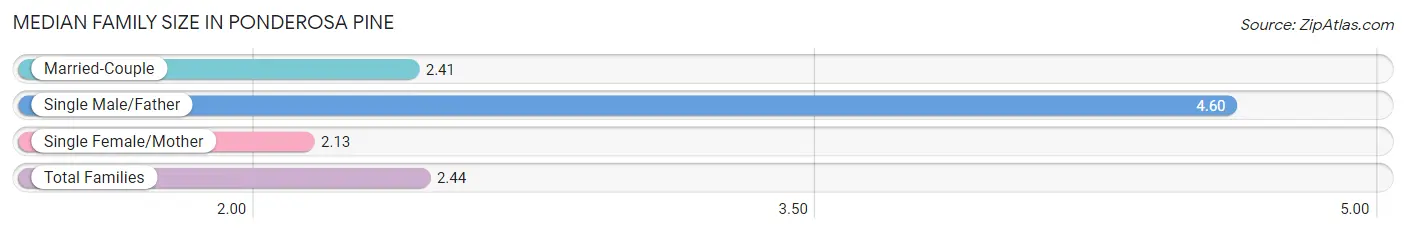
Median Family Size in Ponderosa Pine
The median family size in Ponderosa Pine is 2.44 persons per family, with single male/father families (10 | 2.3%) accounting for the largest median family size of 4.6 persons per family. On the other hand, single female/mother families (30 | 6.9%) represent the smallest median family size with 2.13 persons per family.
| Family Type | # Families | Family Size |
| Married-Couple | 394 (90.8%) | 2.41 |
| Single Male/Father | 10 (2.3%) | 4.60 |
| Single Female/Mother | 30 (6.9%) | 2.13 |
| Total Families | 434 (100.0%) | 2.44 |
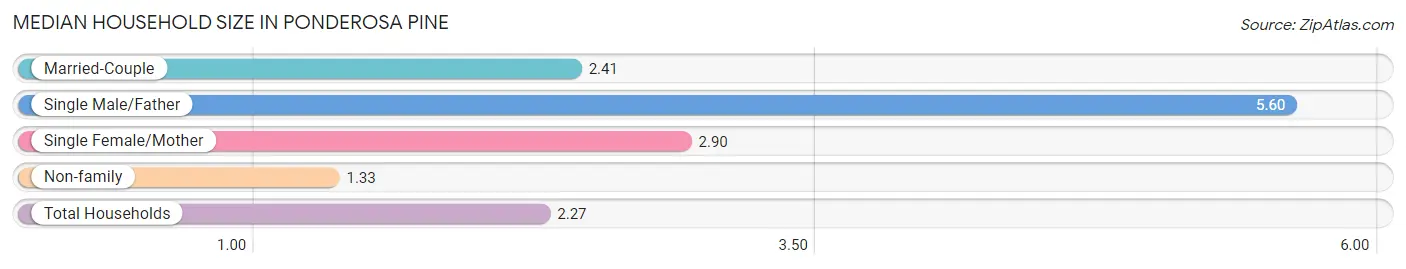
Median Household Size in Ponderosa Pine
The median household size in Ponderosa Pine is 2.27 persons per household, with single male/father households (10 | 1.8%) accounting for the largest median household size of 5.6 persons per household. non-family households (115 | 20.9%) represent the smallest median household size with 1.33 persons per household.
| Household Type | # Households | Household Size |
| Married-Couple | 394 (71.8%) | 2.41 |
| Single Male/Father | 10 (1.8%) | 5.60 |
| Single Female/Mother | 30 (5.5%) | 2.90 |
| Non-family | 115 (20.9%) | 1.33 |
| Total Households | 549 (100.0%) | 2.27 |
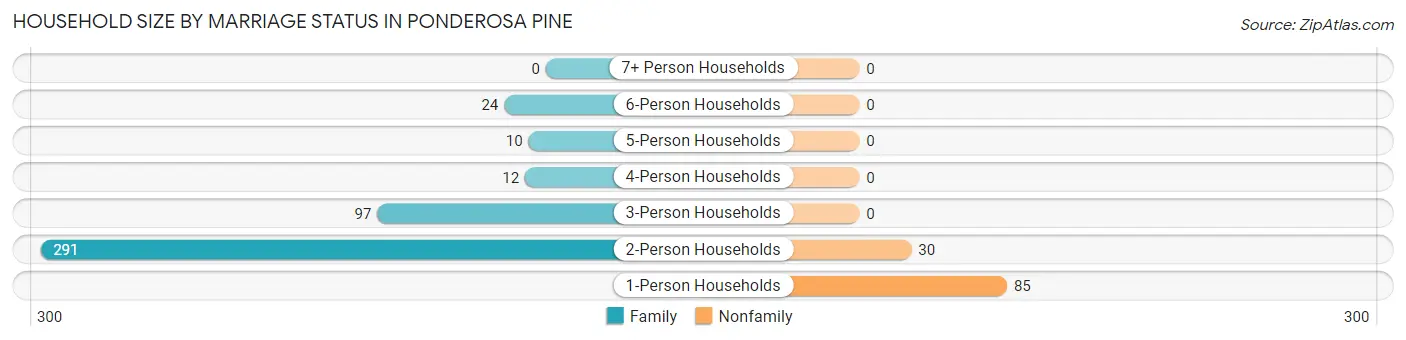
Household Size by Marriage Status in Ponderosa Pine
Out of a total of 549 households in Ponderosa Pine, 434 (79.0%) are family households, while 115 (20.9%) are nonfamily households. The most numerous type of family households are 2-person households, comprising 291, and the most common type of nonfamily households are 1-person households, comprising 85.
| Household Size | Family Households | Nonfamily Households |
| 1-Person Households | - | 85 (15.5%) |
| 2-Person Households | 291 (53.0%) | 30 (5.5%) |
| 3-Person Households | 97 (17.7%) | 0 (0.0%) |
| 4-Person Households | 12 (2.2%) | 0 (0.0%) |
| 5-Person Households | 10 (1.8%) | 0 (0.0%) |
| 6-Person Households | 24 (4.4%) | 0 (0.0%) |
| 7+ Person Households | 0 (0.0%) | 0 (0.0%) |
| Total | 434 (79.0%) | 115 (20.9%) |
Female Fertility in Ponderosa Pine
Fertility by Age in Ponderosa Pine
Average fertility rate in Ponderosa Pine is 56.0 births per 1,000 women. Women in the age bracket of 20 to 34 years have the highest fertility rate with 113.0 births per 1,000 women. Women in the age bracket of 20 to 34 years acount for 100.0% of all women with births.
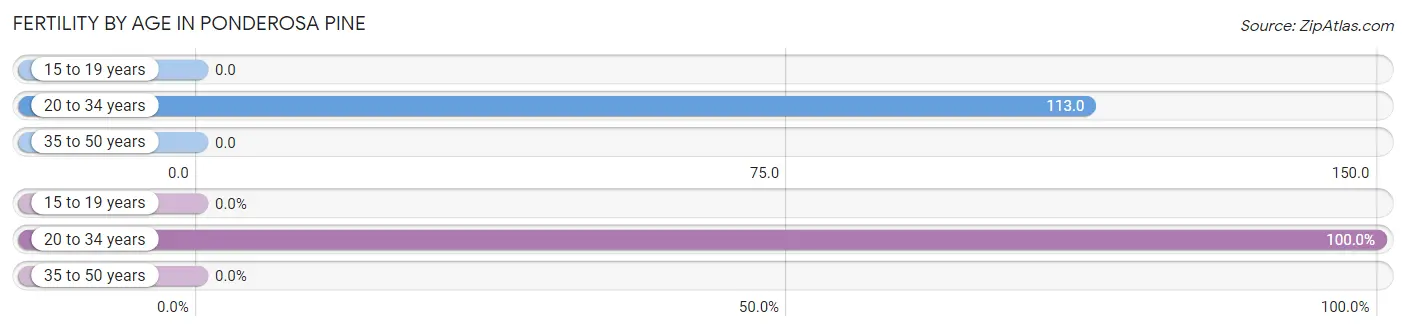
| Age Bracket | Women with Births | Births / 1,000 Women |
| 15 to 19 years | 0 (0.0%) | 0.0 |
| 20 to 34 years | 14 (100.0%) | 113.0 |
| 35 to 50 years | 0 (0.0%) | 0.0 |
| Total | 14 (100.0%) | 56.0 |
Fertility by Age by Marriage Status in Ponderosa Pine
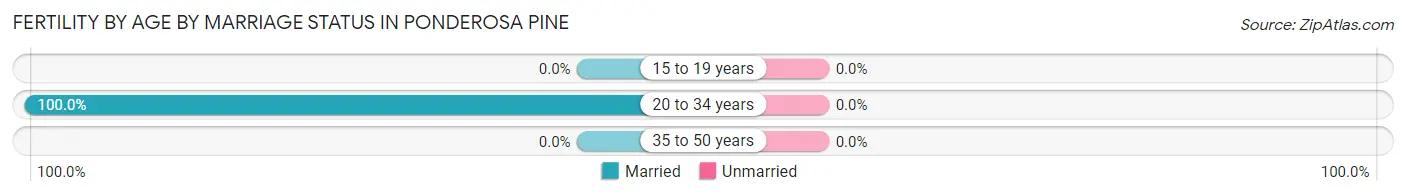
| Age Bracket | Married | Unmarried |
| 15 to 19 years | 0 (0.0%) | 0 (0.0%) |
| 20 to 34 years | 14 (100.0%) | 0 (0.0%) |
| 35 to 50 years | 0 (0.0%) | 0 (0.0%) |
| Total | 14 (100.0%) | 0 (0.0%) |
Fertility by Education in Ponderosa Pine
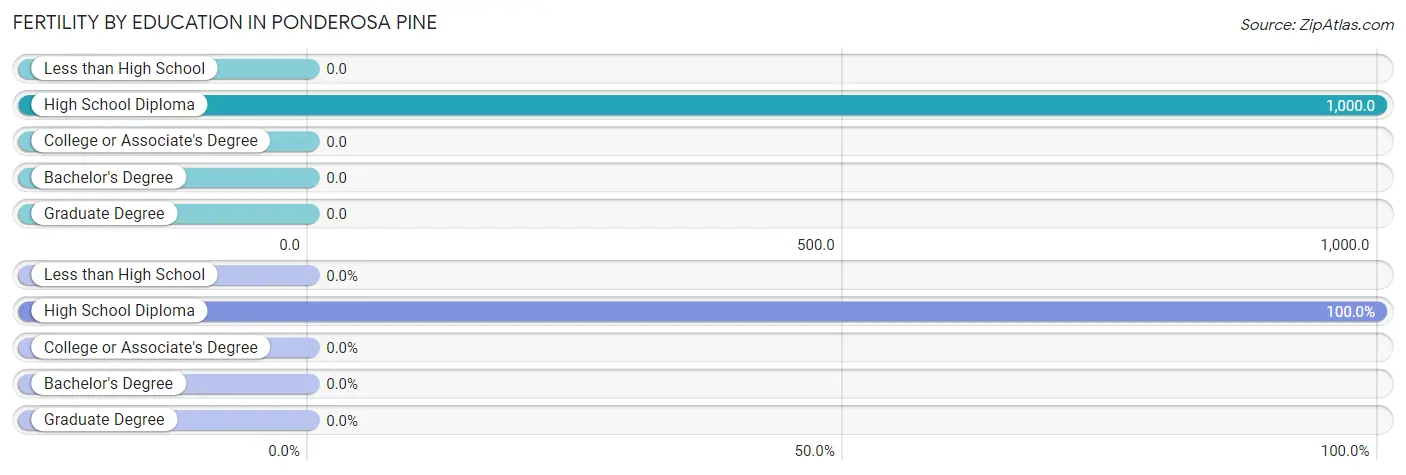
| Educational Attainment | Women with Births | Births / 1,000 Women |
| Less than High School | 0 (0.0%) | 0.0 |
| High School Diploma | 14 (100.0%) | 1,000.0 |
| College or Associate's Degree | 0 (0.0%) | 0.0 |
| Bachelor's Degree | 0 (0.0%) | 0.0 |
| Graduate Degree | 0 (0.0%) | 0.0 |
| Total | 14 (100.0%) | 56.0 |
Fertility by Education by Marriage Status in Ponderosa Pine
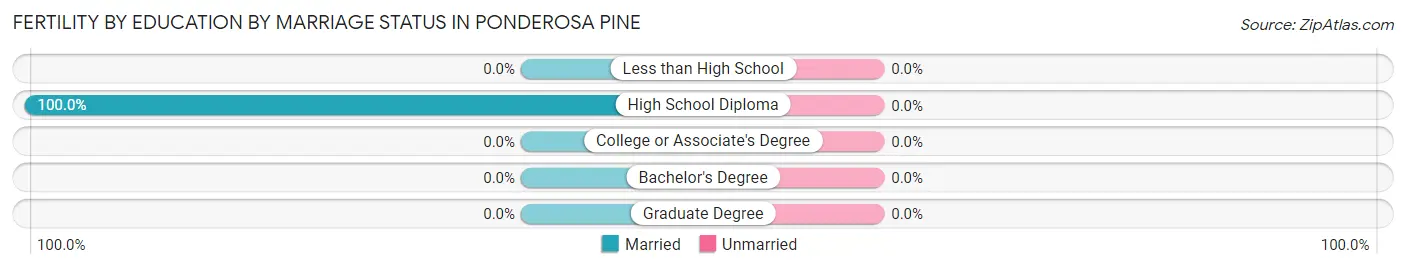
| Educational Attainment | Married | Unmarried |
| Less than High School | 0 (0.0%) | 0 (0.0%) |
| High School Diploma | 14 (100.0%) | 0 (0.0%) |
| College or Associate's Degree | 0 (0.0%) | 0 (0.0%) |
| Bachelor's Degree | 0 (0.0%) | 0 (0.0%) |
| Graduate Degree | 0 (0.0%) | 0 (0.0%) |
| Total | 14 (100.0%) | 0 (0.0%) |
Income in Ponderosa Pine
Income Overview in Ponderosa Pine
Per Capita Income in Ponderosa Pine is $42,662, while median incomes of families and households are $88,429 and $88,253 respectively.
| Characteristic | Number | Measure |
| Per Capita Income | 1,246 | $42,662 |
| Median Family Income | 434 | $88,429 |
| Mean Family Income | 434 | $95,437 |
| Median Household Income | 549 | $88,253 |
| Mean Household Income | 549 | $97,299 |
| Income Deficit | 434 | $0 |
| Wage / Income Gap (%) | 1,246 | 0.00% |
| Wage / Income Gap ($) | 1,246 | 100.00¢ per $1 |
| Gini / Inequality Index | 1,246 | 0.35 |
Earnings by Sex in Ponderosa Pine
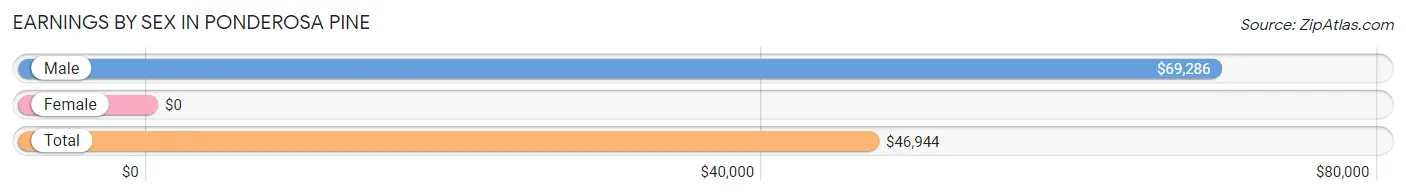
| Sex | Number | Average Earnings |
| Male | 232 (48.1%) | $69,286 |
| Female | 250 (51.9%) | $0 |
| Total | 482 (100.0%) | $46,944 |
Earnings by Sex by Income Bracket in Ponderosa Pine
The most common earnings brackets in Ponderosa Pine are $100,000+ for men (69 | 29.7%) and $100,000+ for women (67 | 26.8%).
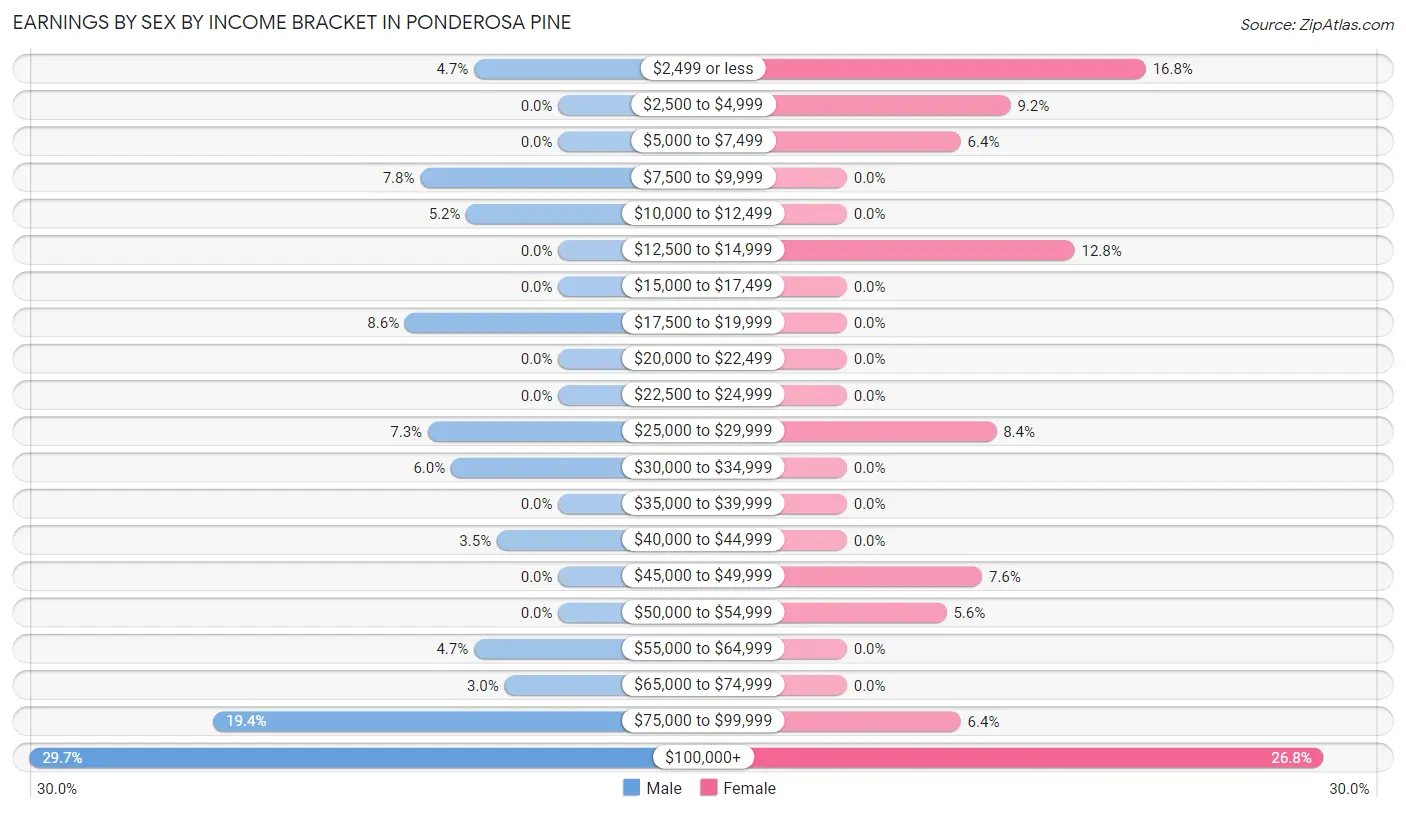
| Income | Male | Female |
| $2,499 or less | 11 (4.7%) | 42 (16.8%) |
| $2,500 to $4,999 | 0 (0.0%) | 23 (9.2%) |
| $5,000 to $7,499 | 0 (0.0%) | 16 (6.4%) |
| $7,500 to $9,999 | 18 (7.8%) | 0 (0.0%) |
| $10,000 to $12,499 | 12 (5.2%) | 0 (0.0%) |
| $12,500 to $14,999 | 0 (0.0%) | 32 (12.8%) |
| $15,000 to $17,499 | 0 (0.0%) | 0 (0.0%) |
| $17,500 to $19,999 | 20 (8.6%) | 0 (0.0%) |
| $20,000 to $22,499 | 0 (0.0%) | 0 (0.0%) |
| $22,500 to $24,999 | 0 (0.0%) | 0 (0.0%) |
| $25,000 to $29,999 | 17 (7.3%) | 21 (8.4%) |
| $30,000 to $34,999 | 14 (6.0%) | 0 (0.0%) |
| $35,000 to $39,999 | 0 (0.0%) | 0 (0.0%) |
| $40,000 to $44,999 | 8 (3.5%) | 0 (0.0%) |
| $45,000 to $49,999 | 0 (0.0%) | 19 (7.6%) |
| $50,000 to $54,999 | 0 (0.0%) | 14 (5.6%) |
| $55,000 to $64,999 | 11 (4.7%) | 0 (0.0%) |
| $65,000 to $74,999 | 7 (3.0%) | 0 (0.0%) |
| $75,000 to $99,999 | 45 (19.4%) | 16 (6.4%) |
| $100,000+ | 69 (29.7%) | 67 (26.8%) |
| Total | 232 (100.0%) | 250 (100.0%) |
Earnings by Sex by Educational Attainment in Ponderosa Pine
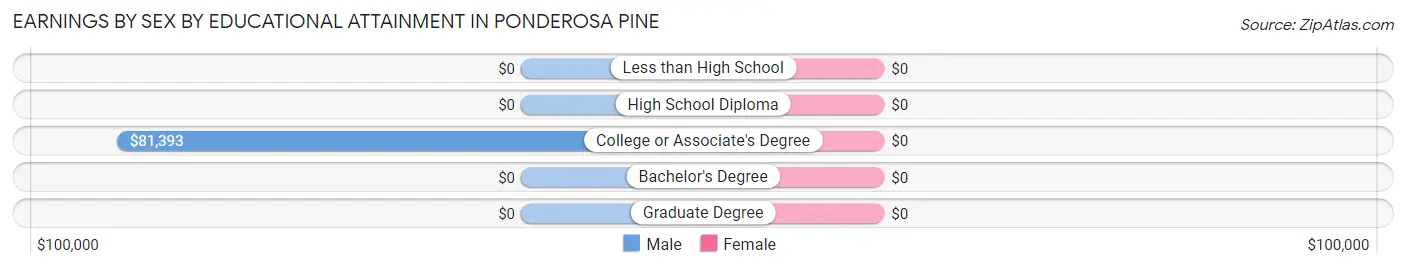
| Educational Attainment | Male Income | Female Income |
| Less than High School | - | - |
| High School Diploma | - | - |
| College or Associate's Degree | $81,393 | $0 |
| Bachelor's Degree | - | - |
| Graduate Degree | - | - |
| Total | $81,179 | $0 |
Family Income in Ponderosa Pine
Family Income Brackets in Ponderosa Pine
According to the Ponderosa Pine family income data, there are 116 families falling into the $75,000 to $99,999 income range, which is the most common income bracket and makes up 26.7% of all families.
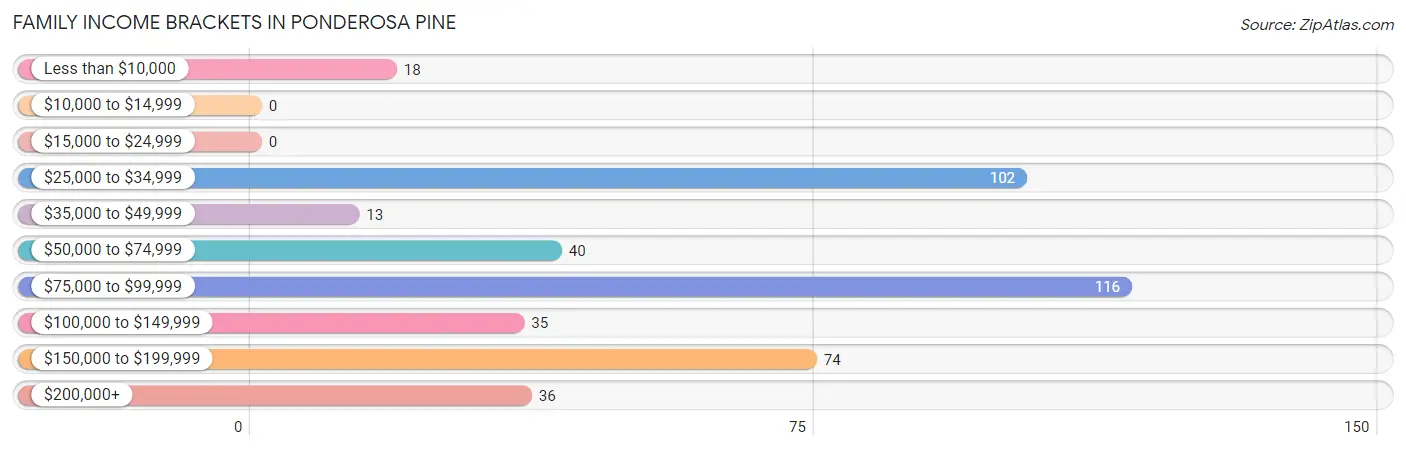
| Income Bracket | # Families | % Families |
| Less than $10,000 | 18 | 4.1% |
| $10,000 to $14,999 | 0 | 0.0% |
| $15,000 to $24,999 | 0 | 0.0% |
| $25,000 to $34,999 | 102 | 23.5% |
| $35,000 to $49,999 | 13 | 3.0% |
| $50,000 to $74,999 | 40 | 9.2% |
| $75,000 to $99,999 | 116 | 26.7% |
| $100,000 to $149,999 | 35 | 8.1% |
| $150,000 to $199,999 | 74 | 17.1% |
| $200,000+ | 36 | 8.3% |
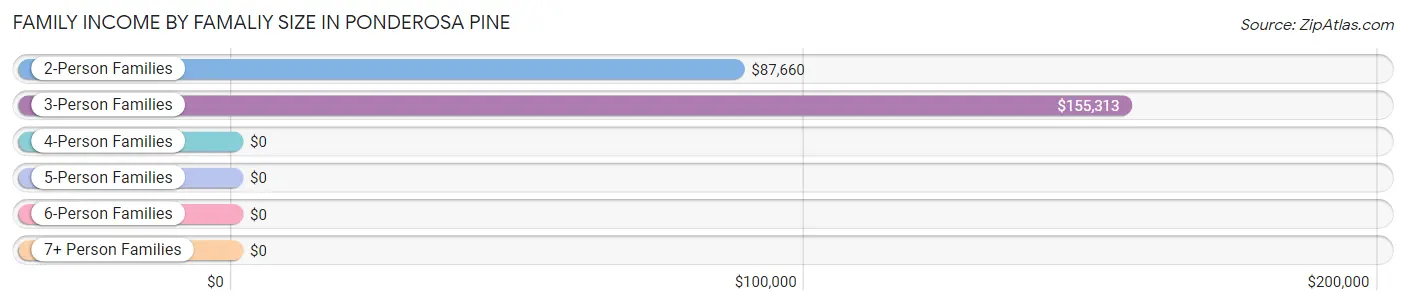
Family Income by Famaliy Size in Ponderosa Pine
3-person families (76 | 17.5%) account for the highest median family income in Ponderosa Pine with $155,313 per family, while 3-person families (76 | 17.5%) have the highest median income of $51,771 per family member.
| Income Bracket | # Families | Median Income |
| 2-Person Families | 312 (71.9%) | $87,660 |
| 3-Person Families | 76 (17.5%) | $155,313 |
| 4-Person Families | 12 (2.8%) | $0 |
| 5-Person Families | 20 (4.6%) | $0 |
| 6-Person Families | 14 (3.2%) | $0 |
| 7+ Person Families | 0 (0.0%) | $0 |
| Total | 434 (100.0%) | $88,429 |
Family Income by Number of Earners in Ponderosa Pine
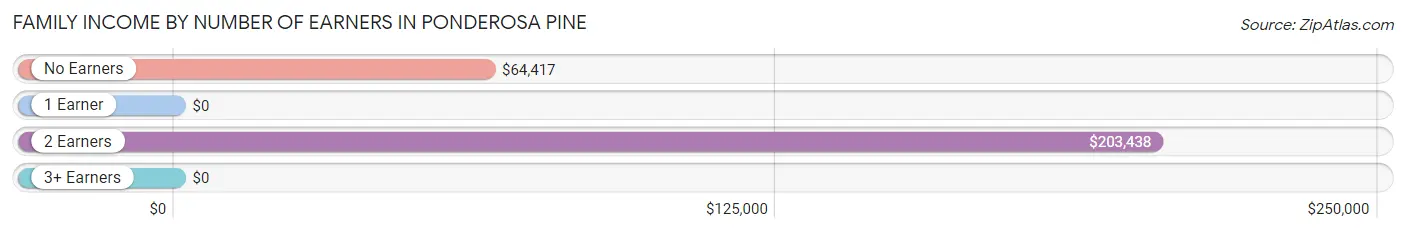
| Number of Earners | # Families | Median Income |
| No Earners | 233 (53.7%) | $64,417 |
| 1 Earner | 115 (26.5%) | $0 |
| 2 Earners | 63 (14.5%) | $203,438 |
| 3+ Earners | 23 (5.3%) | $0 |
| Total | 434 (100.0%) | $88,429 |
Household Income in Ponderosa Pine
Household Income Brackets in Ponderosa Pine
With 127 households falling in the category, the $75,000 to $99,999 income range is the most frequent in Ponderosa Pine, accounting for 23.1% of all households.
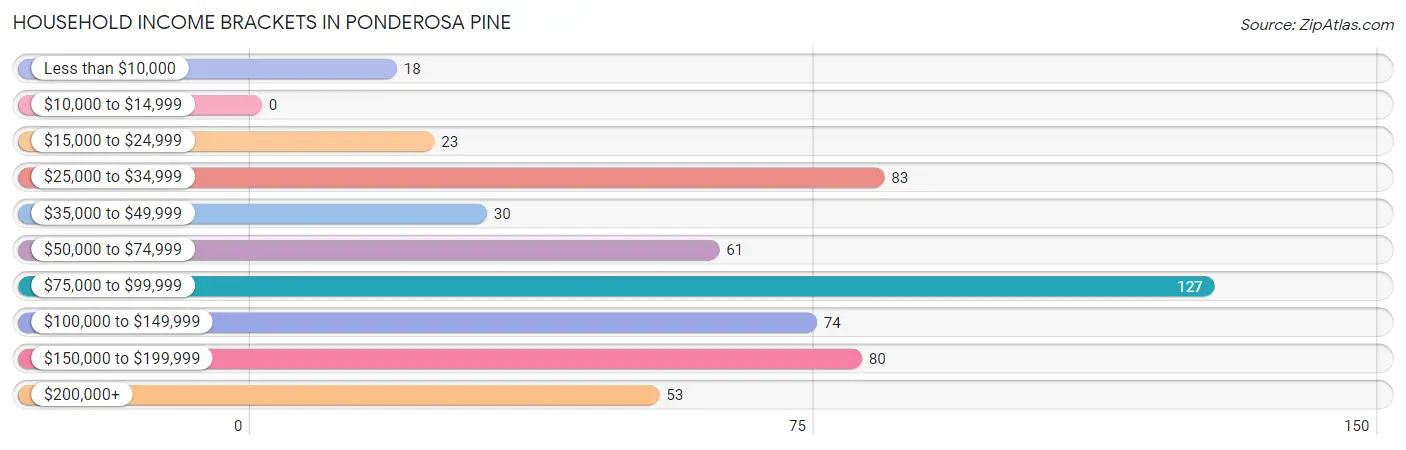
| Income Bracket | # Households | % Households |
| Less than $10,000 | 18 | 3.3% |
| $10,000 to $14,999 | 0 | 0.0% |
| $15,000 to $24,999 | 23 | 4.2% |
| $25,000 to $34,999 | 83 | 15.1% |
| $35,000 to $49,999 | 30 | 5.5% |
| $50,000 to $74,999 | 61 | 11.1% |
| $75,000 to $99,999 | 127 | 23.1% |
| $100,000 to $149,999 | 74 | 13.5% |
| $150,000 to $199,999 | 80 | 14.6% |
| $200,000+ | 53 | 9.7% |
Household Income by Householder Age in Ponderosa Pine
The median household income in Ponderosa Pine is $88,253, with the highest median household income of $89,647 found in the 45 to 64 years age bracket for the primary householder. A total of 278 households (50.6%) fall into this category. Meanwhile, the 15 to 24 years age bracket for the primary householder has the lowest median household income of $0, with 17 households (3.1%) in this group.
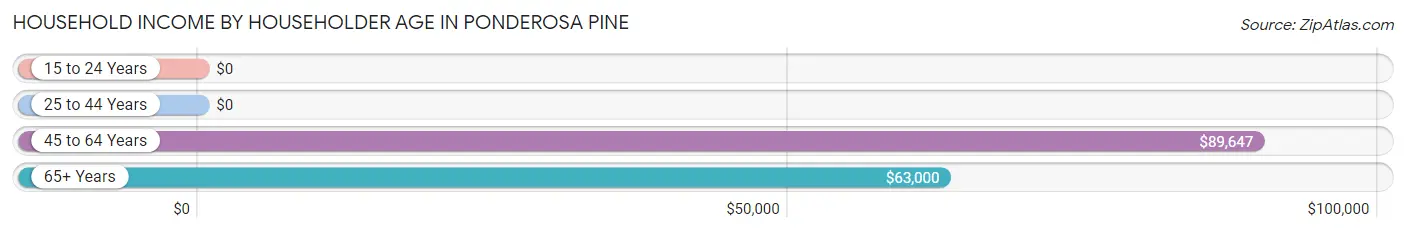
| Income Bracket | # Households | Median Income |
| 15 to 24 Years | 17 (3.1%) | $0 |
| 25 to 44 Years | 66 (12.0%) | $0 |
| 45 to 64 Years | 278 (50.6%) | $89,647 |
| 65+ Years | 188 (34.2%) | $63,000 |
| Total | 549 (100.0%) | $88,253 |
Poverty in Ponderosa Pine
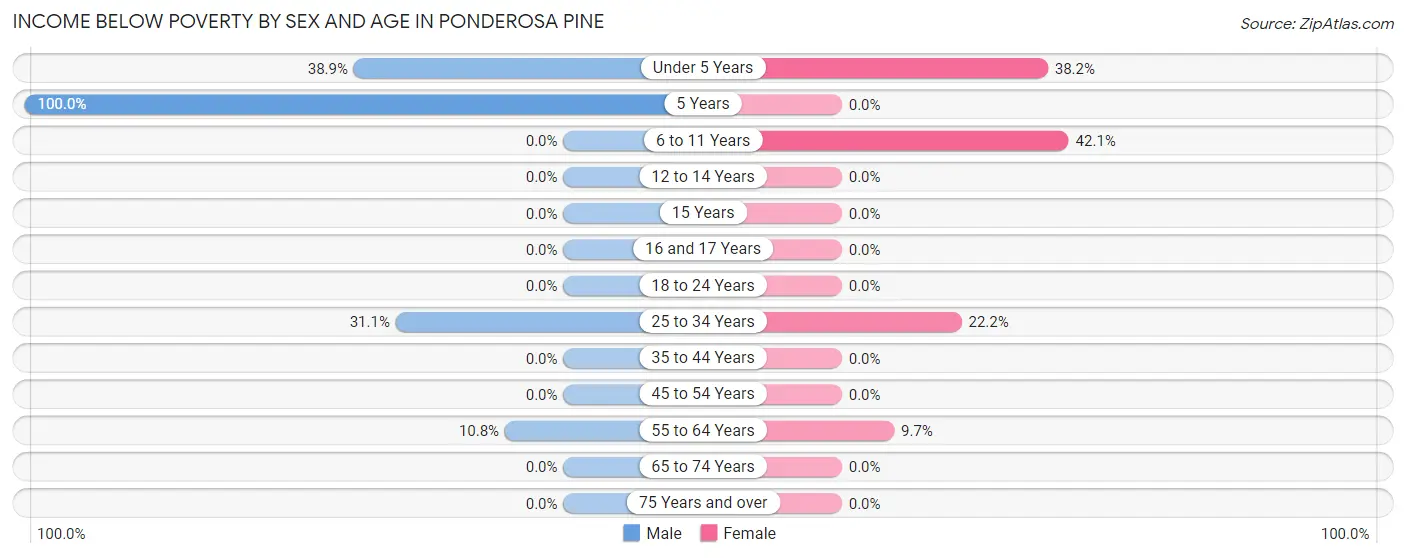
Income Below Poverty by Sex and Age in Ponderosa Pine
With 11.2% poverty level for males and 8.6% for females among the residents of Ponderosa Pine, 5 year old males and 6 to 11 year old females are the most vulnerable to poverty, with 15 males (100.0%) and 16 females (42.1%) in their respective age groups living below the poverty level.
| Age Bracket | Male | Female |
| Under 5 Years | 14 (38.9%) | 13 (38.2%) |
| 5 Years | 15 (100.0%) | 0 (0.0%) |
| 6 to 11 Years | 0 (0.0%) | 16 (42.1%) |
| 12 to 14 Years | 0 (0.0%) | 0 (0.0%) |
| 15 Years | 0 (0.0%) | 0 (0.0%) |
| 16 and 17 Years | 0 (0.0%) | 0 (0.0%) |
| 18 to 24 Years | 0 (0.0%) | 0 (0.0%) |
| 25 to 34 Years | 14 (31.1%) | 14 (22.2%) |
| 35 to 44 Years | 0 (0.0%) | 0 (0.0%) |
| 45 to 54 Years | 0 (0.0%) | 0 (0.0%) |
| 55 to 64 Years | 18 (10.8%) | 17 (9.7%) |
| 65 to 74 Years | 0 (0.0%) | 0 (0.0%) |
| 75 Years and over | 0 (0.0%) | 0 (0.0%) |
| Total | 61 (11.2%) | 60 (8.6%) |
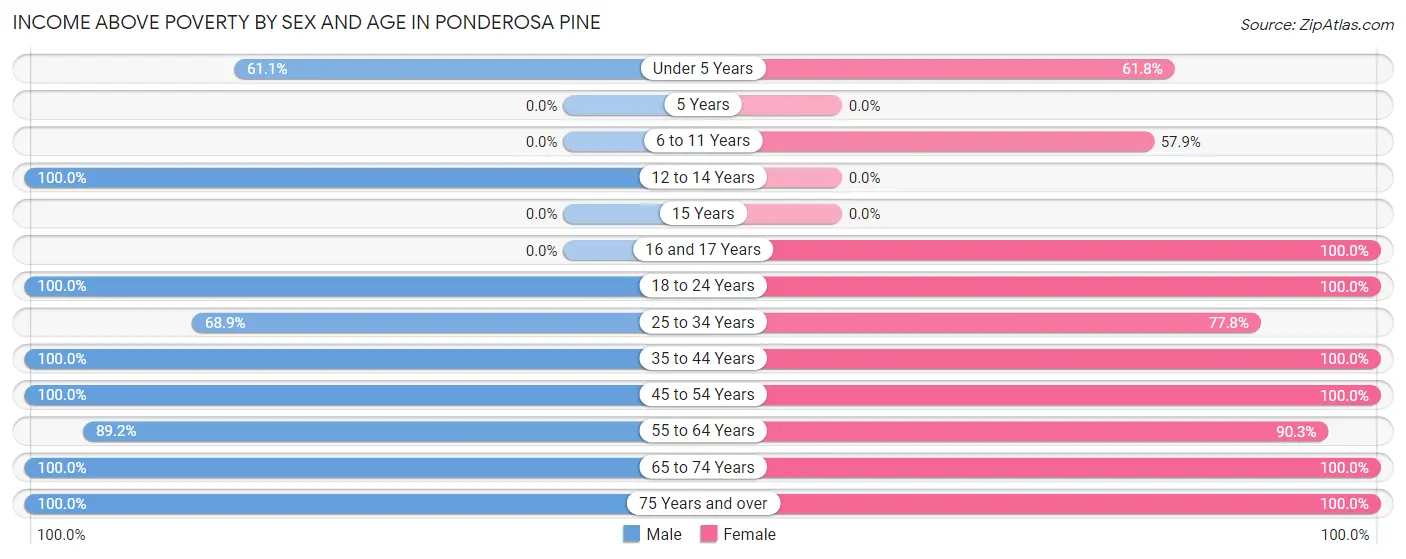
Income Above Poverty by Sex and Age in Ponderosa Pine
According to the poverty statistics in Ponderosa Pine, males aged 12 to 14 years and females aged 16 and 17 years are the age groups that are most secure financially, with 100.0% of males and 100.0% of females in these age groups living above the poverty line.
| Age Bracket | Male | Female |
| Under 5 Years | 22 (61.1%) | 21 (61.8%) |
| 5 Years | 0 (0.0%) | 0 (0.0%) |
| 6 to 11 Years | 0 (0.0%) | 22 (57.9%) |
| 12 to 14 Years | 18 (100.0%) | 0 (0.0%) |
| 15 Years | 0 (0.0%) | 0 (0.0%) |
| 16 and 17 Years | 0 (0.0%) | 41 (100.0%) |
| 18 to 24 Years | 37 (100.0%) | 78 (100.0%) |
| 25 to 34 Years | 31 (68.9%) | 49 (77.8%) |
| 35 to 44 Years | 23 (100.0%) | 15 (100.0%) |
| 45 to 54 Years | 60 (100.0%) | 81 (100.0%) |
| 55 to 64 Years | 148 (89.2%) | 158 (90.3%) |
| 65 to 74 Years | 125 (100.0%) | 158 (100.0%) |
| 75 Years and over | 20 (100.0%) | 18 (100.0%) |
| Total | 484 (88.8%) | 641 (91.4%) |
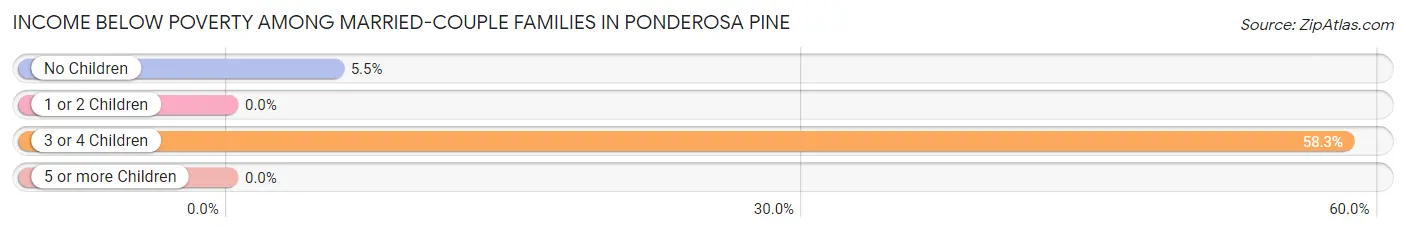
Income Below Poverty Among Married-Couple Families in Ponderosa Pine
The poverty statistics for married-couple families in Ponderosa Pine show that 8.1% or 32 of the total 394 families live below the poverty line. Families with 3 or 4 children have the highest poverty rate of 58.3%, comprising of 14 families. On the other hand, families with 1 or 2 children have the lowest poverty rate of 0.0%, which includes 0 families.
| Children | Above Poverty | Below Poverty |
| No Children | 308 (94.5%) | 18 (5.5%) |
| 1 or 2 Children | 44 (100.0%) | 0 (0.0%) |
| 3 or 4 Children | 10 (41.7%) | 14 (58.3%) |
| 5 or more Children | 0 (0.0%) | 0 (0.0%) |
| Total | 362 (91.9%) | 32 (8.1%) |
Income Below Poverty Among Single-Parent Households in Ponderosa Pine
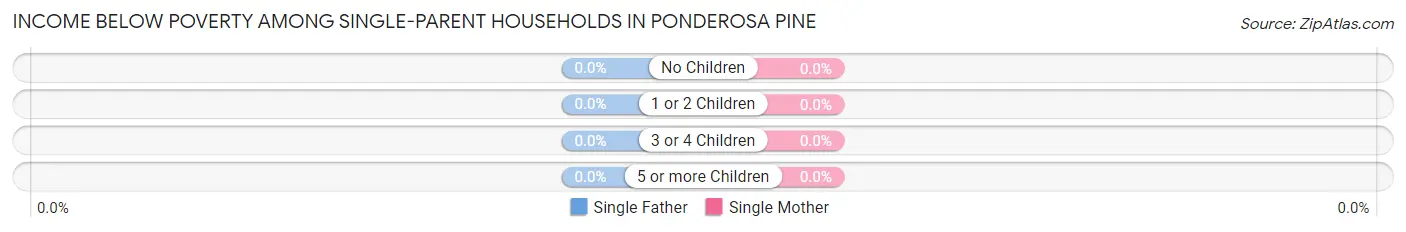
| Children | Single Father | Single Mother |
| No Children | 0 (0.0%) | 0 (0.0%) |
| 1 or 2 Children | 0 (0.0%) | 0 (0.0%) |
| 3 or 4 Children | 0 (0.0%) | 0 (0.0%) |
| 5 or more Children | 0 (0.0%) | 0 (0.0%) |
| Total | 0 (0.0%) | 0 (0.0%) |
Income Below Poverty Among Married-Couple vs Single-Parent Households in Ponderosa Pine
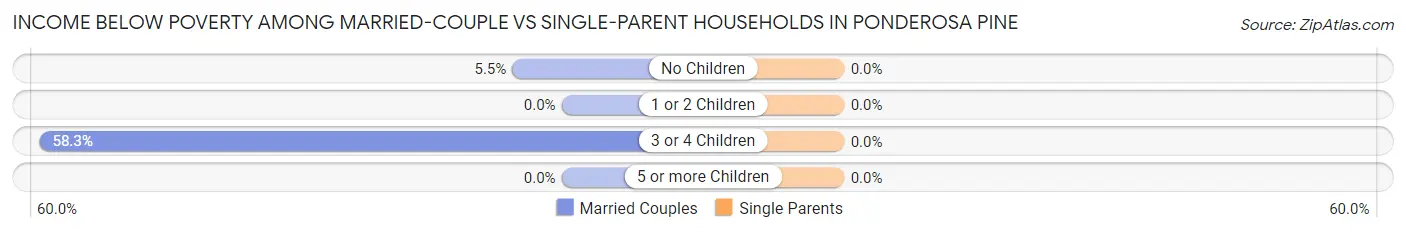
| Children | Married-Couple Families | Single-Parent Households |
| No Children | 18 (5.5%) | 0 (0.0%) |
| 1 or 2 Children | 0 (0.0%) | 0 (0.0%) |
| 3 or 4 Children | 14 (58.3%) | 0 (0.0%) |
| 5 or more Children | 0 (0.0%) | 0 (0.0%) |
| Total | 32 (8.1%) | 0 (0.0%) |
Employment Characteristics in Ponderosa Pine
Employment by Class of Employer in Ponderosa Pine
Among the 387 employed individuals in Ponderosa Pine, private company employees (206 | 53.2%), not-for-profit organizations (61 | 15.8%), and state government employees (41 | 10.6%) make up the most common classes of employment.
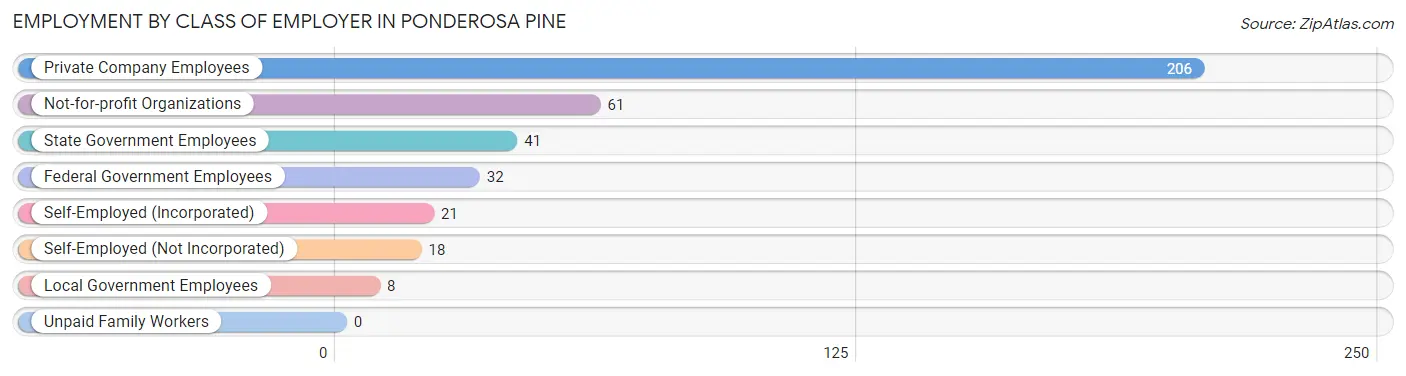
| Employer Class | # Employees | % Employees |
| Private Company Employees | 206 | 53.2% |
| Self-Employed (Incorporated) | 21 | 5.4% |
| Self-Employed (Not Incorporated) | 18 | 4.6% |
| Not-for-profit Organizations | 61 | 15.8% |
| Local Government Employees | 8 | 2.1% |
| State Government Employees | 41 | 10.6% |
| Federal Government Employees | 32 | 8.3% |
| Unpaid Family Workers | 0 | 0.0% |
| Total | 387 | 100.0% |
Employment Status by Age in Ponderosa Pine
According to the labor force statistics for Ponderosa Pine, out of the total population over 16 years of age (1,105), 39.5% or 436 individuals are in the labor force, with 11.4% or 50 of them unemployed. The age group with the highest labor force participation rate is 30 to 34 years, with 100.0% or 80 individuals in the labor force. Within the labor force, the 45 to 54 years age range has the highest percentage of unemployed individuals, with 27.6% or 24 of them being unemployed.
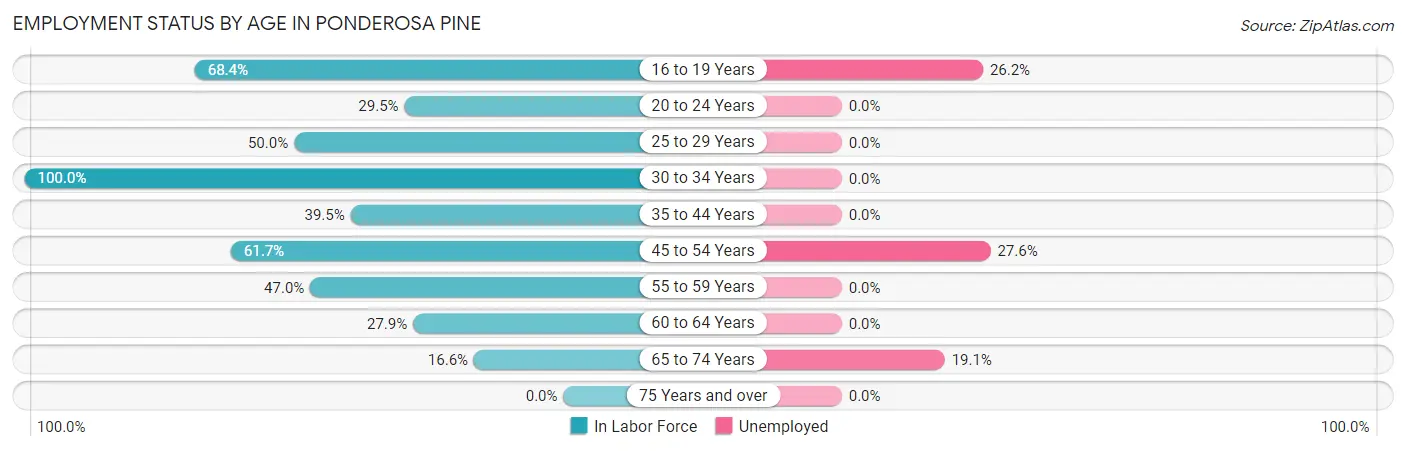
| Age Bracket | In Labor Force | Unemployed |
| 16 to 19 Years | 65 (68.4%) | 17 (26.2%) |
| 20 to 24 Years | 18 (29.5%) | 0 (0.0%) |
| 25 to 29 Years | 14 (50.0%) | 0 (0.0%) |
| 30 to 34 Years | 80 (100.0%) | 0 (0.0%) |
| 35 to 44 Years | 15 (39.5%) | 0 (0.0%) |
| 45 to 54 Years | 87 (61.7%) | 24 (27.6%) |
| 55 to 59 Years | 39 (47.0%) | 0 (0.0%) |
| 60 to 64 Years | 72 (27.9%) | 0 (0.0%) |
| 65 to 74 Years | 47 (16.6%) | 9 (19.1%) |
| 75 Years and over | 0 (0.0%) | 0 (0.0%) |
| Total | 436 (39.5%) | 50 (11.4%) |
Employment Status by Educational Attainment in Ponderosa Pine
According to labor force statistics for Ponderosa Pine, 48.9% of individuals (307) out of the total population between 25 and 64 years of age (628) are in the labor force, with 7.8% or 24 of them being unemployed. The group with the highest labor force participation rate are those with the educational attainment of less than high school, with 100.0% or 7 individuals in the labor force. Within the labor force, individuals with college / associate degree education have the highest percentage of unemployment, with 22.2% or 24 of them being unemployed.
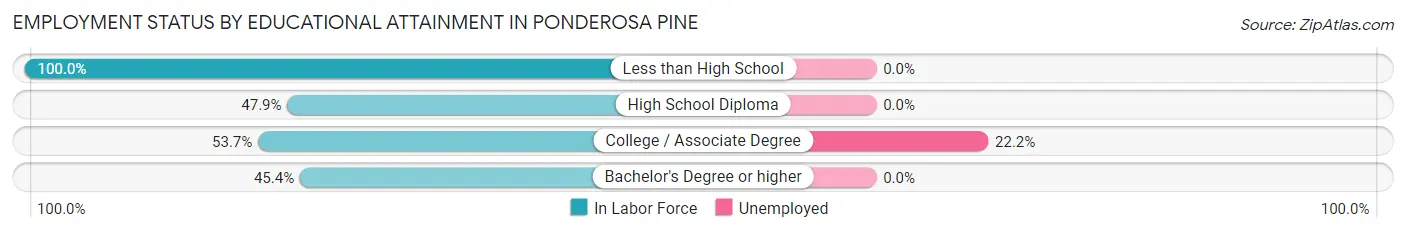
| Educational Attainment | In Labor Force | Unemployed |
| Less than High School | 7 (100.0%) | 0 (0.0%) |
| High School Diploma | 23 (47.9%) | 0 (0.0%) |
| College / Associate Degree | 108 (53.7%) | 45 (22.2%) |
| Bachelor's Degree or higher | 169 (45.4%) | 0 (0.0%) |
| Total | 307 (48.9%) | 49 (7.8%) |
Employment Occupations by Sex in Ponderosa Pine
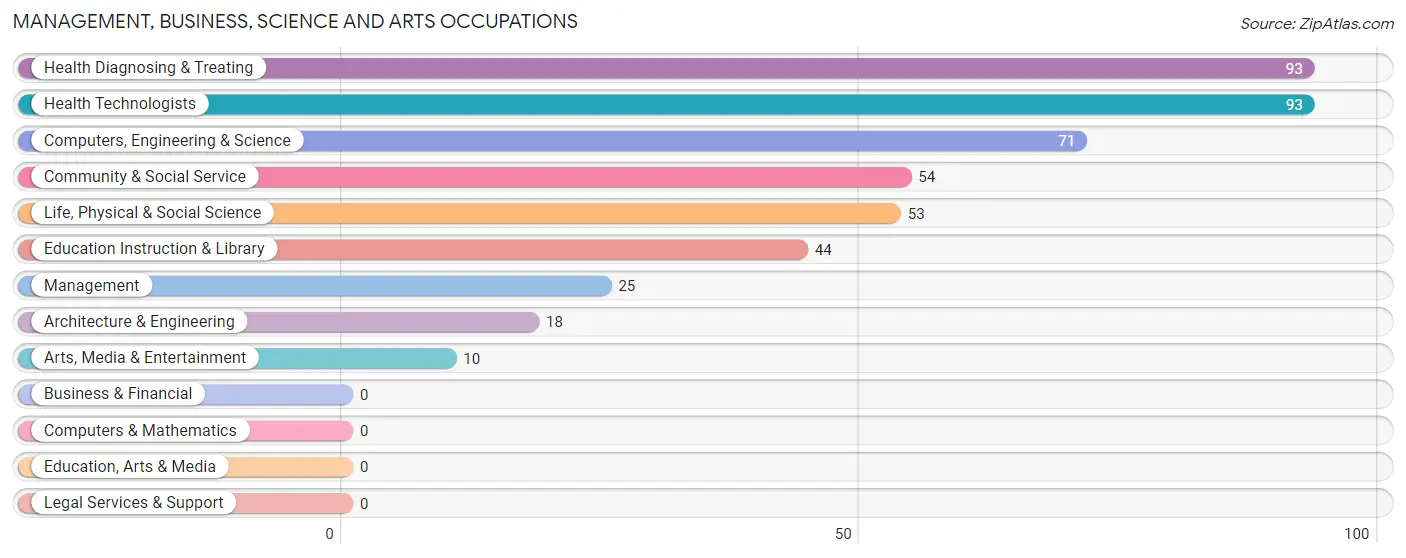
Management, Business, Science and Arts Occupations
The most common Management, Business, Science and Arts occupations in Ponderosa Pine are Health Diagnosing & Treating (93 | 24.0%), Health Technologists (93 | 24.0%), Computers, Engineering & Science (71 | 18.3%), Community & Social Service (54 | 14.0%), and Life, Physical & Social Science (53 | 13.7%).
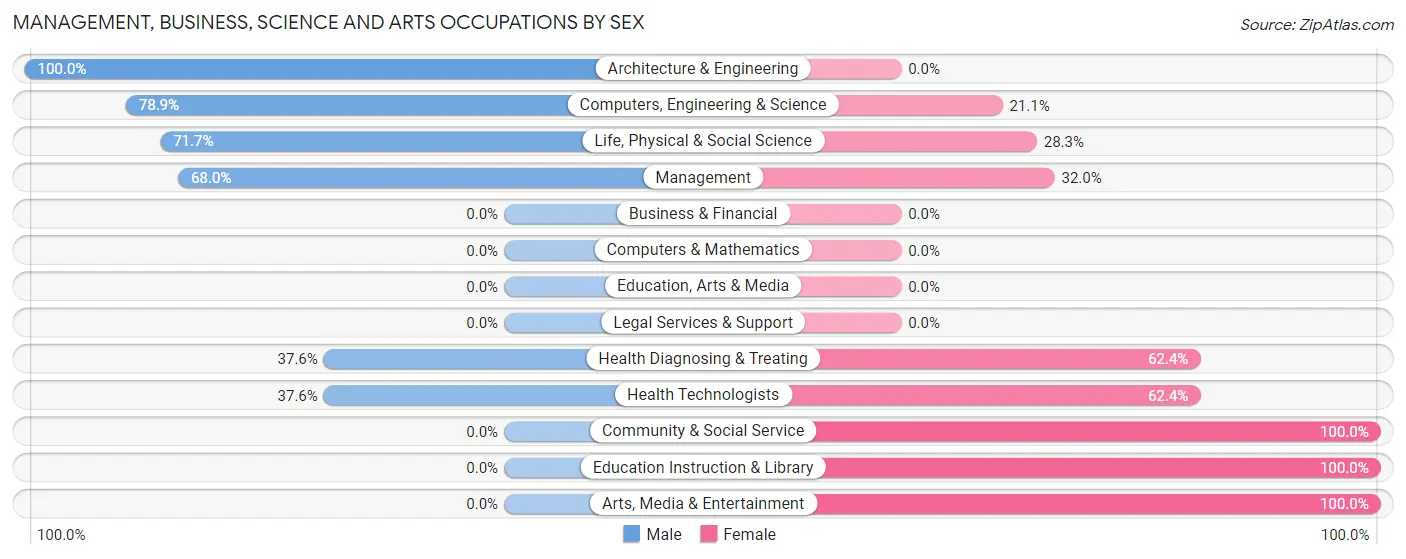
Management, Business, Science and Arts Occupations by Sex
Within the Management, Business, Science and Arts occupations in Ponderosa Pine, the most male-oriented occupations are Architecture & Engineering (100.0%), Computers, Engineering & Science (78.9%), and Life, Physical & Social Science (71.7%), while the most female-oriented occupations are Community & Social Service (100.0%), Education Instruction & Library (100.0%), and Arts, Media & Entertainment (100.0%).
| Occupation | Male | Female |
| Management | 17 (68.0%) | 8 (32.0%) |
| Business & Financial | 0 (0.0%) | 0 (0.0%) |
| Computers, Engineering & Science | 56 (78.9%) | 15 (21.1%) |
| Computers & Mathematics | 0 (0.0%) | 0 (0.0%) |
| Architecture & Engineering | 18 (100.0%) | 0 (0.0%) |
| Life, Physical & Social Science | 38 (71.7%) | 15 (28.3%) |
| Community & Social Service | 0 (0.0%) | 54 (100.0%) |
| Education, Arts & Media | 0 (0.0%) | 0 (0.0%) |
| Legal Services & Support | 0 (0.0%) | 0 (0.0%) |
| Education Instruction & Library | 0 (0.0%) | 44 (100.0%) |
| Arts, Media & Entertainment | 0 (0.0%) | 10 (100.0%) |
| Health Diagnosing & Treating | 35 (37.6%) | 58 (62.4%) |
| Health Technologists | 35 (37.6%) | 58 (62.4%) |
| Total (Category) | 108 (44.4%) | 135 (55.6%) |
| Total (Overall) | 198 (51.2%) | 189 (48.8%) |
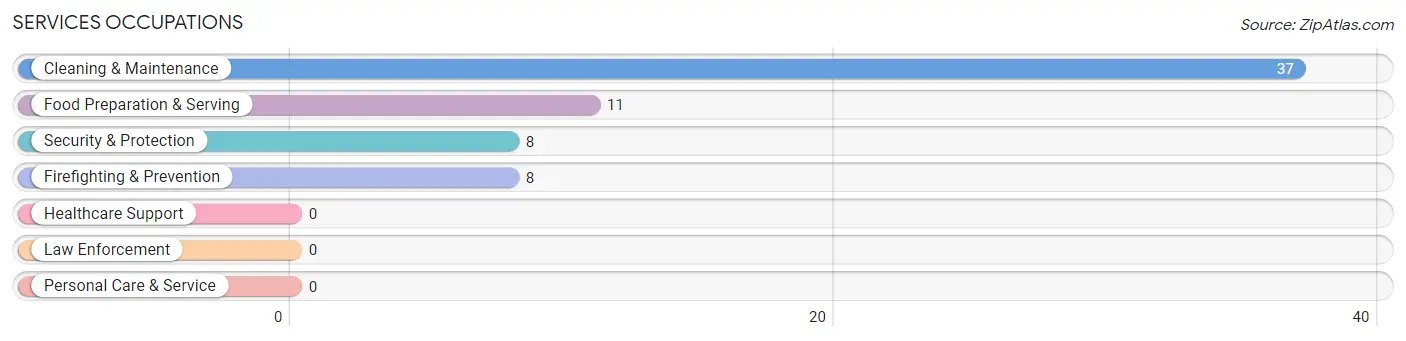
Services Occupations
The most common Services occupations in Ponderosa Pine are Cleaning & Maintenance (37 | 9.6%), Food Preparation & Serving (11 | 2.8%), Security & Protection (8 | 2.1%), and Firefighting & Prevention (8 | 2.1%).
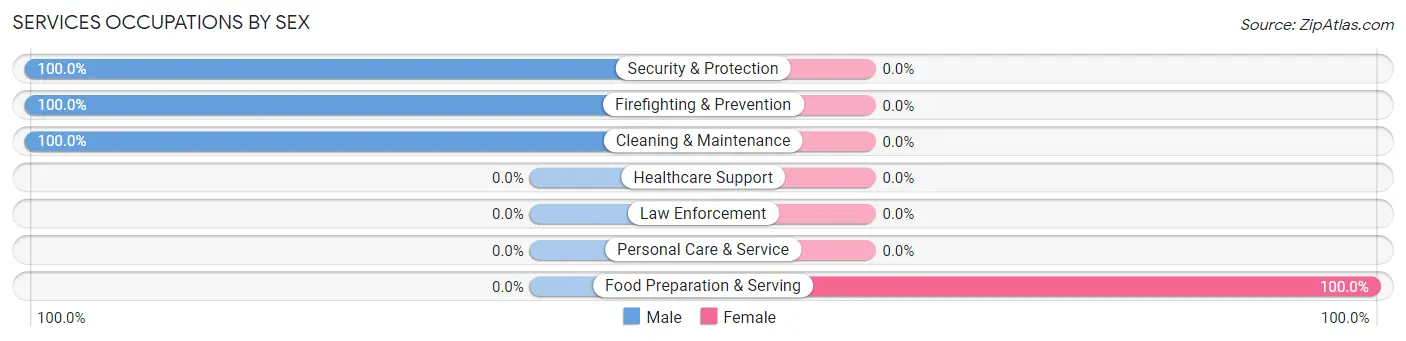
Services Occupations by Sex
| Occupation | Male | Female |
| Healthcare Support | 0 (0.0%) | 0 (0.0%) |
| Security & Protection | 8 (100.0%) | 0 (0.0%) |
| Firefighting & Prevention | 8 (100.0%) | 0 (0.0%) |
| Law Enforcement | 0 (0.0%) | 0 (0.0%) |
| Food Preparation & Serving | 0 (0.0%) | 11 (100.0%) |
| Cleaning & Maintenance | 37 (100.0%) | 0 (0.0%) |
| Personal Care & Service | 0 (0.0%) | 0 (0.0%) |
| Total (Category) | 45 (80.4%) | 11 (19.6%) |
| Total (Overall) | 198 (51.2%) | 189 (48.8%) |
Sales and Office Occupations
The most common Sales and Office occupations in Ponderosa Pine are , and Sales & Related (43 | 11.1%).
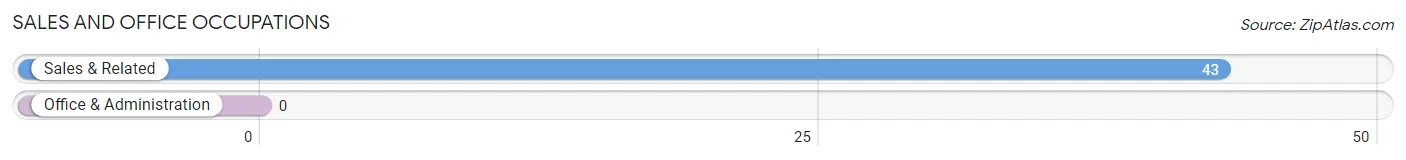
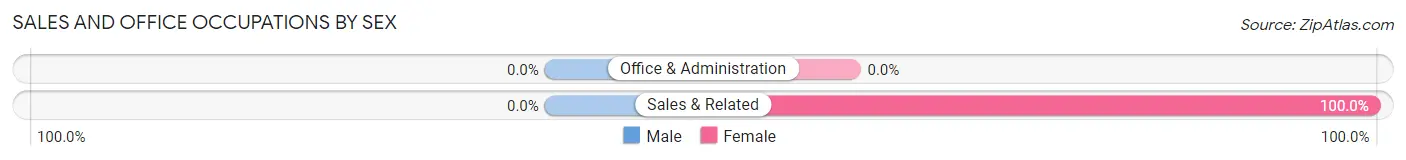
Sales and Office Occupations by Sex
| Occupation | Male | Female |
| Sales & Related | 0 (0.0%) | 43 (100.0%) |
| Office & Administration | 0 (0.0%) | 0 (0.0%) |
| Total (Category) | 0 (0.0%) | 43 (100.0%) |
| Total (Overall) | 198 (51.2%) | 189 (48.8%) |
Natural Resources, Construction and Maintenance Occupations
The most common Natural Resources, Construction and Maintenance occupations in Ponderosa Pine are , and Installation, Maintenance & Repair (38 | 9.8%).
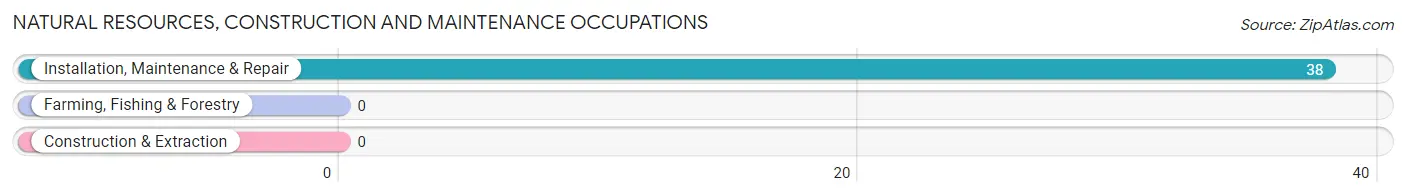
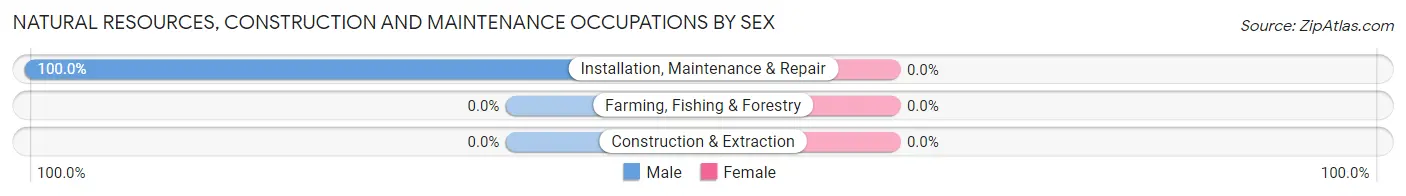
Natural Resources, Construction and Maintenance Occupations by Sex
| Occupation | Male | Female |
| Farming, Fishing & Forestry | 0 (0.0%) | 0 (0.0%) |
| Construction & Extraction | 0 (0.0%) | 0 (0.0%) |
| Installation, Maintenance & Repair | 38 (100.0%) | 0 (0.0%) |
| Total (Category) | 38 (100.0%) | 0 (0.0%) |
| Total (Overall) | 198 (51.2%) | 189 (48.8%) |
Production, Transportation and Moving Occupations
The most common Production, Transportation and Moving occupations in Ponderosa Pine are , and Production (7 | 1.8%).
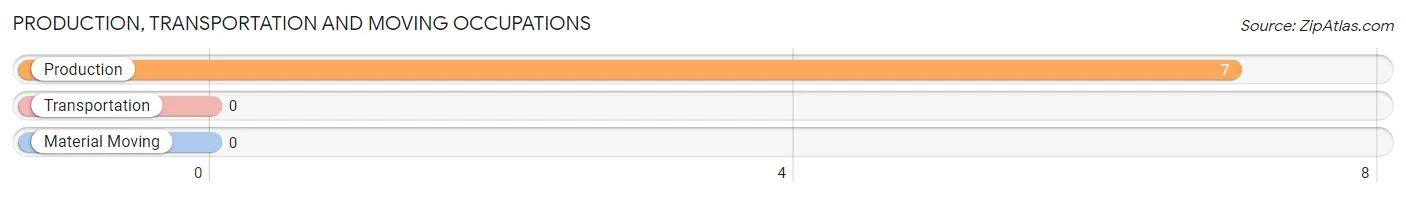
Production, Transportation and Moving Occupations by Sex
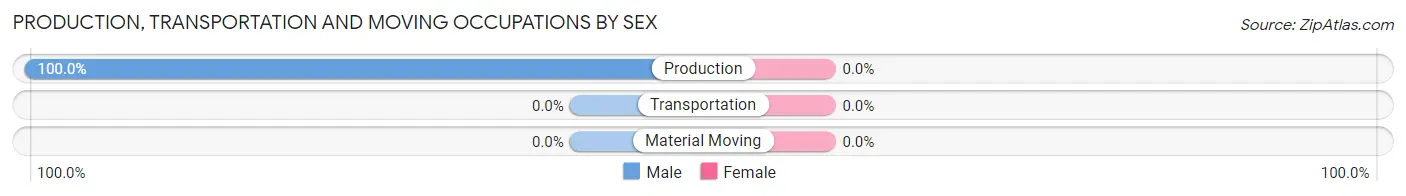
| Occupation | Male | Female |
| Production | 7 (100.0%) | 0 (0.0%) |
| Transportation | 0 (0.0%) | 0 (0.0%) |
| Material Moving | 0 (0.0%) | 0 (0.0%) |
| Total (Category) | 7 (100.0%) | 0 (0.0%) |
| Total (Overall) | 198 (51.2%) | 189 (48.8%) |
Employment Industries by Sex in Ponderosa Pine
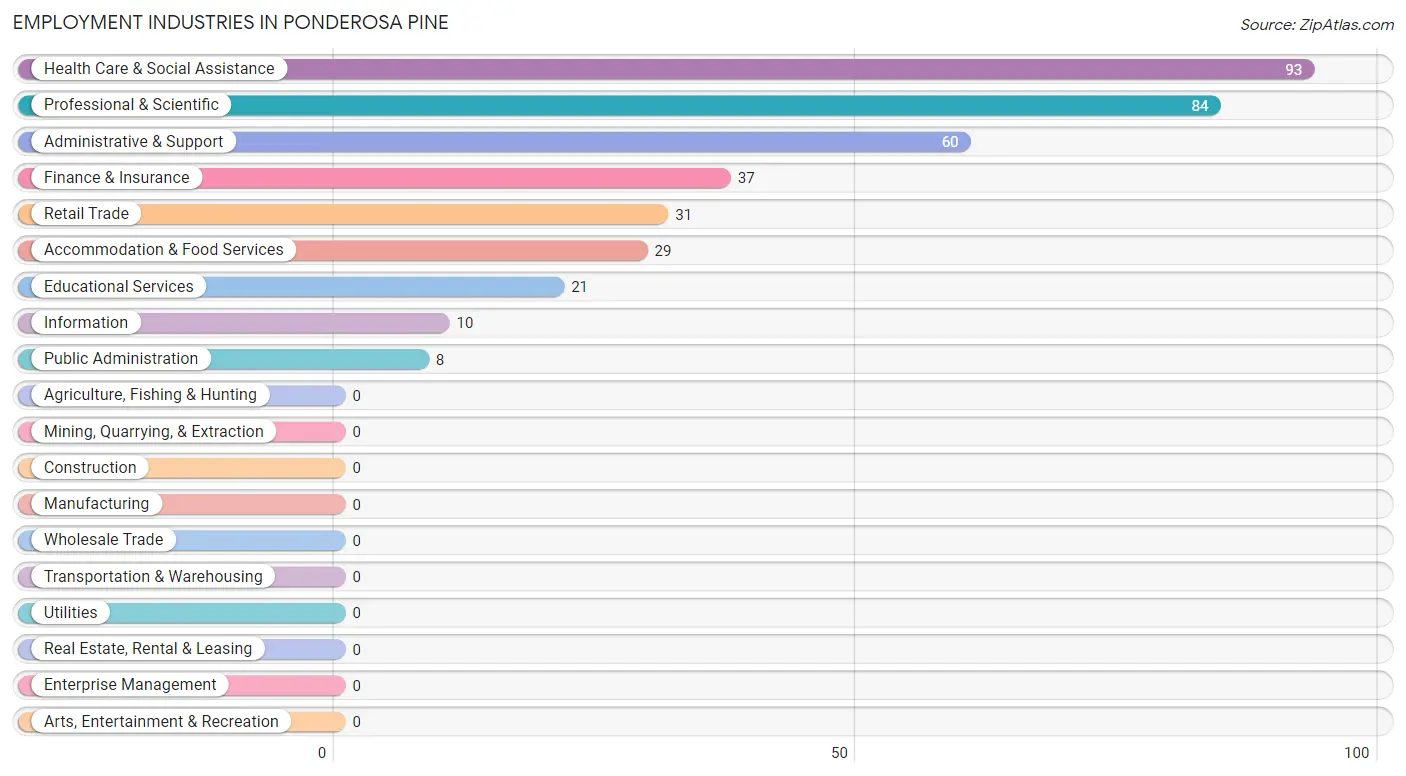
Employment Industries in Ponderosa Pine
The major employment industries in Ponderosa Pine include Health Care & Social Assistance (93 | 24.0%), Professional & Scientific (84 | 21.7%), Administrative & Support (60 | 15.5%), Finance & Insurance (37 | 9.6%), and Retail Trade (31 | 8.0%).
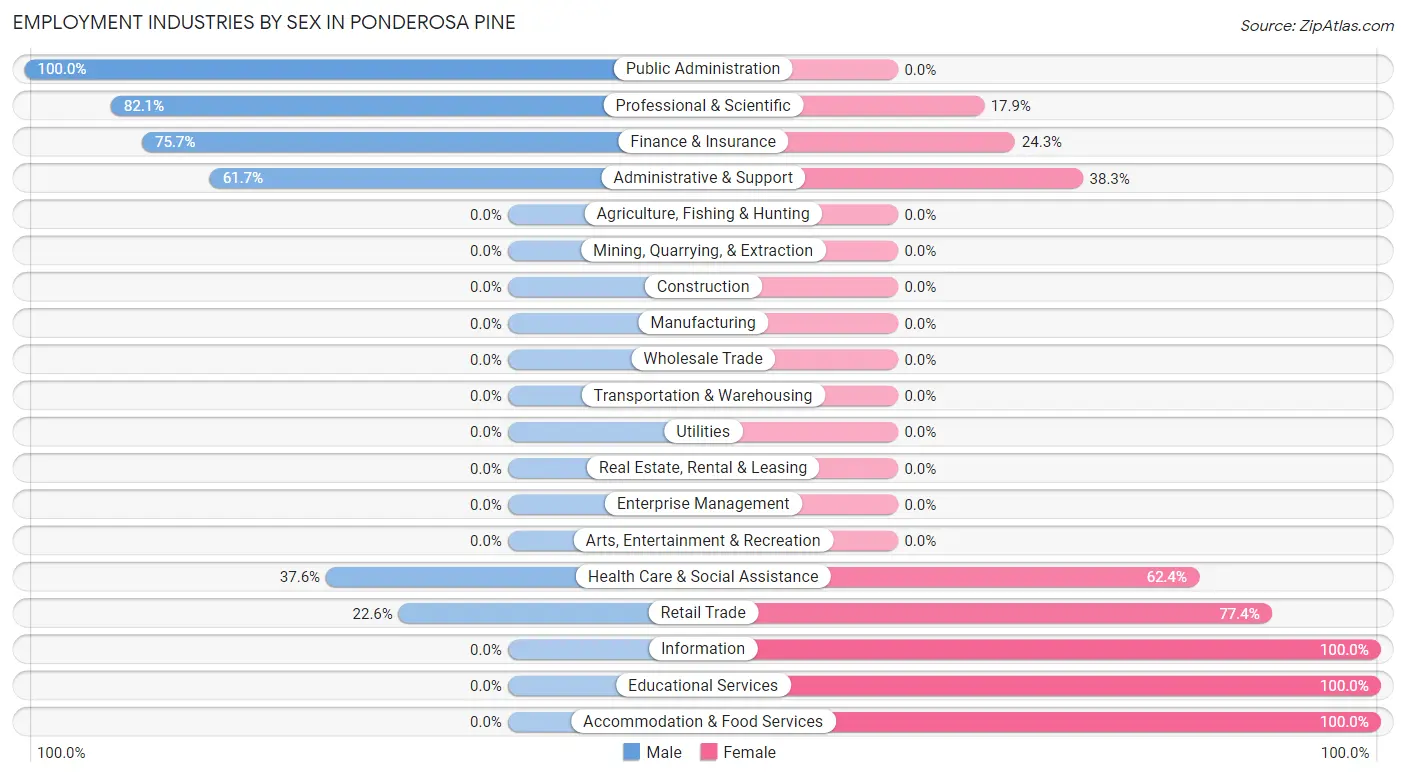
Employment Industries by Sex in Ponderosa Pine
The Ponderosa Pine industries that see more men than women are Public Administration (100.0%), Professional & Scientific (82.1%), and Finance & Insurance (75.7%), whereas the industries that tend to have a higher number of women are Information (100.0%), Educational Services (100.0%), and Accommodation & Food Services (100.0%).
| Industry | Male | Female |
| Agriculture, Fishing & Hunting | 0 (0.0%) | 0 (0.0%) |
| Mining, Quarrying, & Extraction | 0 (0.0%) | 0 (0.0%) |
| Construction | 0 (0.0%) | 0 (0.0%) |
| Manufacturing | 0 (0.0%) | 0 (0.0%) |
| Wholesale Trade | 0 (0.0%) | 0 (0.0%) |
| Retail Trade | 7 (22.6%) | 24 (77.4%) |
| Transportation & Warehousing | 0 (0.0%) | 0 (0.0%) |
| Utilities | 0 (0.0%) | 0 (0.0%) |
| Information | 0 (0.0%) | 10 (100.0%) |
| Finance & Insurance | 28 (75.7%) | 9 (24.3%) |
| Real Estate, Rental & Leasing | 0 (0.0%) | 0 (0.0%) |
| Professional & Scientific | 69 (82.1%) | 15 (17.9%) |
| Enterprise Management | 0 (0.0%) | 0 (0.0%) |
| Administrative & Support | 37 (61.7%) | 23 (38.3%) |
| Educational Services | 0 (0.0%) | 21 (100.0%) |
| Health Care & Social Assistance | 35 (37.6%) | 58 (62.4%) |
| Arts, Entertainment & Recreation | 0 (0.0%) | 0 (0.0%) |
| Accommodation & Food Services | 0 (0.0%) | 29 (100.0%) |
| Public Administration | 8 (100.0%) | 0 (0.0%) |
| Total | 198 (51.2%) | 189 (48.8%) |
Education in Ponderosa Pine
School Enrollment in Ponderosa Pine
The most common levels of schooling among the 269 students in Ponderosa Pine are college / undergraduate (69 | 25.7%), high school (58 | 21.6%), and nursery / preschool (43 | 16.0%).
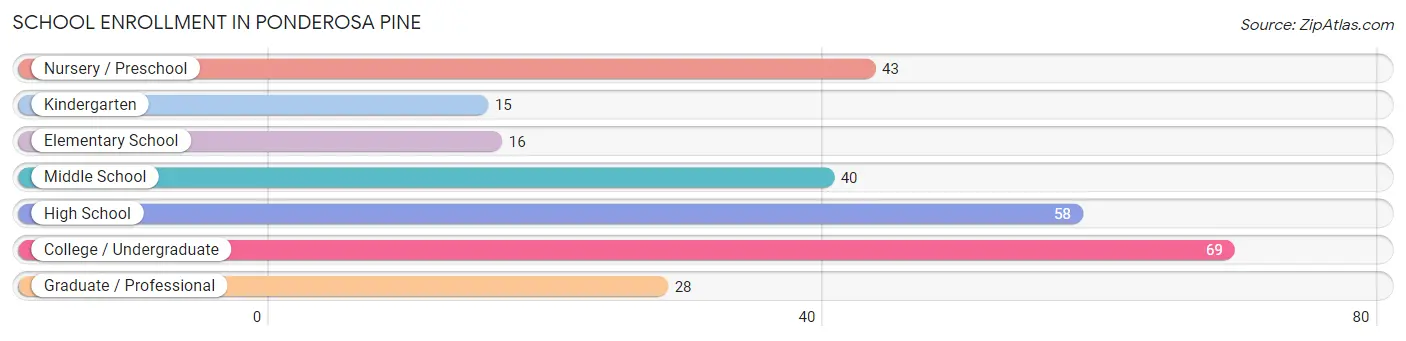
| School Level | # Students | % Students |
| Nursery / Preschool | 43 | 16.0% |
| Kindergarten | 15 | 5.6% |
| Elementary School | 16 | 5.9% |
| Middle School | 40 | 14.9% |
| High School | 58 | 21.6% |
| College / Undergraduate | 69 | 25.7% |
| Graduate / Professional | 28 | 10.4% |
| Total | 269 | 100.0% |
School Enrollment by Age by Funding Source in Ponderosa Pine
Out of a total of 269 students who are enrolled in schools in Ponderosa Pine, 52 (19.3%) attend a private institution, while the remaining 217 (80.7%) are enrolled in public schools. The age group of 5 to 9 year old has the highest likelihood of being enrolled in private schools, with 31 (100.0% in the age bracket) enrolled. Conversely, the age group of 10 to 14 year olds has the lowest likelihood of being enrolled in a private school, with 40 (100.0% in the age bracket) attending a public institution.
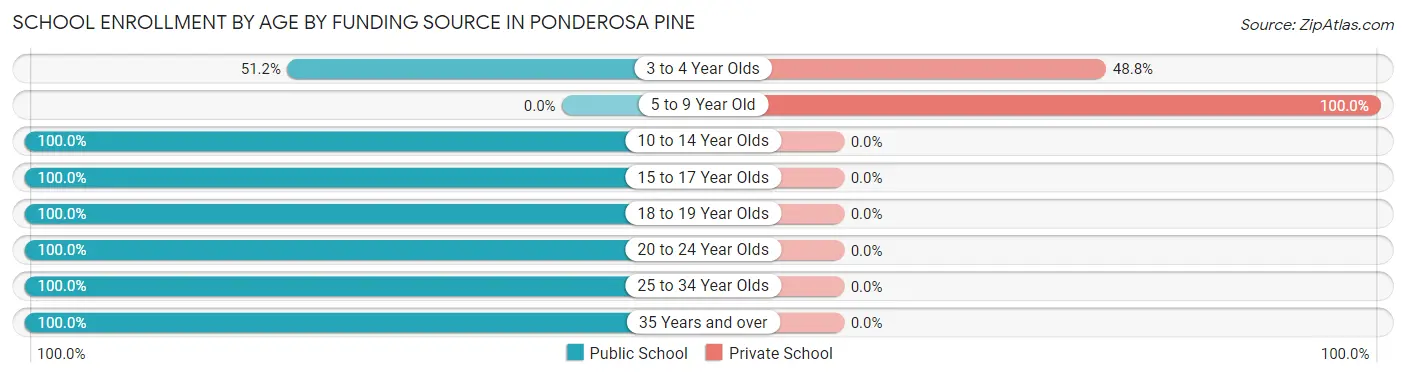
| Age Bracket | Public School | Private School |
| 3 to 4 Year Olds | 22 (51.2%) | 21 (48.8%) |
| 5 to 9 Year Old | 0 (0.0%) | 31 (100.0%) |
| 10 to 14 Year Olds | 40 (100.0%) | 0 (0.0%) |
| 15 to 17 Year Olds | 41 (100.0%) | 0 (0.0%) |
| 18 to 19 Year Olds | 17 (100.0%) | 0 (0.0%) |
| 20 to 24 Year Olds | 61 (100.0%) | 0 (0.0%) |
| 25 to 34 Year Olds | 28 (100.0%) | 0 (0.0%) |
| 35 Years and over | 8 (100.0%) | 0 (0.0%) |
| Total | 217 (80.7%) | 52 (19.3%) |
Educational Attainment by Field of Study in Ponderosa Pine
Bio, nature & agricultural (151 | 27.8%), education (81 | 14.9%), engineering (71 | 13.1%), science & technology (64 | 11.8%), and physical & health sciences (41 | 7.5%) are the most common fields of study among 544 individuals in Ponderosa Pine who have obtained a bachelor's degree or higher.
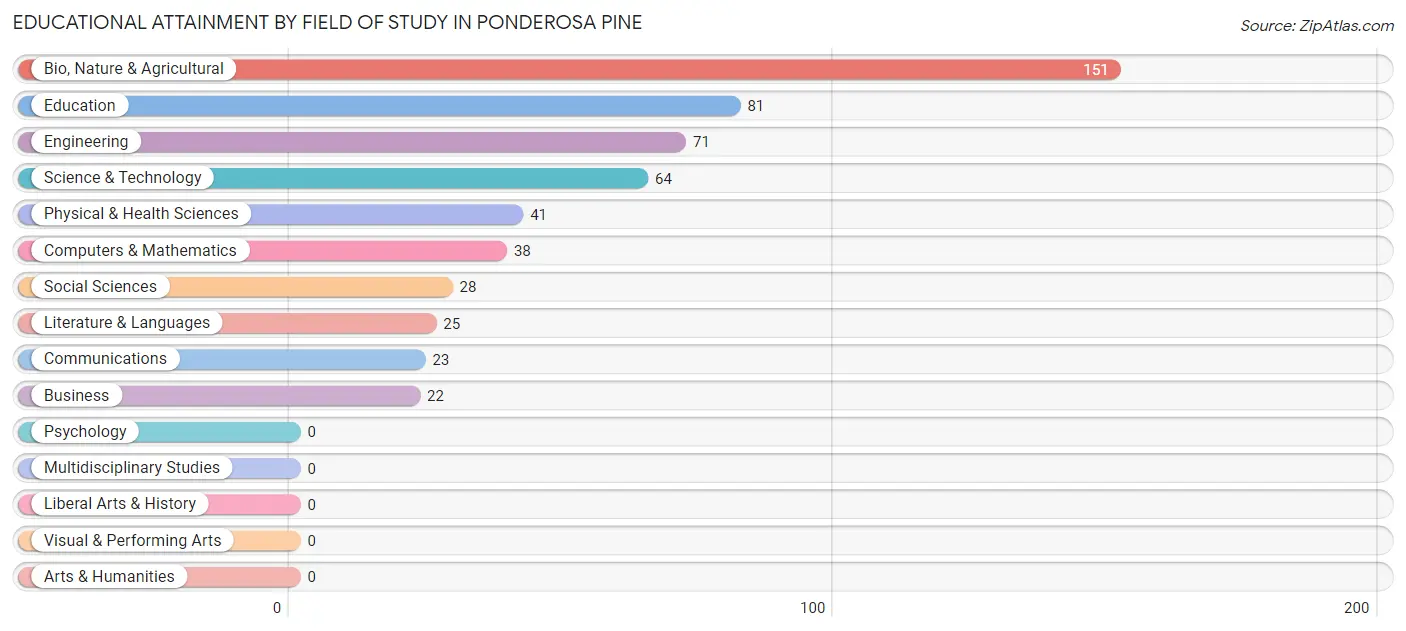
| Field of Study | # Graduates | % Graduates |
| Computers & Mathematics | 38 | 7.0% |
| Bio, Nature & Agricultural | 151 | 27.8% |
| Physical & Health Sciences | 41 | 7.5% |
| Psychology | 0 | 0.0% |
| Social Sciences | 28 | 5.1% |
| Engineering | 71 | 13.1% |
| Multidisciplinary Studies | 0 | 0.0% |
| Science & Technology | 64 | 11.8% |
| Business | 22 | 4.0% |
| Education | 81 | 14.9% |
| Literature & Languages | 25 | 4.6% |
| Liberal Arts & History | 0 | 0.0% |
| Visual & Performing Arts | 0 | 0.0% |
| Communications | 23 | 4.2% |
| Arts & Humanities | 0 | 0.0% |
| Total | 544 | 100.0% |
Transportation & Commute in Ponderosa Pine
Vehicle Availability by Sex in Ponderosa Pine
The most prevalent vehicle ownership categories in Ponderosa Pine are males with 3 vehicles (98, accounting for 49.5%) and females with 3 vehicles (49, making up 51.8%).
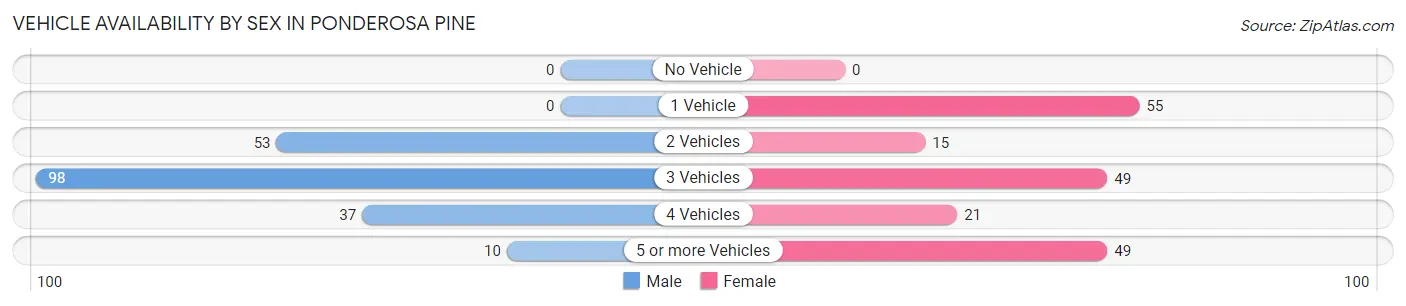
| Vehicles Available | Male | Female |
| No Vehicle | 0 (0.0%) | 0 (0.0%) |
| 1 Vehicle | 0 (0.0%) | 55 (29.1%) |
| 2 Vehicles | 53 (26.8%) | 15 (7.9%) |
| 3 Vehicles | 98 (49.5%) | 49 (25.9%) |
| 4 Vehicles | 37 (18.7%) | 21 (11.1%) |
| 5 or more Vehicles | 10 (5.1%) | 49 (25.9%) |
| Total | 198 (100.0%) | 189 (100.0%) |
Commute Time in Ponderosa Pine
The most frequently occuring commute durations in Ponderosa Pine are 30 to 34 minutes (104 commuters, 29.1%), 35 to 39 minutes (90 commuters, 25.2%), and 45 to 59 minutes (47 commuters, 13.2%).
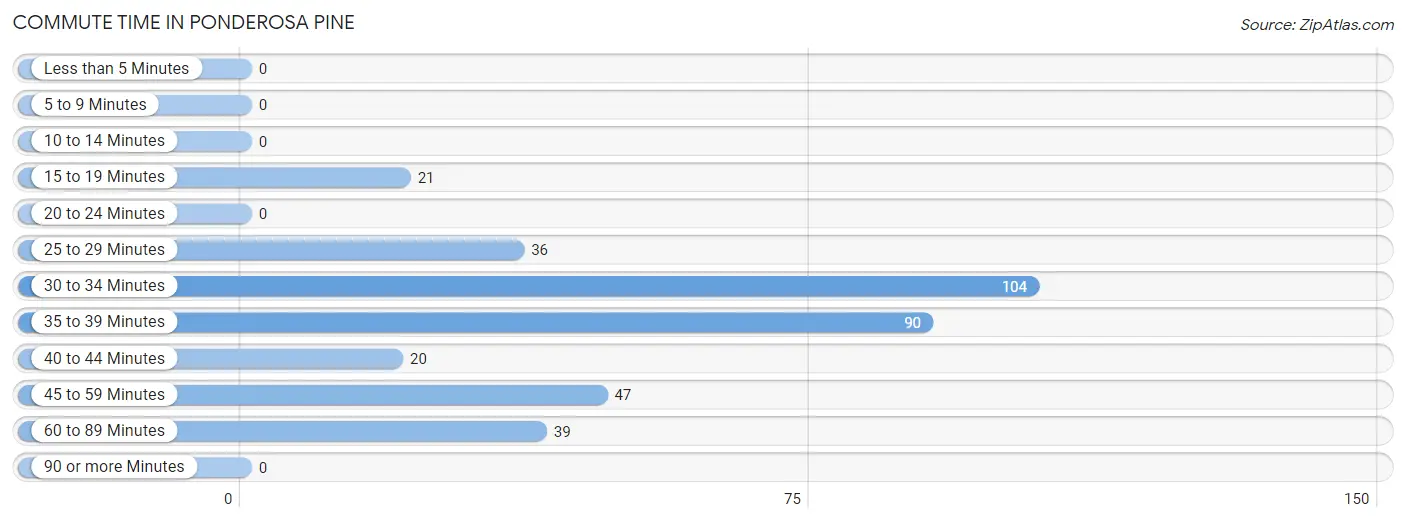
| Commute Time | # Commuters | % Commuters |
| Less than 5 Minutes | 0 | 0.0% |
| 5 to 9 Minutes | 0 | 0.0% |
| 10 to 14 Minutes | 0 | 0.0% |
| 15 to 19 Minutes | 21 | 5.9% |
| 20 to 24 Minutes | 0 | 0.0% |
| 25 to 29 Minutes | 36 | 10.1% |
| 30 to 34 Minutes | 104 | 29.1% |
| 35 to 39 Minutes | 90 | 25.2% |
| 40 to 44 Minutes | 20 | 5.6% |
| 45 to 59 Minutes | 47 | 13.2% |
| 60 to 89 Minutes | 39 | 10.9% |
| 90 or more Minutes | 0 | 0.0% |
Commute Time by Sex in Ponderosa Pine
The most common commute times in Ponderosa Pine are 35 to 39 minutes (52 commuters, 26.3%) for males and 30 to 34 minutes (62 commuters, 39.0%) for females.
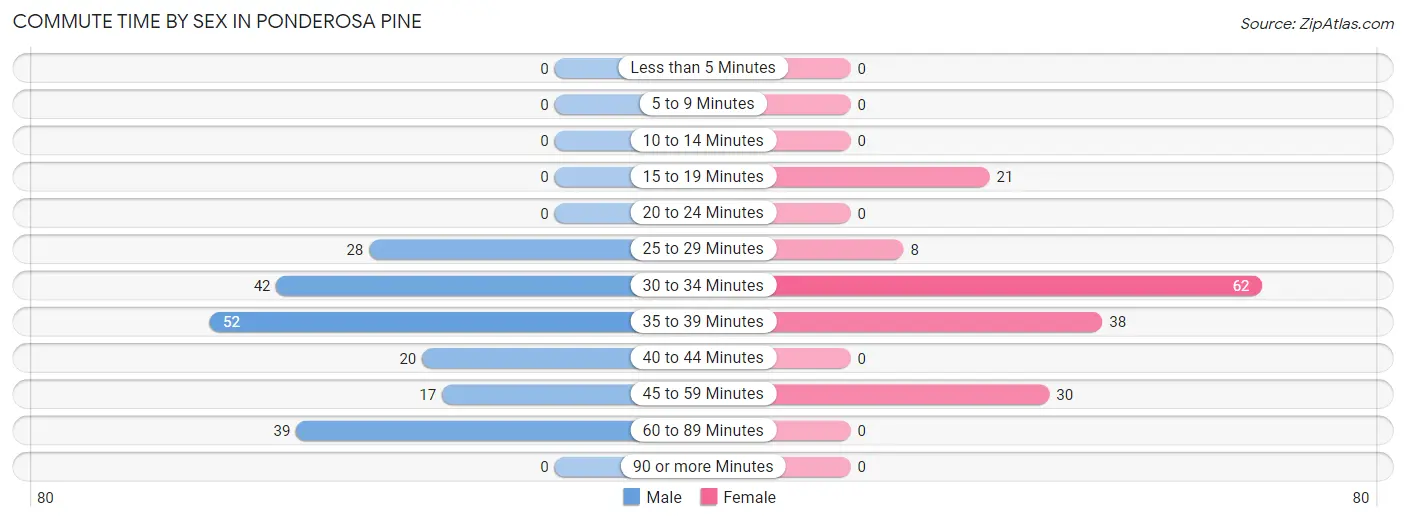
| Commute Time | Male | Female |
| Less than 5 Minutes | 0 (0.0%) | 0 (0.0%) |
| 5 to 9 Minutes | 0 (0.0%) | 0 (0.0%) |
| 10 to 14 Minutes | 0 (0.0%) | 0 (0.0%) |
| 15 to 19 Minutes | 0 (0.0%) | 21 (13.2%) |
| 20 to 24 Minutes | 0 (0.0%) | 0 (0.0%) |
| 25 to 29 Minutes | 28 (14.1%) | 8 (5.0%) |
| 30 to 34 Minutes | 42 (21.2%) | 62 (39.0%) |
| 35 to 39 Minutes | 52 (26.3%) | 38 (23.9%) |
| 40 to 44 Minutes | 20 (10.1%) | 0 (0.0%) |
| 45 to 59 Minutes | 17 (8.6%) | 30 (18.9%) |
| 60 to 89 Minutes | 39 (19.7%) | 0 (0.0%) |
| 90 or more Minutes | 0 (0.0%) | 0 (0.0%) |
Time of Departure to Work by Sex in Ponderosa Pine
The most frequent times of departure to work in Ponderosa Pine are 6:30 AM to 6:59 AM (66, 33.3%) for males and 4:00 PM to 11:59 PM (66, 41.5%) for females.
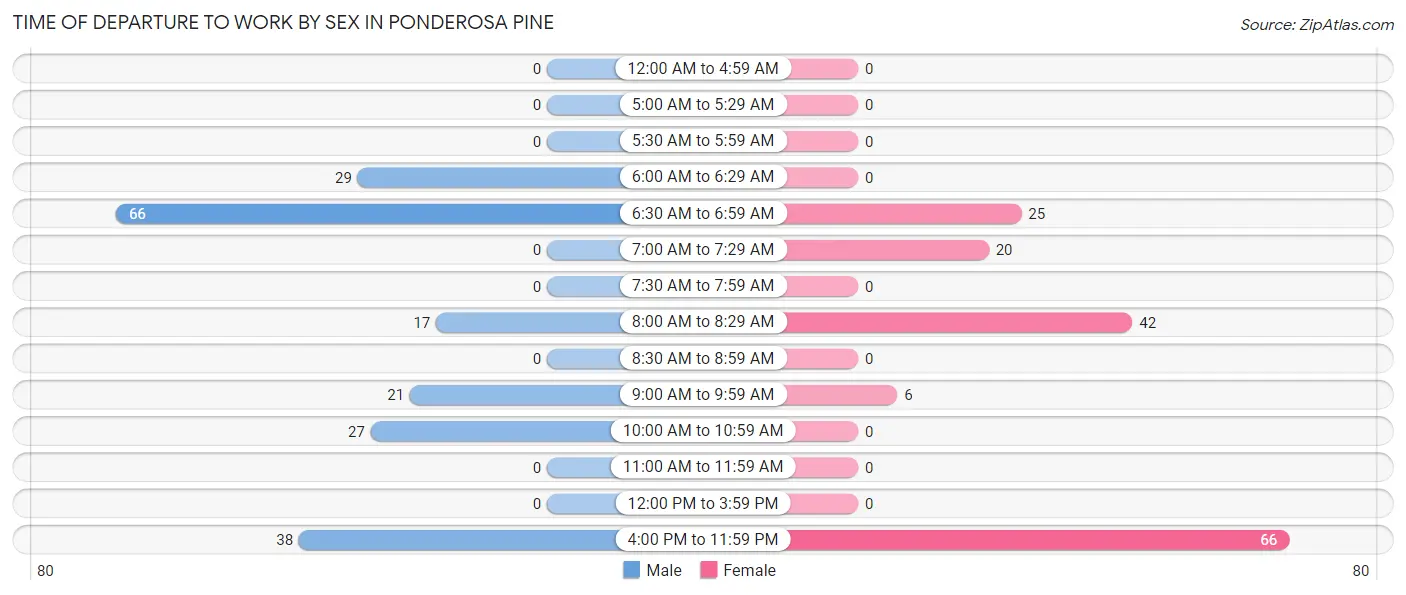
| Time of Departure | Male | Female |
| 12:00 AM to 4:59 AM | 0 (0.0%) | 0 (0.0%) |
| 5:00 AM to 5:29 AM | 0 (0.0%) | 0 (0.0%) |
| 5:30 AM to 5:59 AM | 0 (0.0%) | 0 (0.0%) |
| 6:00 AM to 6:29 AM | 29 (14.6%) | 0 (0.0%) |
| 6:30 AM to 6:59 AM | 66 (33.3%) | 25 (15.7%) |
| 7:00 AM to 7:29 AM | 0 (0.0%) | 20 (12.6%) |
| 7:30 AM to 7:59 AM | 0 (0.0%) | 0 (0.0%) |
| 8:00 AM to 8:29 AM | 17 (8.6%) | 42 (26.4%) |
| 8:30 AM to 8:59 AM | 0 (0.0%) | 0 (0.0%) |
| 9:00 AM to 9:59 AM | 21 (10.6%) | 6 (3.8%) |
| 10:00 AM to 10:59 AM | 27 (13.6%) | 0 (0.0%) |
| 11:00 AM to 11:59 AM | 0 (0.0%) | 0 (0.0%) |
| 12:00 PM to 3:59 PM | 0 (0.0%) | 0 (0.0%) |
| 4:00 PM to 11:59 PM | 38 (19.2%) | 66 (41.5%) |
| Total | 198 (100.0%) | 159 (100.0%) |
Housing Occupancy in Ponderosa Pine
Occupancy by Ownership in Ponderosa Pine
Of the total 549 dwellings in Ponderosa Pine, owner-occupied units account for 513 (93.4%), while renter-occupied units make up 36 (6.6%).
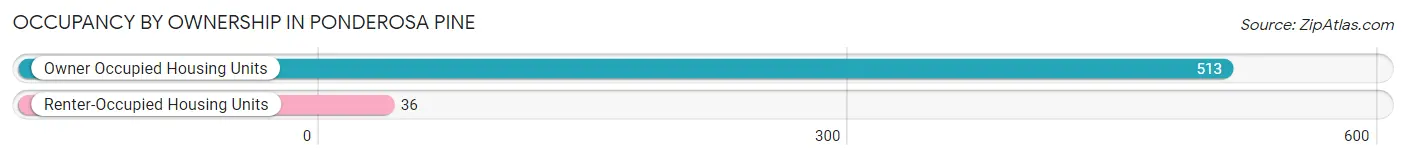
| Occupancy | # Housing Units | % Housing Units |
| Owner Occupied Housing Units | 513 | 93.4% |
| Renter-Occupied Housing Units | 36 | 6.6% |
| Total Occupied Housing Units | 549 | 100.0% |
Occupancy by Household Size in Ponderosa Pine
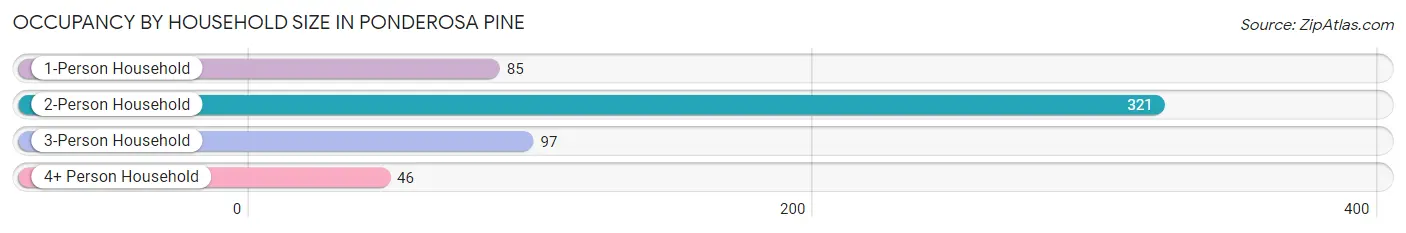
| Household Size | # Housing Units | % Housing Units |
| 1-Person Household | 85 | 15.5% |
| 2-Person Household | 321 | 58.5% |
| 3-Person Household | 97 | 17.7% |
| 4+ Person Household | 46 | 8.4% |
| Total Housing Units | 549 | 100.0% |
Occupancy by Ownership by Household Size in Ponderosa Pine
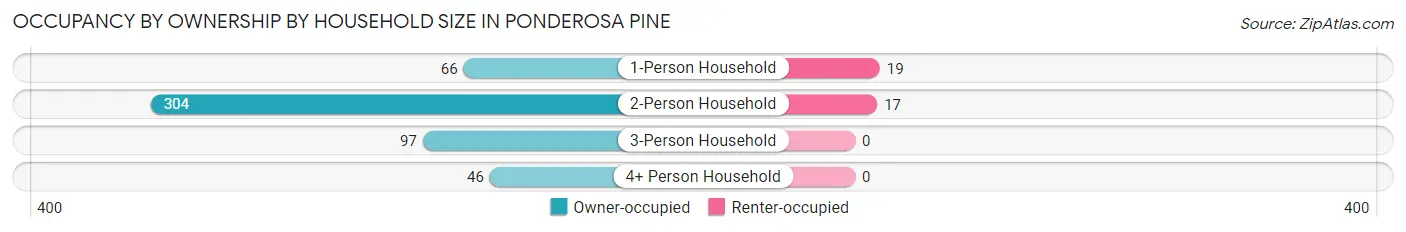
| Household Size | Owner-occupied | Renter-occupied |
| 1-Person Household | 66 (77.6%) | 19 (22.4%) |
| 2-Person Household | 304 (94.7%) | 17 (5.3%) |
| 3-Person Household | 97 (100.0%) | 0 (0.0%) |
| 4+ Person Household | 46 (100.0%) | 0 (0.0%) |
| Total Housing Units | 513 (93.4%) | 36 (6.6%) |
Occupancy by Educational Attainment in Ponderosa Pine
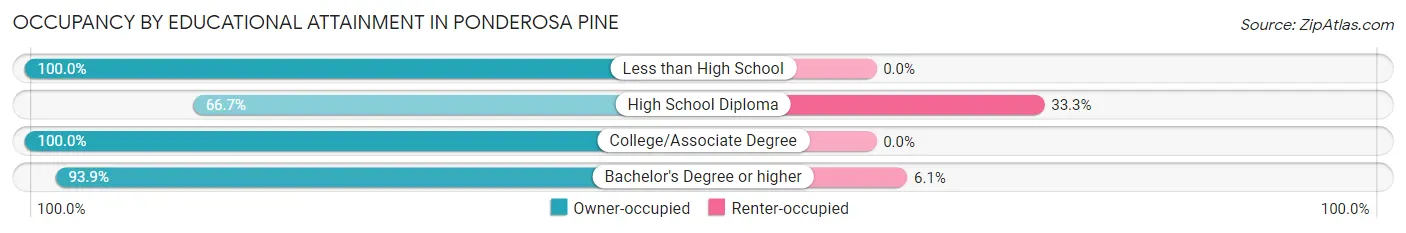
| Household Size | Owner-occupied | Renter-occupied |
| Less than High School | 7 (100.0%) | 0 (0.0%) |
| High School Diploma | 34 (66.7%) | 17 (33.3%) |
| College/Associate Degree | 181 (100.0%) | 0 (0.0%) |
| Bachelor's Degree or higher | 291 (93.9%) | 19 (6.1%) |
Occupancy by Age of Householder in Ponderosa Pine
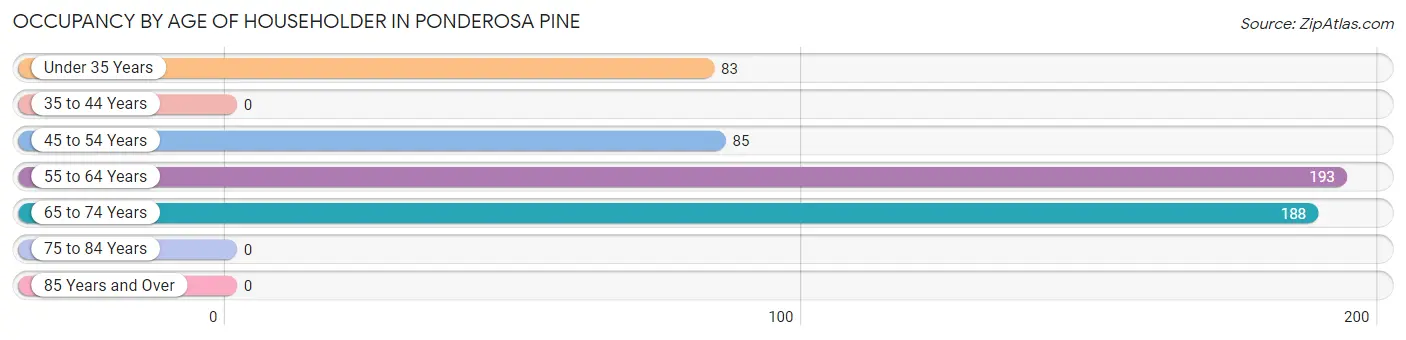
| Age Bracket | # Households | % Households |
| Under 35 Years | 83 | 15.1% |
| 35 to 44 Years | 0 | 0.0% |
| 45 to 54 Years | 85 | 15.5% |
| 55 to 64 Years | 193 | 35.1% |
| 65 to 74 Years | 188 | 34.2% |
| 75 to 84 Years | 0 | 0.0% |
| 85 Years and Over | 0 | 0.0% |
| Total | 549 | 100.0% |
Housing Finances in Ponderosa Pine
Median Income by Occupancy in Ponderosa Pine
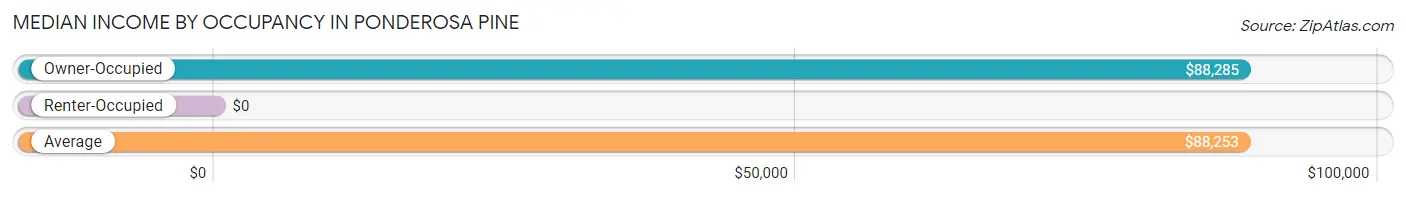
| Occupancy Type | # Households | Median Income |
| Owner-Occupied | 513 (93.4%) | $88,285 |
| Renter-Occupied | 36 (6.6%) | $0 |
| Average | 549 (100.0%) | $88,253 |
Occupancy by Householder Income Bracket in Ponderosa Pine
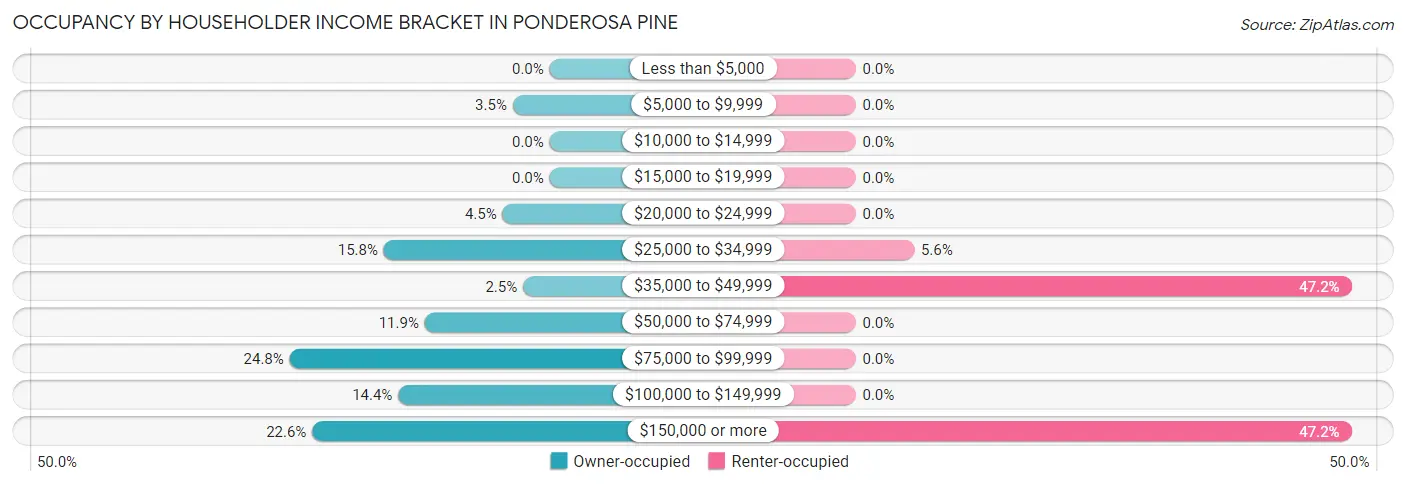
| Income Bracket | Owner-occupied | Renter-occupied |
| Less than $5,000 | 0 (0.0%) | 0 (0.0%) |
| $5,000 to $9,999 | 18 (3.5%) | 0 (0.0%) |
| $10,000 to $14,999 | 0 (0.0%) | 0 (0.0%) |
| $15,000 to $19,999 | 0 (0.0%) | 0 (0.0%) |
| $20,000 to $24,999 | 23 (4.5%) | 0 (0.0%) |
| $25,000 to $34,999 | 81 (15.8%) | 2 (5.6%) |
| $35,000 to $49,999 | 13 (2.5%) | 17 (47.2%) |
| $50,000 to $74,999 | 61 (11.9%) | 0 (0.0%) |
| $75,000 to $99,999 | 127 (24.8%) | 0 (0.0%) |
| $100,000 to $149,999 | 74 (14.4%) | 0 (0.0%) |
| $150,000 or more | 116 (22.6%) | 17 (47.2%) |
| Total | 513 (100.0%) | 36 (100.0%) |
Monthly Housing Cost Tiers in Ponderosa Pine
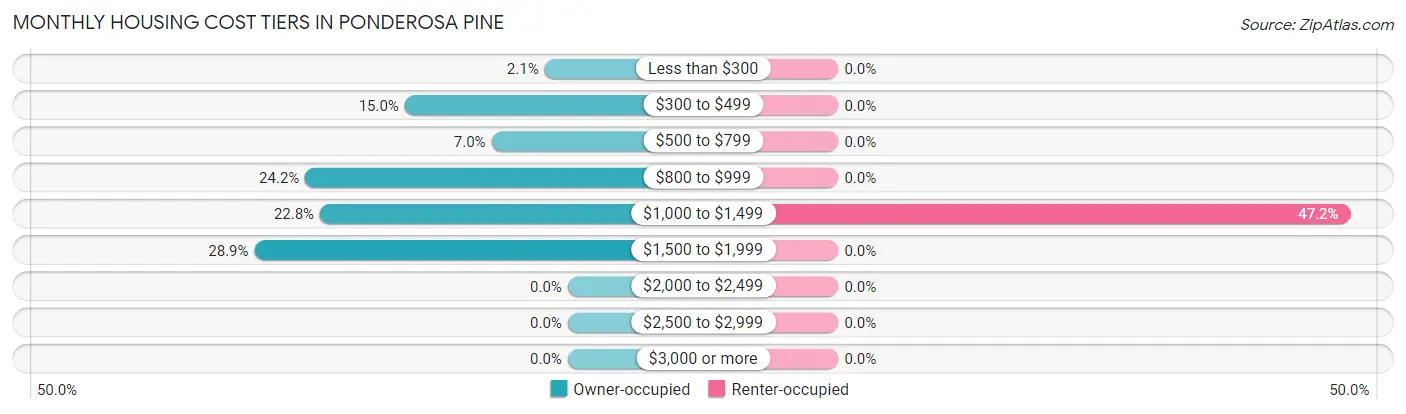
| Monthly Cost | Owner-occupied | Renter-occupied |
| Less than $300 | 11 (2.1%) | 0 (0.0%) |
| $300 to $499 | 77 (15.0%) | 0 (0.0%) |
| $500 to $799 | 36 (7.0%) | 0 (0.0%) |
| $800 to $999 | 124 (24.2%) | 0 (0.0%) |
| $1,000 to $1,499 | 117 (22.8%) | 17 (47.2%) |
| $1,500 to $1,999 | 148 (28.8%) | 0 (0.0%) |
| $2,000 to $2,499 | 0 (0.0%) | 0 (0.0%) |
| $2,500 to $2,999 | 0 (0.0%) | 0 (0.0%) |
| $3,000 or more | 0 (0.0%) | 0 (0.0%) |
| Total | 513 (100.0%) | 36 (100.0%) |
Physical Housing Characteristics in Ponderosa Pine
Housing Structures in Ponderosa Pine
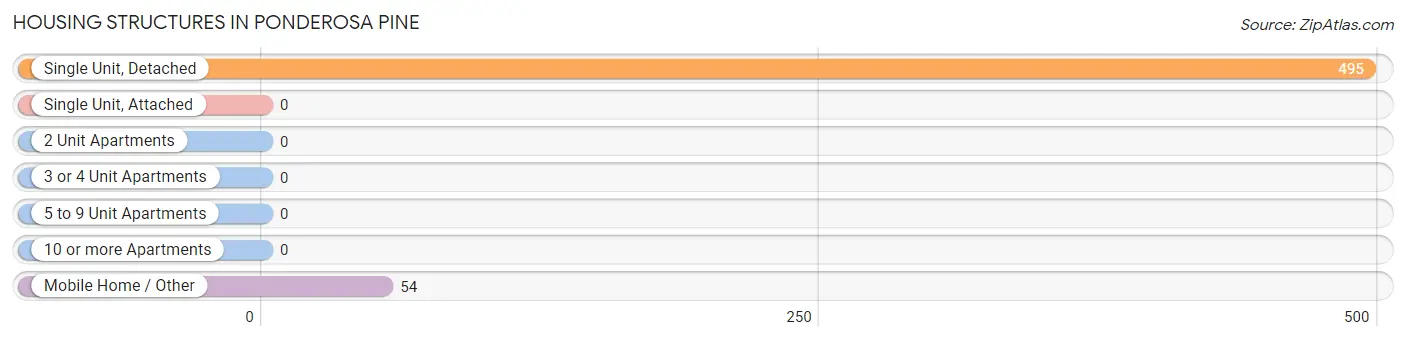
| Structure Type | # Housing Units | % Housing Units |
| Single Unit, Detached | 495 | 90.2% |
| Single Unit, Attached | 0 | 0.0% |
| 2 Unit Apartments | 0 | 0.0% |
| 3 or 4 Unit Apartments | 0 | 0.0% |
| 5 to 9 Unit Apartments | 0 | 0.0% |
| 10 or more Apartments | 0 | 0.0% |
| Mobile Home / Other | 54 | 9.8% |
| Total | 549 | 100.0% |
Housing Structures by Occupancy in Ponderosa Pine
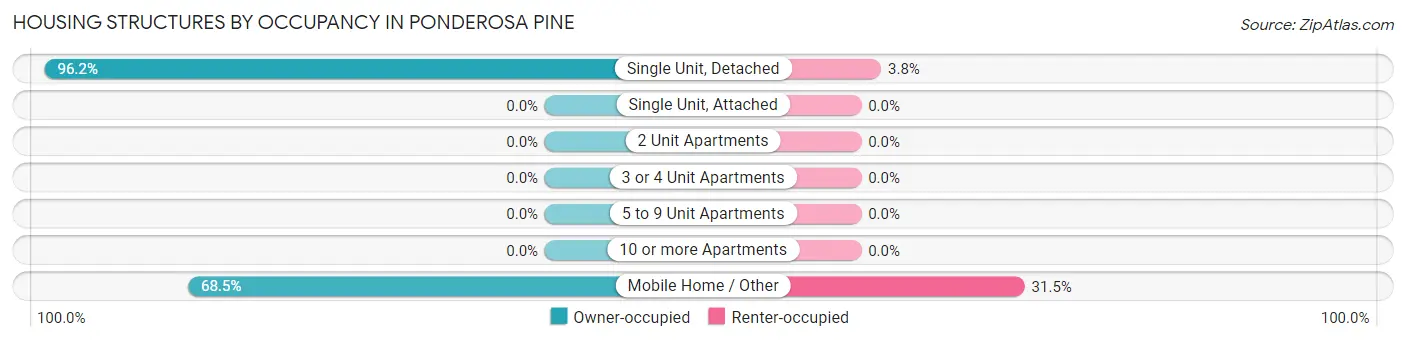
| Structure Type | Owner-occupied | Renter-occupied |
| Single Unit, Detached | 476 (96.2%) | 19 (3.8%) |
| Single Unit, Attached | 0 (0.0%) | 0 (0.0%) |
| 2 Unit Apartments | 0 (0.0%) | 0 (0.0%) |
| 3 or 4 Unit Apartments | 0 (0.0%) | 0 (0.0%) |
| 5 to 9 Unit Apartments | 0 (0.0%) | 0 (0.0%) |
| 10 or more Apartments | 0 (0.0%) | 0 (0.0%) |
| Mobile Home / Other | 37 (68.5%) | 17 (31.5%) |
| Total | 513 (93.4%) | 36 (6.6%) |
Housing Structures by Number of Rooms in Ponderosa Pine
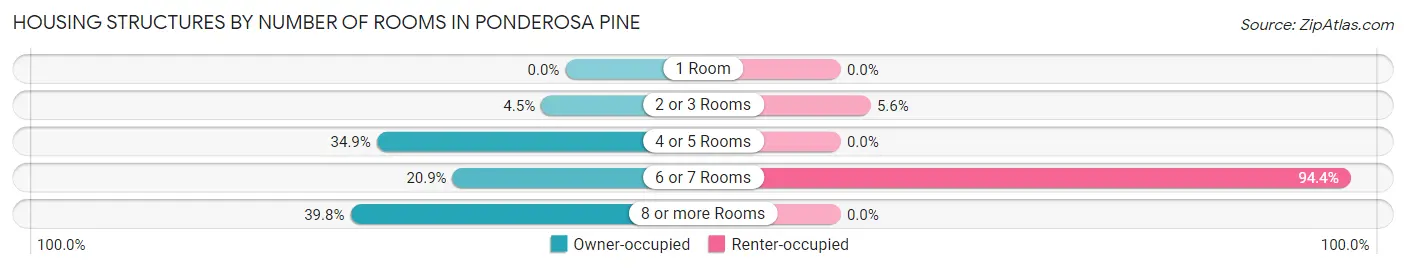
| Number of Rooms | Owner-occupied | Renter-occupied |
| 1 Room | 0 (0.0%) | 0 (0.0%) |
| 2 or 3 Rooms | 23 (4.5%) | 2 (5.6%) |
| 4 or 5 Rooms | 179 (34.9%) | 0 (0.0%) |
| 6 or 7 Rooms | 107 (20.9%) | 34 (94.4%) |
| 8 or more Rooms | 204 (39.8%) | 0 (0.0%) |
| Total | 513 (100.0%) | 36 (100.0%) |
Housing Structure by Heating Type in Ponderosa Pine
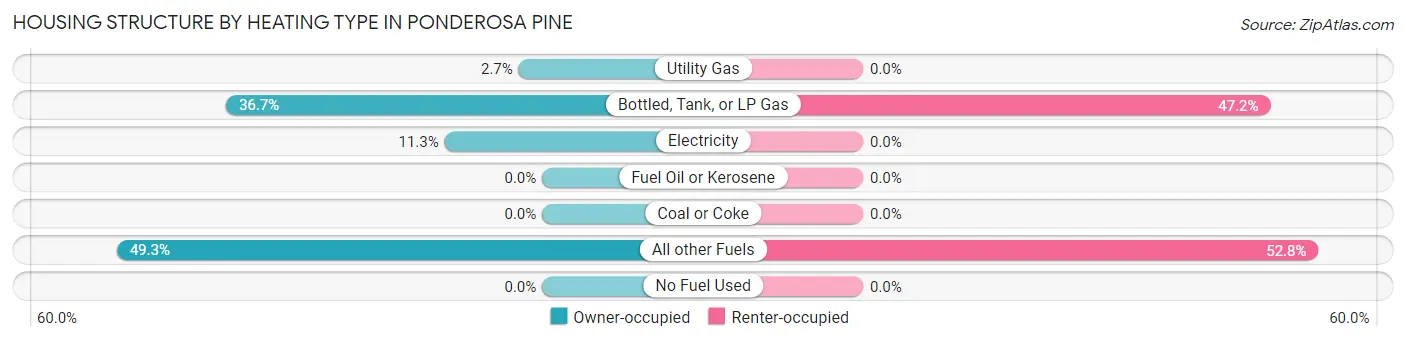
| Heating Type | Owner-occupied | Renter-occupied |
| Utility Gas | 14 (2.7%) | 0 (0.0%) |
| Bottled, Tank, or LP Gas | 188 (36.6%) | 17 (47.2%) |
| Electricity | 58 (11.3%) | 0 (0.0%) |
| Fuel Oil or Kerosene | 0 (0.0%) | 0 (0.0%) |
| Coal or Coke | 0 (0.0%) | 0 (0.0%) |
| All other Fuels | 253 (49.3%) | 19 (52.8%) |
| No Fuel Used | 0 (0.0%) | 0 (0.0%) |
| Total | 513 (100.0%) | 36 (100.0%) |
Household Vehicle Usage in Ponderosa Pine
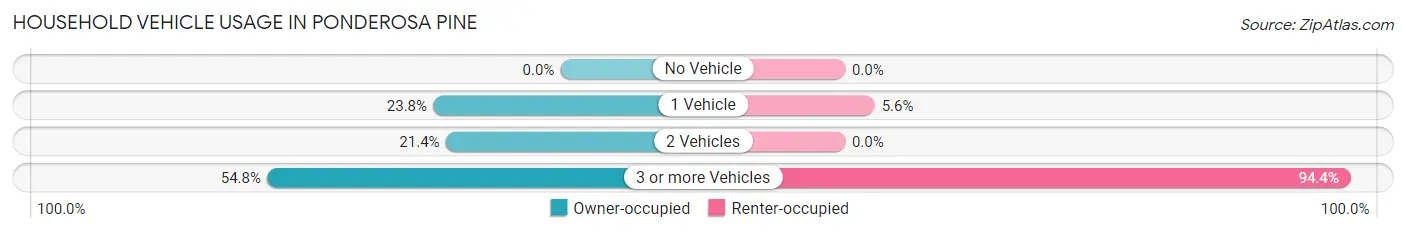
| Vehicles per Household | Owner-occupied | Renter-occupied |
| No Vehicle | 0 (0.0%) | 0 (0.0%) |
| 1 Vehicle | 122 (23.8%) | 2 (5.6%) |
| 2 Vehicles | 110 (21.4%) | 0 (0.0%) |
| 3 or more Vehicles | 281 (54.8%) | 34 (94.4%) |
| Total | 513 (100.0%) | 36 (100.0%) |
Real Estate & Mortgages in Ponderosa Pine
Real Estate and Mortgage Overview in Ponderosa Pine
| Characteristic | Without Mortgage | With Mortgage |
| Housing Units | 188 | 325 |
| Median Property Value | $234,000 | $287,100 |
| Median Household Income | $106,406 | $70 |
| Monthly Housing Costs | $546 | $0 |
| Real Estate Taxes | $2,226 | $0 |
Property Value by Mortgage Status in Ponderosa Pine
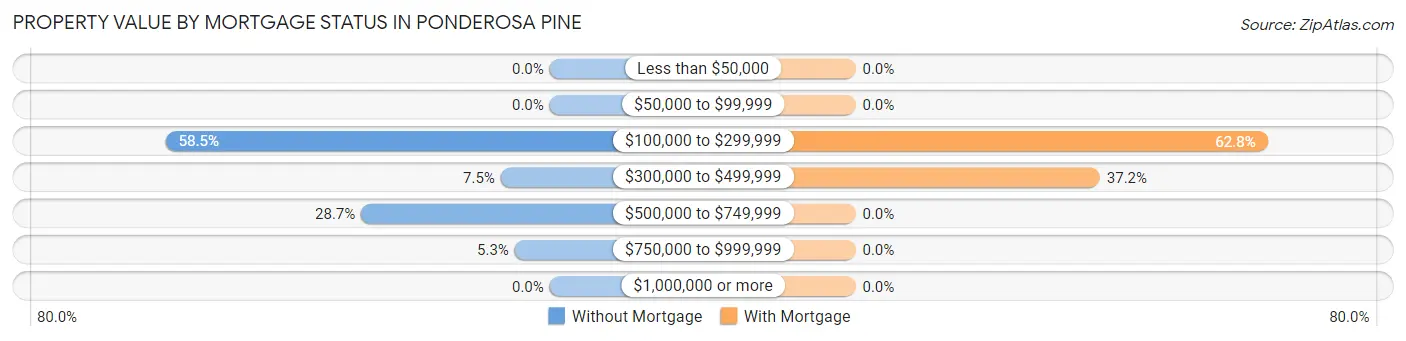
| Property Value | Without Mortgage | With Mortgage |
| Less than $50,000 | 0 (0.0%) | 0 (0.0%) |
| $50,000 to $99,999 | 0 (0.0%) | 0 (0.0%) |
| $100,000 to $299,999 | 110 (58.5%) | 204 (62.8%) |
| $300,000 to $499,999 | 14 (7.4%) | 121 (37.2%) |
| $500,000 to $749,999 | 54 (28.7%) | 0 (0.0%) |
| $750,000 to $999,999 | 10 (5.3%) | 0 (0.0%) |
| $1,000,000 or more | 0 (0.0%) | 0 (0.0%) |
| Total | 188 (100.0%) | 325 (100.0%) |
Household Income by Mortgage Status in Ponderosa Pine
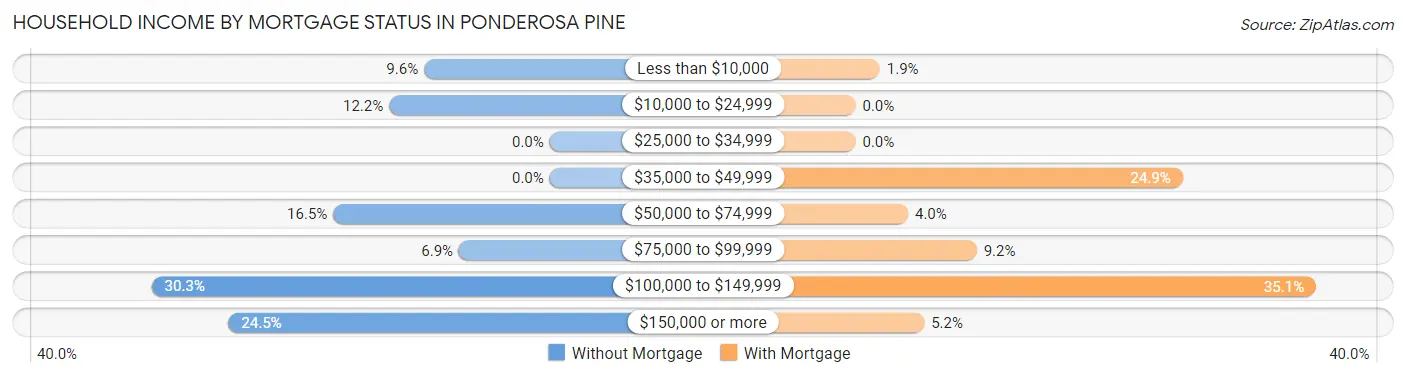
| Household Income | Without Mortgage | With Mortgage |
| Less than $10,000 | 18 (9.6%) | 6 (1.8%) |
| $10,000 to $24,999 | 23 (12.2%) | 0 (0.0%) |
| $25,000 to $34,999 | 0 (0.0%) | 0 (0.0%) |
| $35,000 to $49,999 | 0 (0.0%) | 81 (24.9%) |
| $50,000 to $74,999 | 31 (16.5%) | 13 (4.0%) |
| $75,000 to $99,999 | 13 (6.9%) | 30 (9.2%) |
| $100,000 to $149,999 | 57 (30.3%) | 114 (35.1%) |
| $150,000 or more | 46 (24.5%) | 17 (5.2%) |
| Total | 188 (100.0%) | 325 (100.0%) |
Property Value to Household Income Ratio in Ponderosa Pine
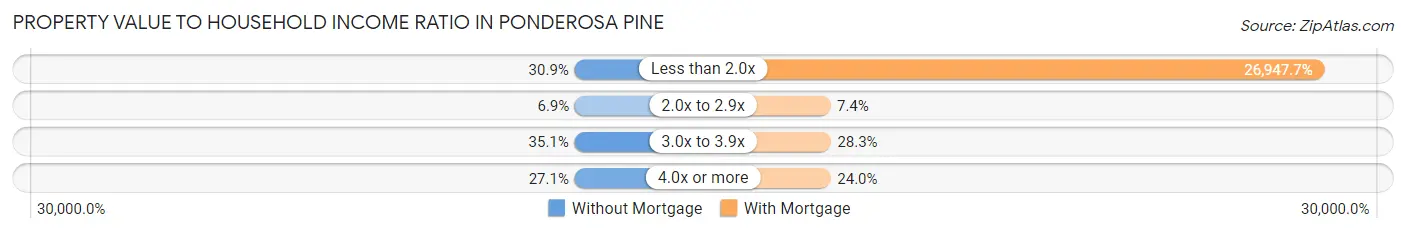
| Value-to-Income Ratio | Without Mortgage | With Mortgage |
| Less than 2.0x | 58 (30.8%) | 87,580 (26,947.7%) |
| 2.0x to 2.9x | 13 (6.9%) | 24 (7.4%) |
| 3.0x to 3.9x | 66 (35.1%) | 92 (28.3%) |
| 4.0x or more | 51 (27.1%) | 78 (24.0%) |
| Total | 188 (100.0%) | 325 (100.0%) |
Real Estate Taxes by Mortgage Status in Ponderosa Pine
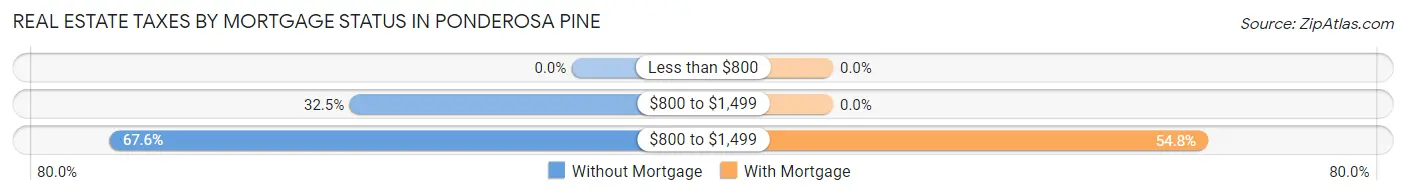
| Property Taxes | Without Mortgage | With Mortgage |
| Less than $800 | 0 (0.0%) | 0 (0.0%) |
| $800 to $1,499 | 61 (32.5%) | 0 (0.0%) |
| $800 to $1,499 | 127 (67.5%) | 178 (54.8%) |
| Total | 188 (100.0%) | 325 (100.0%) |
Health & Disability in Ponderosa Pine
Health Insurance Coverage by Age in Ponderosa Pine
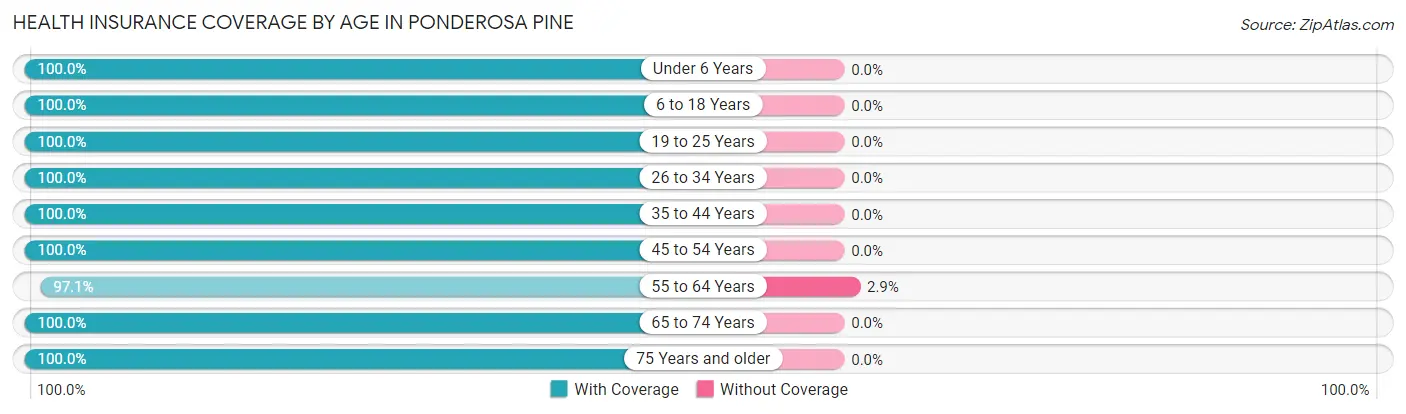
| Age Bracket | With Coverage | Without Coverage |
| Under 6 Years | 85 (100.0%) | 0 (0.0%) |
| 6 to 18 Years | 151 (100.0%) | 0 (0.0%) |
| 19 to 25 Years | 61 (100.0%) | 0 (0.0%) |
| 26 to 34 Years | 108 (100.0%) | 0 (0.0%) |
| 35 to 44 Years | 38 (100.0%) | 0 (0.0%) |
| 45 to 54 Years | 141 (100.0%) | 0 (0.0%) |
| 55 to 64 Years | 331 (97.1%) | 10 (2.9%) |
| 65 to 74 Years | 283 (100.0%) | 0 (0.0%) |
| 75 Years and older | 38 (100.0%) | 0 (0.0%) |
| Total | 1,236 (99.2%) | 10 (0.8%) |
Health Insurance Coverage by Citizenship Status in Ponderosa Pine
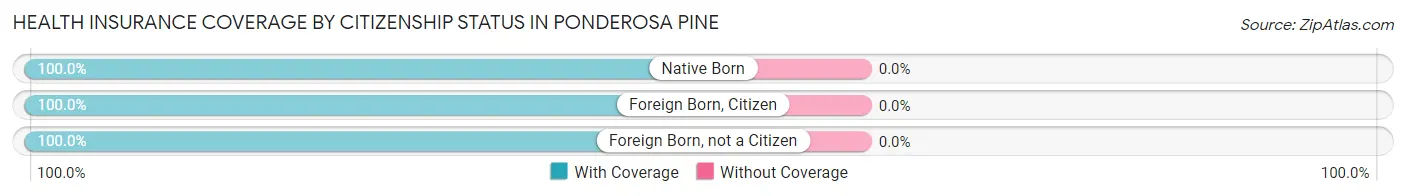
| Citizenship Status | With Coverage | Without Coverage |
| Native Born | 85 (100.0%) | 0 (0.0%) |
| Foreign Born, Citizen | 151 (100.0%) | 0 (0.0%) |
| Foreign Born, not a Citizen | 61 (100.0%) | 0 (0.0%) |
Health Insurance Coverage by Household Income in Ponderosa Pine
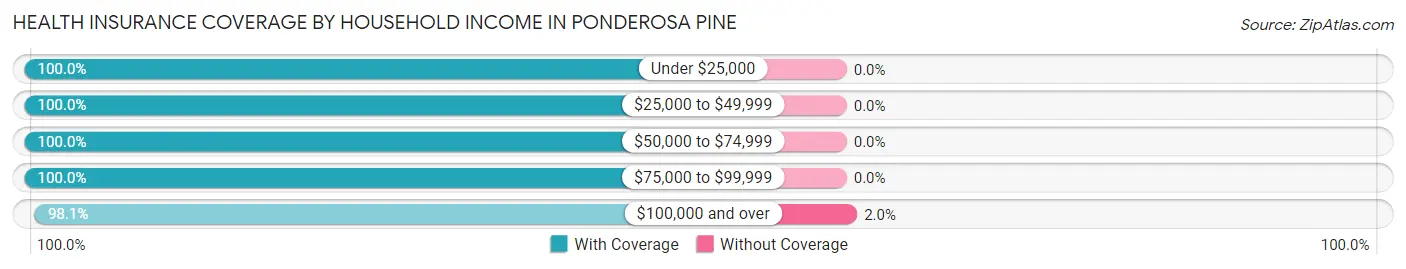
| Household Income | With Coverage | Without Coverage |
| Under $25,000 | 58 (100.0%) | 0 (0.0%) |
| $25,000 to $49,999 | 239 (100.0%) | 0 (0.0%) |
| $50,000 to $74,999 | 165 (100.0%) | 0 (0.0%) |
| $75,000 to $99,999 | 270 (100.0%) | 0 (0.0%) |
| $100,000 and over | 504 (98.1%) | 10 (1.9%) |
Public vs Private Health Insurance Coverage by Age in Ponderosa Pine
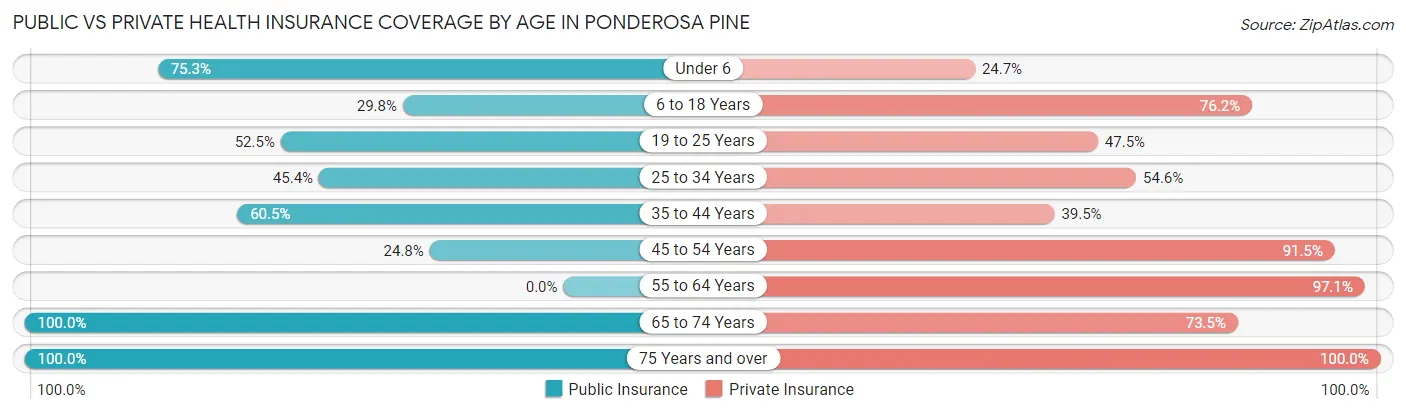
| Age Bracket | Public Insurance | Private Insurance |
| Under 6 | 64 (75.3%) | 21 (24.7%) |
| 6 to 18 Years | 45 (29.8%) | 115 (76.2%) |
| 19 to 25 Years | 32 (52.5%) | 29 (47.5%) |
| 25 to 34 Years | 49 (45.4%) | 59 (54.6%) |
| 35 to 44 Years | 23 (60.5%) | 15 (39.5%) |
| 45 to 54 Years | 35 (24.8%) | 129 (91.5%) |
| 55 to 64 Years | 0 (0.0%) | 331 (97.1%) |
| 65 to 74 Years | 283 (100.0%) | 208 (73.5%) |
| 75 Years and over | 38 (100.0%) | 38 (100.0%) |
| Total | 569 (45.7%) | 945 (75.8%) |
Disability Status by Sex by Age in Ponderosa Pine
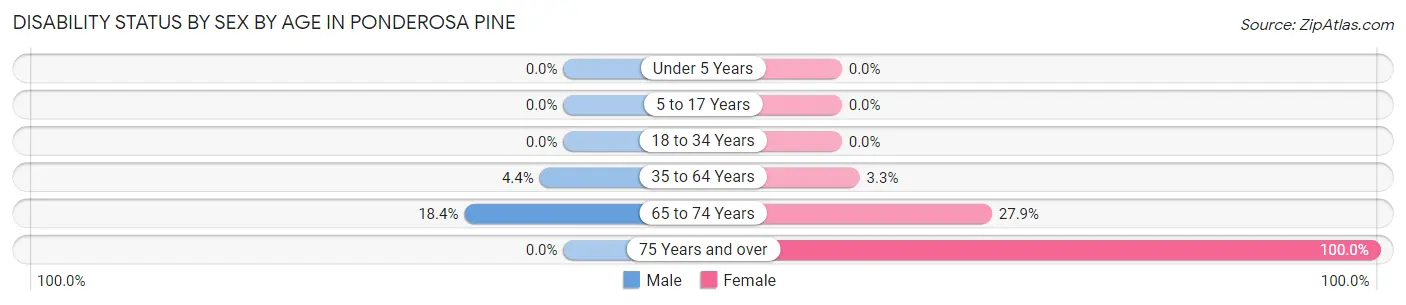
| Age Bracket | Male | Female |
| Under 5 Years | 0 (0.0%) | 0 (0.0%) |
| 5 to 17 Years | 0 (0.0%) | 0 (0.0%) |
| 18 to 34 Years | 0 (0.0%) | 0 (0.0%) |
| 35 to 64 Years | 11 (4.4%) | 9 (3.3%) |
| 65 to 74 Years | 23 (18.4%) | 44 (27.9%) |
| 75 Years and over | 0 (0.0%) | 18 (100.0%) |
Disability Class by Sex by Age in Ponderosa Pine
Disability Class: Hearing Difficulty
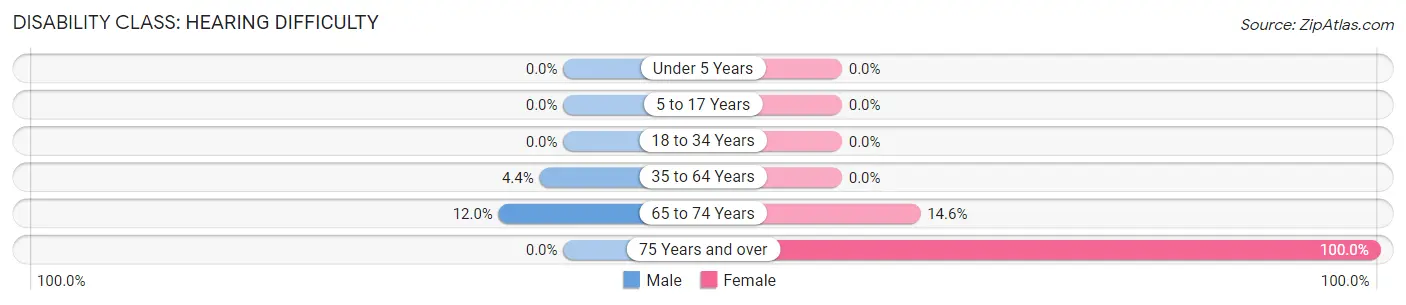
| Age Bracket | Male | Female |
| Under 5 Years | 0 (0.0%) | 0 (0.0%) |
| 5 to 17 Years | 0 (0.0%) | 0 (0.0%) |
| 18 to 34 Years | 0 (0.0%) | 0 (0.0%) |
| 35 to 64 Years | 11 (4.4%) | 0 (0.0%) |
| 65 to 74 Years | 15 (12.0%) | 23 (14.6%) |
| 75 Years and over | 0 (0.0%) | 18 (100.0%) |
Disability Class: Vision Difficulty
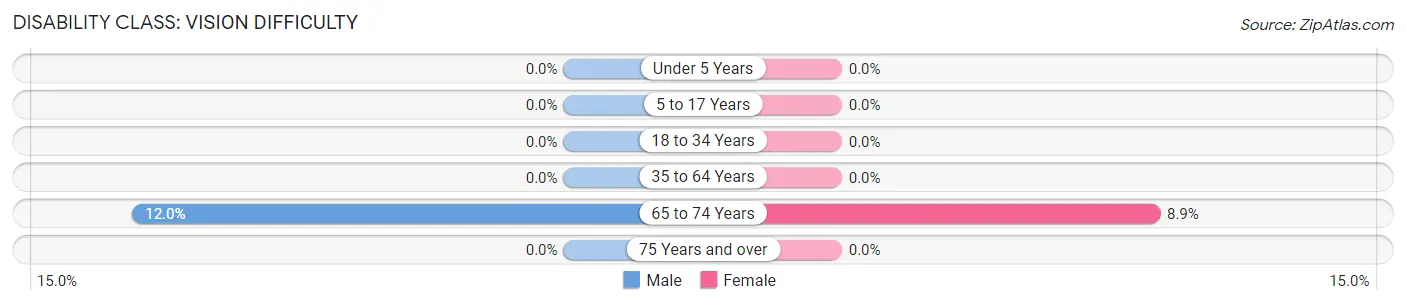
| Age Bracket | Male | Female |
| Under 5 Years | 0 (0.0%) | 0 (0.0%) |
| 5 to 17 Years | 0 (0.0%) | 0 (0.0%) |
| 18 to 34 Years | 0 (0.0%) | 0 (0.0%) |
| 35 to 64 Years | 0 (0.0%) | 0 (0.0%) |
| 65 to 74 Years | 15 (12.0%) | 14 (8.9%) |
| 75 Years and over | 0 (0.0%) | 0 (0.0%) |
Disability Class: Cognitive Difficulty
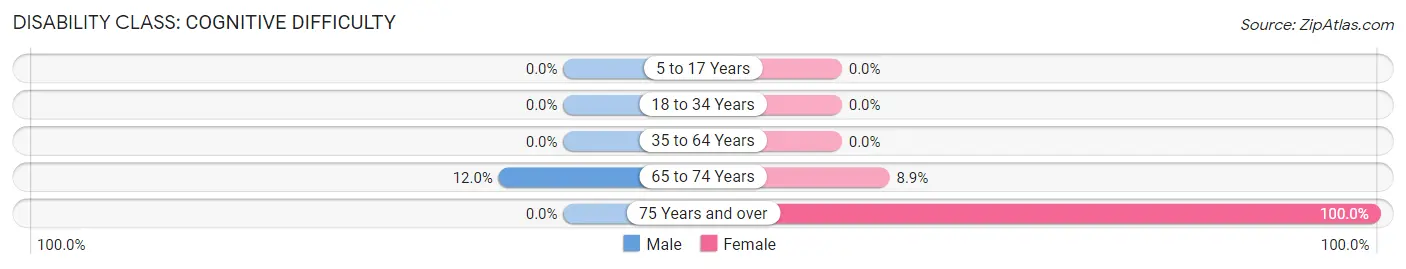
| Age Bracket | Male | Female |
| 5 to 17 Years | 0 (0.0%) | 0 (0.0%) |
| 18 to 34 Years | 0 (0.0%) | 0 (0.0%) |
| 35 to 64 Years | 0 (0.0%) | 0 (0.0%) |
| 65 to 74 Years | 15 (12.0%) | 14 (8.9%) |
| 75 Years and over | 0 (0.0%) | 18 (100.0%) |
Disability Class: Ambulatory Difficulty
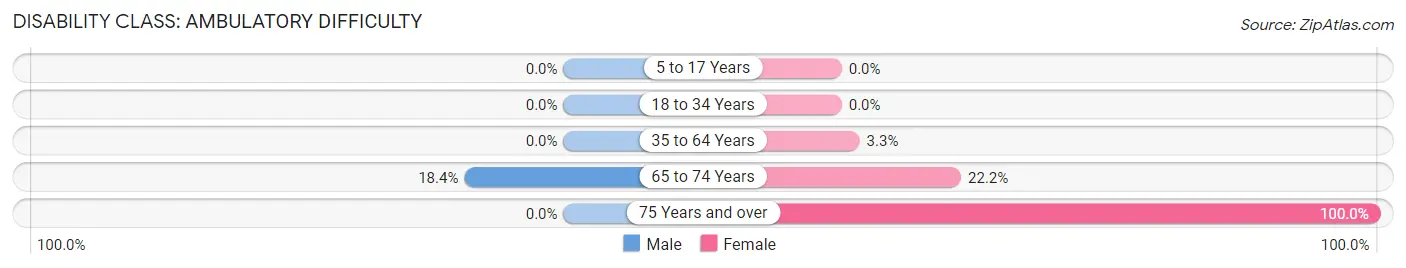
| Age Bracket | Male | Female |
| 5 to 17 Years | 0 (0.0%) | 0 (0.0%) |
| 18 to 34 Years | 0 (0.0%) | 0 (0.0%) |
| 35 to 64 Years | 0 (0.0%) | 9 (3.3%) |
| 65 to 74 Years | 23 (18.4%) | 35 (22.2%) |
| 75 Years and over | 0 (0.0%) | 18 (100.0%) |
Disability Class: Self-Care Difficulty

| Age Bracket | Male | Female |
| 5 to 17 Years | 0 (0.0%) | 0 (0.0%) |
| 18 to 34 Years | 0 (0.0%) | 0 (0.0%) |
| 35 to 64 Years | 0 (0.0%) | 9 (3.3%) |
| 65 to 74 Years | 15 (12.0%) | 14 (8.9%) |
| 75 Years and over | 0 (0.0%) | 18 (100.0%) |
Technology Access in Ponderosa Pine
Computing Device Access in Ponderosa Pine
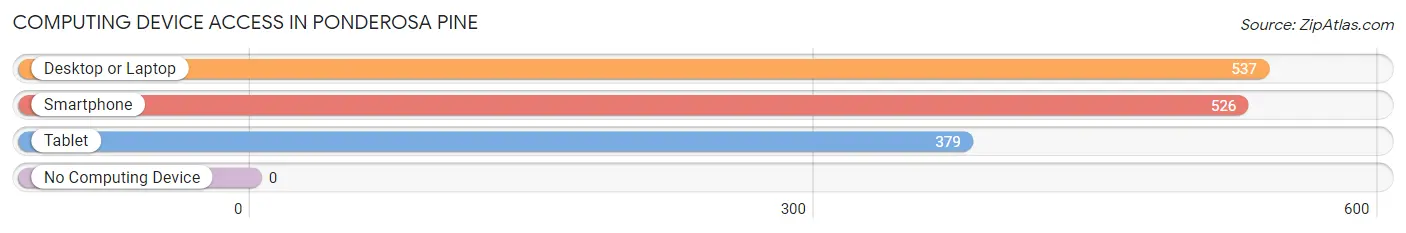
| Device Type | # Households | % Households |
| Desktop or Laptop | 537 | 97.8% |
| Smartphone | 526 | 95.8% |
| Tablet | 379 | 69.0% |
| No Computing Device | 0 | 0.0% |
| Total | 549 | 100.0% |
Internet Access in Ponderosa Pine
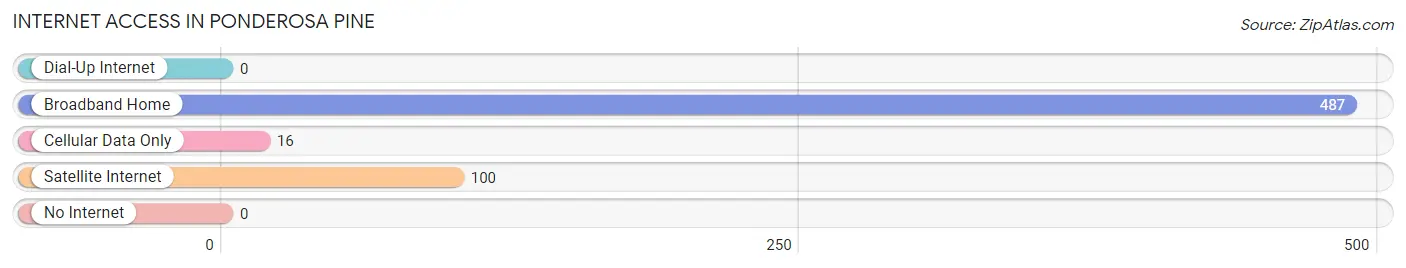
| Internet Type | # Households | % Households |
| Dial-Up Internet | 0 | 0.0% |
| Broadband Home | 487 | 88.7% |
| Cellular Data Only | 16 | 2.9% |
| Satellite Internet | 100 | 18.2% |
| No Internet | 0 | 0.0% |
| Total | 549 | 100.0% |
Ponderosa Pine Summary
Ponderosa Pine, New Mexico is a small town located in the northern part of the state, in the foothills of the Sangre de Cristo Mountains. It is situated in the San Juan County, and is part of the Farmington Metropolitan Statistical Area. The town has a population of approximately 1,000 people, and is known for its rural charm and scenic beauty.
Geography
Ponderosa Pine is located in the northern part of New Mexico, in the foothills of the Sangre de Cristo Mountains. The town is situated in the San Juan County, and is part of the Farmington Metropolitan Statistical Area. The town is located at an elevation of 6,000 feet, and is surrounded by the San Juan National Forest. The town is located near the Navajo Nation, and is close to the Four Corners Monument. The town is also close to the Chaco Culture National Historical Park, which is a UNESCO World Heritage Site.
The town is located in a semi-arid climate, with hot summers and cold winters. The average annual temperature is around 50 degrees Fahrenheit, and the average annual precipitation is around 12 inches. The town is located in a high desert environment, and is surrounded by mountains and forests.
Economy
The economy of Ponderosa Pine is largely based on tourism and agriculture. The town is home to several tourist attractions, including the Chaco Culture National Historical Park, the Four Corners Monument, and the San Juan National Forest. The town is also home to several farms and ranches, which produce a variety of crops and livestock.
The town is also home to several businesses, including restaurants, retail stores, and service providers. The town is also home to several manufacturing companies, which produce a variety of products, including furniture, clothing, and electronics.
Demographics
As of the 2010 census, the population of Ponderosa Pine was 1,000 people. The town is predominantly white, with a population that is approximately 90% white. The town also has a small Hispanic population, which makes up around 5% of the population. The town also has a small Native American population, which makes up around 2% of the population.
The median household income in Ponderosa Pine is around $35,000, and the median home value is around $150,000. The town has a low unemployment rate, and the poverty rate is around 10%.
Conclusion
Ponderosa Pine, New Mexico is a small town located in the northern part of the state, in the foothills of the Sangre de Cristo Mountains. The town has a population of approximately 1,000 people, and is known for its rural charm and scenic beauty. The economy of the town is largely based on tourism and agriculture, and the town is home to several tourist attractions, farms, and businesses. The town is predominantly white, with a small Hispanic and Native American population. The median household income in Ponderosa Pine is around $35,000, and the median home value is around $150,000.
Common Questions
What is the Total Population of Ponderosa Pine?
Total Population of Ponderosa Pine is 1,246.
What is the Total Male Population of Ponderosa Pine?
Total Male Population of Ponderosa Pine is 545.
What is the Total Female Population of Ponderosa Pine?
Total Female Population of Ponderosa Pine is 701.
What is the Ratio of Males per 100 Females in Ponderosa Pine?
There are 77.75 Males per 100 Females in Ponderosa Pine.
What is the Ratio of Females per 100 Males in Ponderosa Pine?
There are 128.62 Females per 100 Males in Ponderosa Pine.
What is the Median Population Age in Ponderosa Pine?
Median Population Age in Ponderosa Pine is 56.0 Years.
What is the Average Family Size in Ponderosa Pine
Average Family Size in Ponderosa Pine is 2.4 People.
What is the Average Household Size in Ponderosa Pine
Average Household Size in Ponderosa Pine is 2.3 People.
What is Per Capita Income in Ponderosa Pine?
Per Capita income in Ponderosa Pine is $42,662.
What is the Median Family Income in Ponderosa Pine?
Median Family Income in Ponderosa Pine is $88,429.
What is the Median Household income in Ponderosa Pine?
Median Household Income in Ponderosa Pine is $88,253.
What is Inequality or Gini Index in Ponderosa Pine?
Inequality or Gini Index in Ponderosa Pine is 0.35.
How Large is the Labor Force in Ponderosa Pine?
There are 436 People in the Labor Forcein in Ponderosa Pine.
What is the Percentage of People in the Labor Force in Ponderosa Pine?
39.5% of People are in the Labor Force in Ponderosa Pine.
What is the Unemployment Rate in Ponderosa Pine?
Unemployment Rate in Ponderosa Pine is 11.4%.