Lee Acres, NM
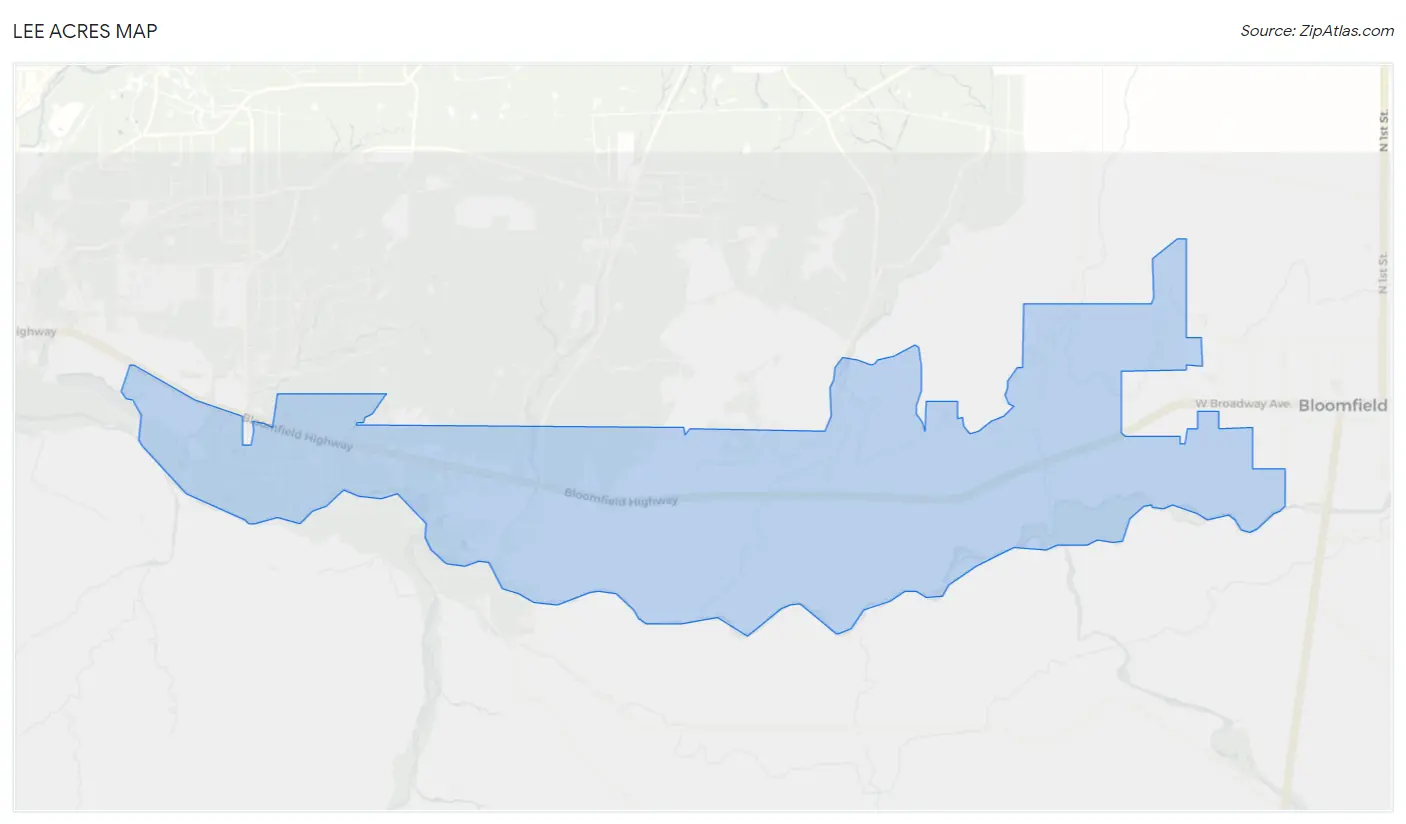
Lee Acres Map
Lee Acres Overview
4,858
TOTAL POPULATION
2,417
MALE POPULATION
2,441
FEMALE POPULATION
99.02
MALES / 100 FEMALES
100.99
FEMALES / 100 MALES
41.6
MEDIAN AGE
3.5
AVG FAMILY SIZE
2.8
AVG HOUSEHOLD SIZE
$23,283
PER CAPITA INCOME
$52,847
AVG FAMILY INCOME
$44,850
AVG HOUSEHOLD INCOME
22.8%
WAGE / INCOME GAP [ % ]
77.2¢/ $1
WAGE / INCOME GAP [ $ ]
0.47
INEQUALITY / GINI INDEX
1,737
LABOR FORCE [ PEOPLE ]
44.8%
PERCENT IN LABOR FORCE
22.3%
UNEMPLOYMENT RATE
Race in Lee Acres
The most populous races in Lee Acres are White / Caucasian (2,551 | 52.5%), Native / Alaskan (1,581 | 32.5%), and Hispanic or Latino (991 | 20.4%).
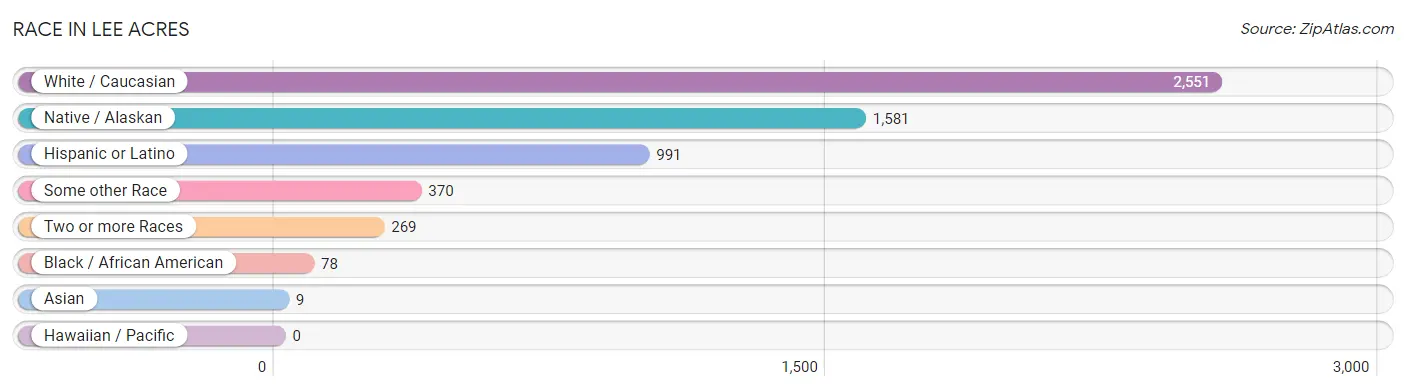
| Race | # Population | % Population |
| Asian | 9 | 0.2% |
| Black / African American | 78 | 1.6% |
| Hawaiian / Pacific | 0 | 0.0% |
| Hispanic or Latino | 991 | 20.4% |
| Native / Alaskan | 1,581 | 32.5% |
| White / Caucasian | 2,551 | 52.5% |
| Two or more Races | 269 | 5.5% |
| Some other Race | 370 | 7.6% |
| Total | 4,858 | 100.0% |
Ancestry in Lee Acres
The most populous ancestries reported in Lee Acres are Navajo (1,388 | 28.6%), Mexican (486 | 10.0%), German (433 | 8.9%), English (372 | 7.7%), and Spanish (211 | 4.3%), together accounting for 59.5% of all Lee Acres residents.
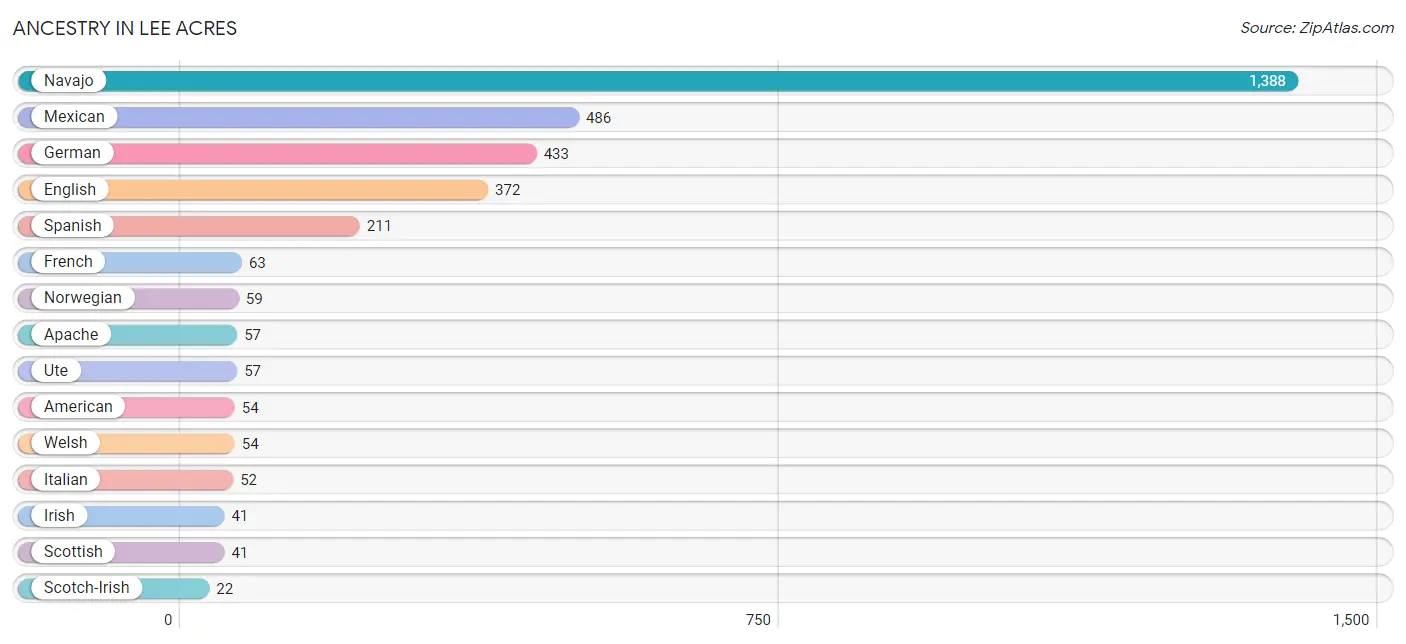
| Ancestry | # Population | % Population |
| American | 54 | 1.1% |
| Apache | 57 | 1.2% |
| Austrian | 8 | 0.2% |
| British | 5 | 0.1% |
| Burmese | 9 | 0.2% |
| Canadian | 17 | 0.4% |
| Croatian | 5 | 0.1% |
| English | 372 | 7.7% |
| European | 16 | 0.3% |
| French | 63 | 1.3% |
| German | 433 | 8.9% |
| Irish | 41 | 0.8% |
| Italian | 52 | 1.1% |
| Mexican | 486 | 10.0% |
| Navajo | 1,388 | 28.6% |
| Norwegian | 59 | 1.2% |
| Polish | 5 | 0.1% |
| Romanian | 13 | 0.3% |
| Scotch-Irish | 22 | 0.4% |
| Scottish | 41 | 0.8% |
| Sioux | 14 | 0.3% |
| Spaniard | 13 | 0.3% |
| Spanish | 211 | 4.3% |
| Swedish | 19 | 0.4% |
| Swiss | 19 | 0.4% |
| Ukrainian | 15 | 0.3% |
| Ute | 57 | 1.2% |
| Welsh | 54 | 1.1% |
| Yuman | 17 | 0.4% | View All 29 Rows |
Immigrants in Lee Acres
The most numerous immigrant groups reported in Lee Acres came from Europe (32 | 0.7%), Western Europe (32 | 0.7%), France (24 | 0.5%), Central America (23 | 0.5%), and Latin America (23 | 0.5%), together accounting for 2.7% of all Lee Acres residents.
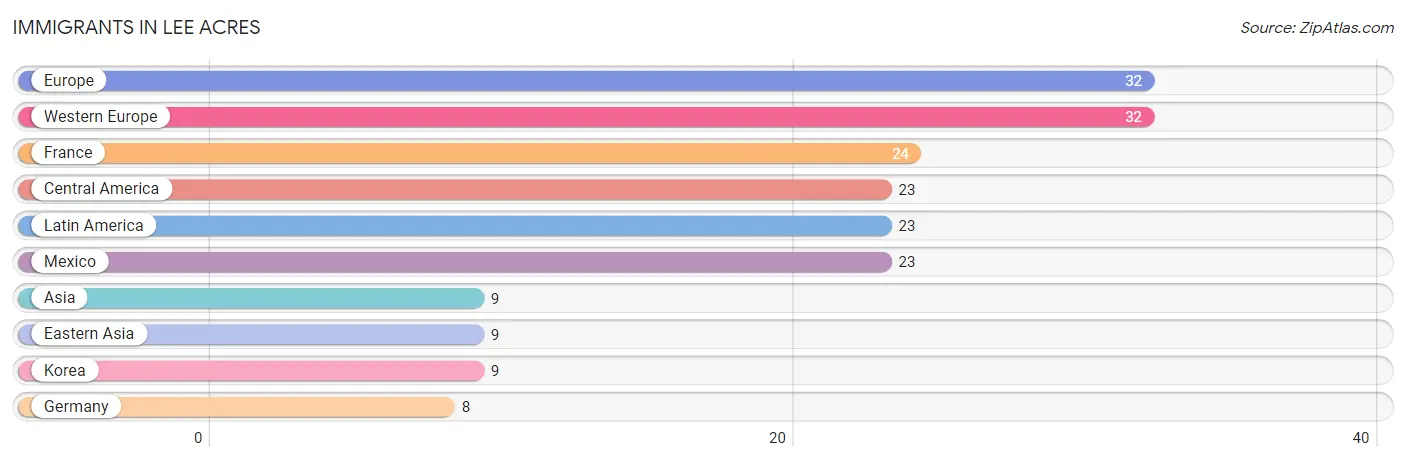
| Immigration Origin | # Population | % Population |
| Asia | 9 | 0.2% |
| Central America | 23 | 0.5% |
| Eastern Asia | 9 | 0.2% |
| Europe | 32 | 0.7% |
| France | 24 | 0.5% |
| Germany | 8 | 0.2% |
| Korea | 9 | 0.2% |
| Latin America | 23 | 0.5% |
| Mexico | 23 | 0.5% |
| Western Europe | 32 | 0.7% | View All 10 Rows |
Sex and Age in Lee Acres
Sex and Age in Lee Acres
The most populous age groups in Lee Acres are 20 to 24 Years (370 | 15.3%) for men and 10 to 14 Years (371 | 15.2%) for women.
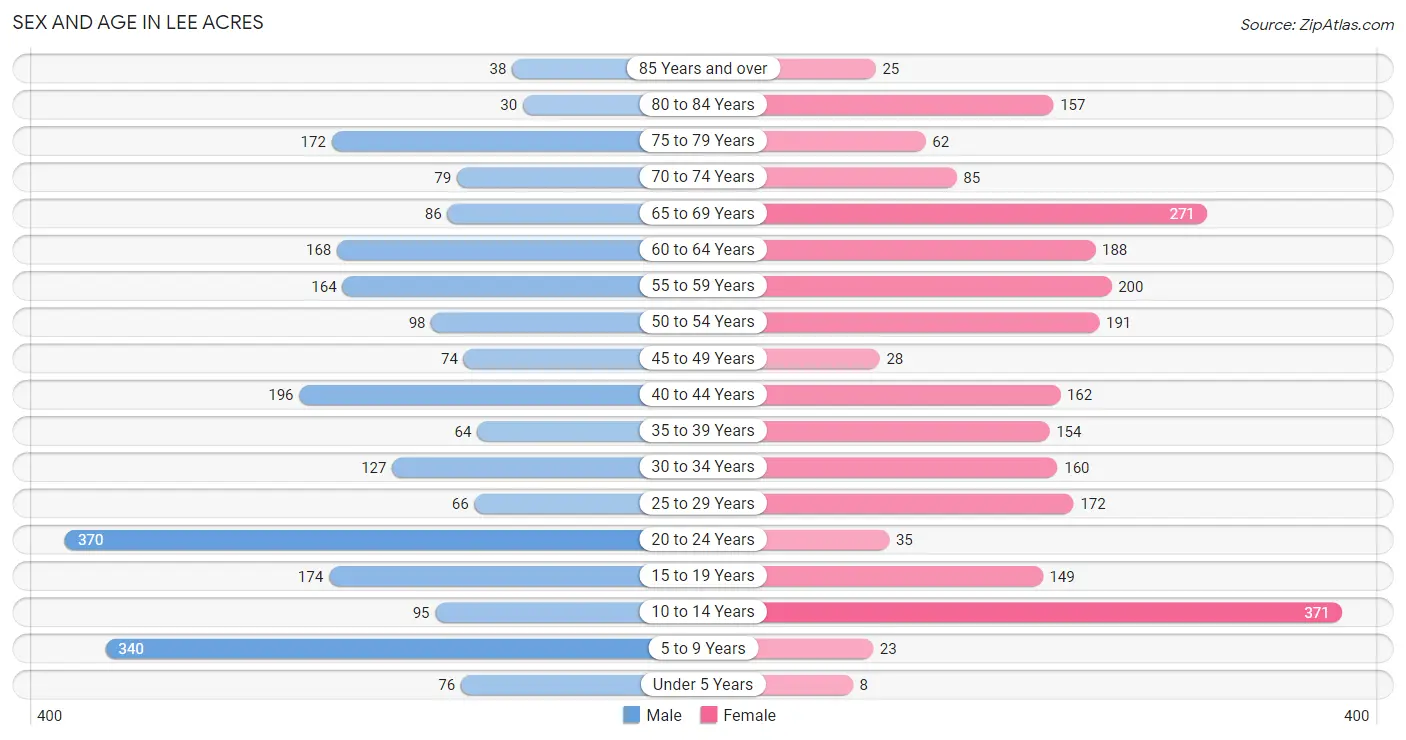
| Age Bracket | Male | Female |
| Under 5 Years | 76 (3.1%) | 8 (0.3%) |
| 5 to 9 Years | 340 (14.1%) | 23 (0.9%) |
| 10 to 14 Years | 95 (3.9%) | 371 (15.2%) |
| 15 to 19 Years | 174 (7.2%) | 149 (6.1%) |
| 20 to 24 Years | 370 (15.3%) | 35 (1.4%) |
| 25 to 29 Years | 66 (2.7%) | 172 (7.0%) |
| 30 to 34 Years | 127 (5.2%) | 160 (6.6%) |
| 35 to 39 Years | 64 (2.6%) | 154 (6.3%) |
| 40 to 44 Years | 196 (8.1%) | 162 (6.6%) |
| 45 to 49 Years | 74 (3.1%) | 28 (1.1%) |
| 50 to 54 Years | 98 (4.1%) | 191 (7.8%) |
| 55 to 59 Years | 164 (6.8%) | 200 (8.2%) |
| 60 to 64 Years | 168 (7.0%) | 188 (7.7%) |
| 65 to 69 Years | 86 (3.6%) | 271 (11.1%) |
| 70 to 74 Years | 79 (3.3%) | 85 (3.5%) |
| 75 to 79 Years | 172 (7.1%) | 62 (2.5%) |
| 80 to 84 Years | 30 (1.2%) | 157 (6.4%) |
| 85 Years and over | 38 (1.6%) | 25 (1.0%) |
| Total | 2,417 (100.0%) | 2,441 (100.0%) |
Families and Households in Lee Acres
Median Family Size in Lee Acres
The median family size in Lee Acres is 3.54 persons per family, with single male/father families (40 | 3.8%) accounting for the largest median family size of 4.6 persons per family. On the other hand, married-couple families (882 | 84.1%) represent the smallest median family size with 3.42 persons per family.
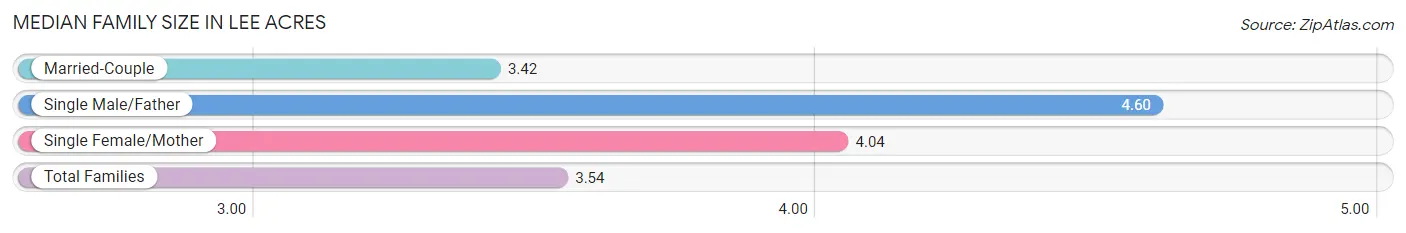
| Family Type | # Families | Family Size |
| Married-Couple | 882 (84.1%) | 3.42 |
| Single Male/Father | 40 (3.8%) | 4.60 |
| Single Female/Mother | 127 (12.1%) | 4.04 |
| Total Families | 1,049 (100.0%) | 3.54 |
Median Household Size in Lee Acres
The median household size in Lee Acres is 2.78 persons per household, with single male/father households (40 | 2.3%) accounting for the largest median household size of 5.4 persons per household. non-family households (696 | 39.9%) represent the smallest median household size with 1.30 persons per household.
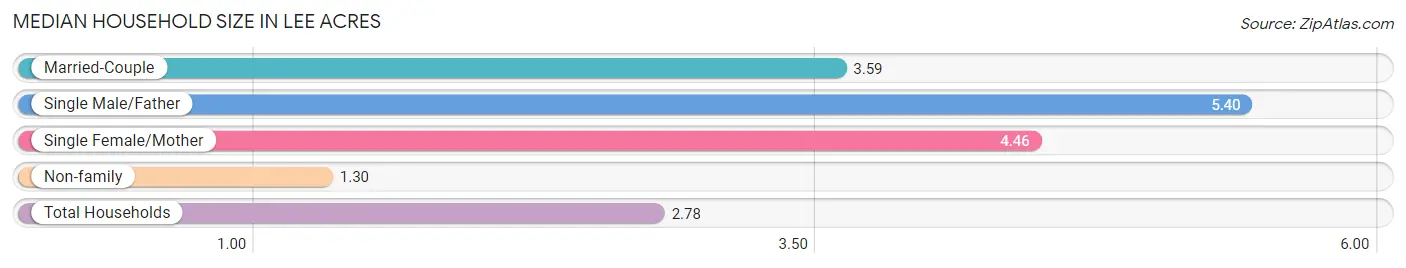
| Household Type | # Households | Household Size |
| Married-Couple | 882 (50.5%) | 3.59 |
| Single Male/Father | 40 (2.3%) | 5.40 |
| Single Female/Mother | 127 (7.3%) | 4.46 |
| Non-family | 696 (39.9%) | 1.30 |
| Total Households | 1,745 (100.0%) | 2.78 |
Household Size by Marriage Status in Lee Acres
Out of a total of 1,745 households in Lee Acres, 1,049 (60.1%) are family households, while 696 (39.9%) are nonfamily households. The most numerous type of family households are 2-person households, comprising 467, and the most common type of nonfamily households are 1-person households, comprising 462.
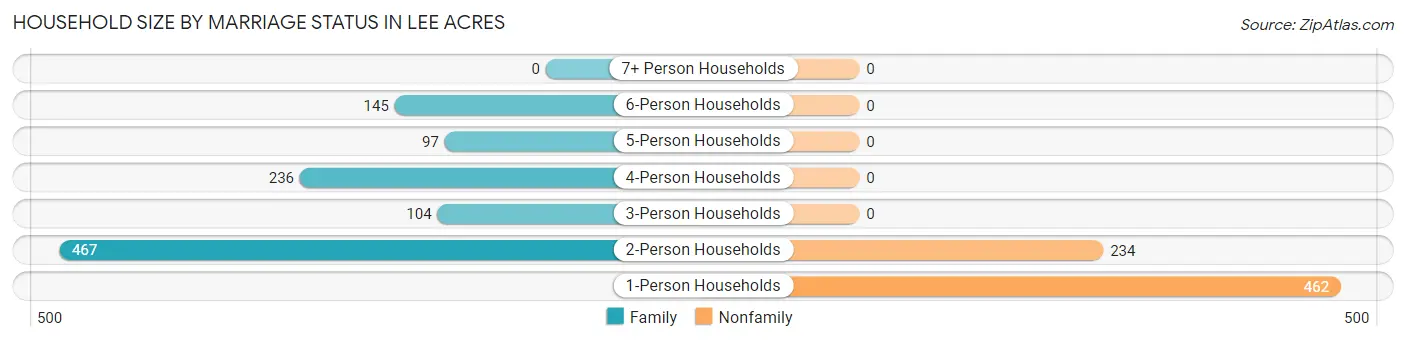
| Household Size | Family Households | Nonfamily Households |
| 1-Person Households | - | 462 (26.5%) |
| 2-Person Households | 467 (26.8%) | 234 (13.4%) |
| 3-Person Households | 104 (6.0%) | 0 (0.0%) |
| 4-Person Households | 236 (13.5%) | 0 (0.0%) |
| 5-Person Households | 97 (5.6%) | 0 (0.0%) |
| 6-Person Households | 145 (8.3%) | 0 (0.0%) |
| 7+ Person Households | 0 (0.0%) | 0 (0.0%) |
| Total | 1,049 (60.1%) | 696 (39.9%) |
Female Fertility in Lee Acres
Fertility by Age in Lee Acres
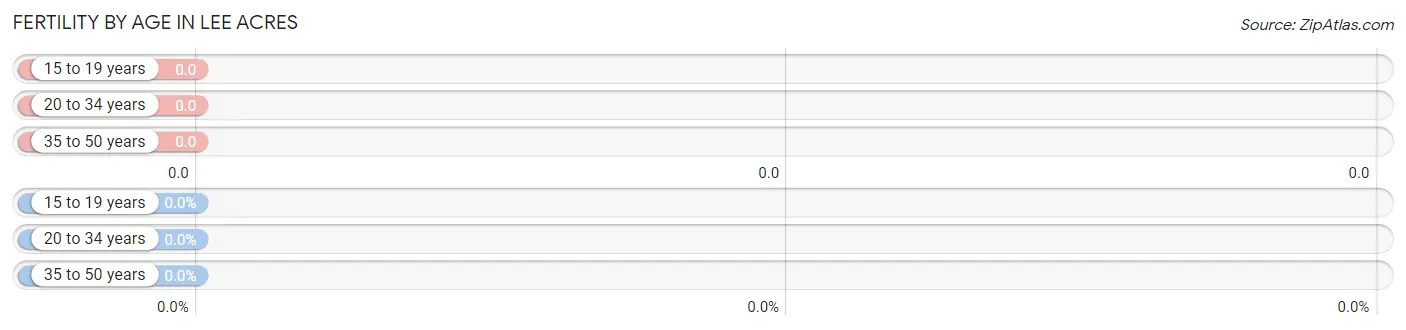
| Age Bracket | Women with Births | Births / 1,000 Women |
| 15 to 19 years | 0 (0.0%) | 0.0 |
| 20 to 34 years | 0 (0.0%) | 0.0 |
| 35 to 50 years | 0 (0.0%) | 0.0 |
| Total | 0 (0.0%) | 0.0 |
Fertility by Age by Marriage Status in Lee Acres
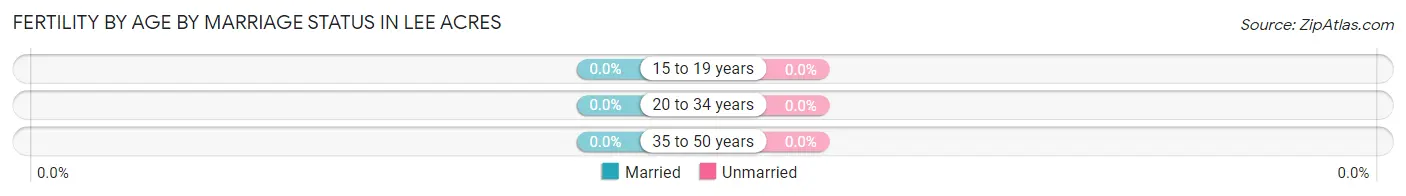
| Age Bracket | Married | Unmarried |
| 15 to 19 years | 0 (0.0%) | 0 (0.0%) |
| 20 to 34 years | 0 (0.0%) | 0 (0.0%) |
| 35 to 50 years | 0 (0.0%) | 0 (0.0%) |
| Total | 0 (0.0%) | 0 (0.0%) |
Fertility by Education in Lee Acres
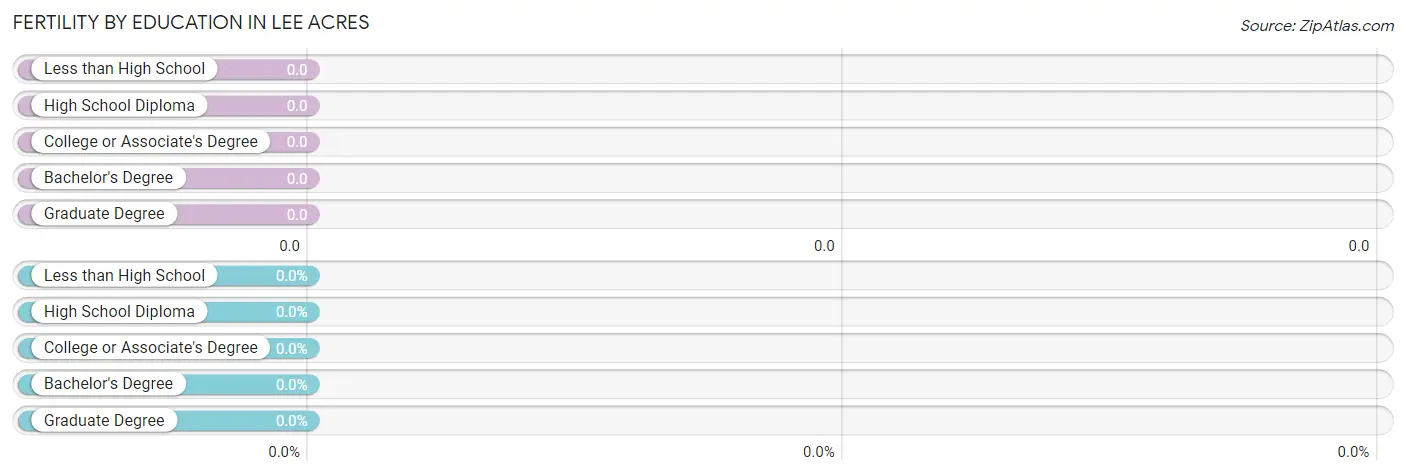
| Educational Attainment | Women with Births | Births / 1,000 Women |
| Less than High School | 0 (0.0%) | 0.0 |
| High School Diploma | 0 (0.0%) | 0.0 |
| College or Associate's Degree | 0 (0.0%) | 0.0 |
| Bachelor's Degree | 0 (0.0%) | 0.0 |
| Graduate Degree | 0 (0.0%) | 0.0 |
| Total | 0 (0.0%) | 0.0 |
Fertility by Education by Marriage Status in Lee Acres
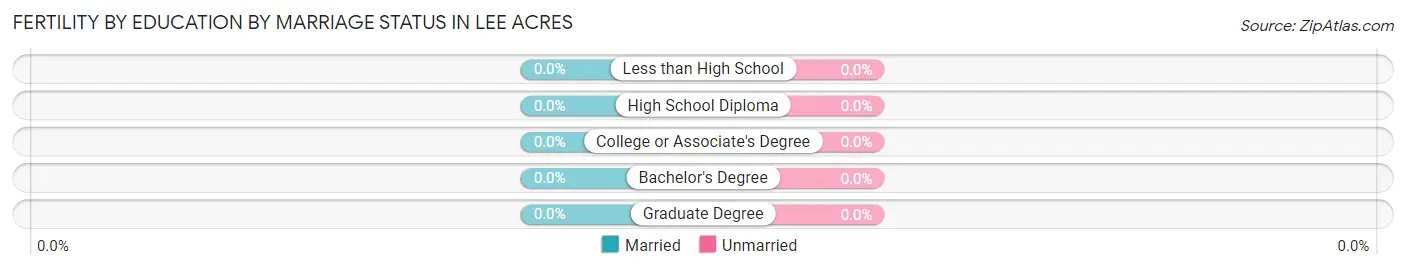
| Educational Attainment | Married | Unmarried |
| Less than High School | 0 (0.0%) | 0 (0.0%) |
| High School Diploma | 0 (0.0%) | 0 (0.0%) |
| College or Associate's Degree | 0 (0.0%) | 0 (0.0%) |
| Bachelor's Degree | 0 (0.0%) | 0 (0.0%) |
| Graduate Degree | 0 (0.0%) | 0 (0.0%) |
| Total | 0 (0.0%) | 0 (0.0%) |
Income in Lee Acres
Income Overview in Lee Acres
Per Capita Income in Lee Acres is $23,283, while median incomes of families and households are $52,847 and $44,850 respectively.
| Characteristic | Number | Measure |
| Per Capita Income | 4,858 | $23,283 |
| Median Family Income | 1,049 | $52,847 |
| Mean Family Income | 1,049 | $81,846 |
| Median Household Income | 1,745 | $44,850 |
| Mean Household Income | 1,745 | $63,519 |
| Income Deficit | 1,049 | $0 |
| Wage / Income Gap (%) | 4,858 | 22.82% |
| Wage / Income Gap ($) | 4,858 | 77.18¢ per $1 |
| Gini / Inequality Index | 4,858 | 0.47 |
Earnings by Sex in Lee Acres
Average Earnings in Lee Acres are $40,098, $46,809 for men and $36,127 for women, a difference of 22.8%.
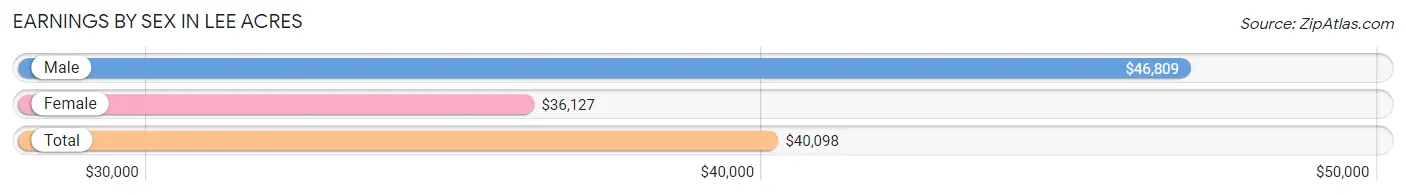
| Sex | Number | Average Earnings |
| Male | 725 (51.7%) | $46,809 |
| Female | 678 (48.3%) | $36,127 |
| Total | 1,403 (100.0%) | $40,098 |
Earnings by Sex by Income Bracket in Lee Acres
The most common earnings brackets in Lee Acres are $100,000+ for men (171 | 23.6%) and $35,000 to $39,999 for women (116 | 17.1%).
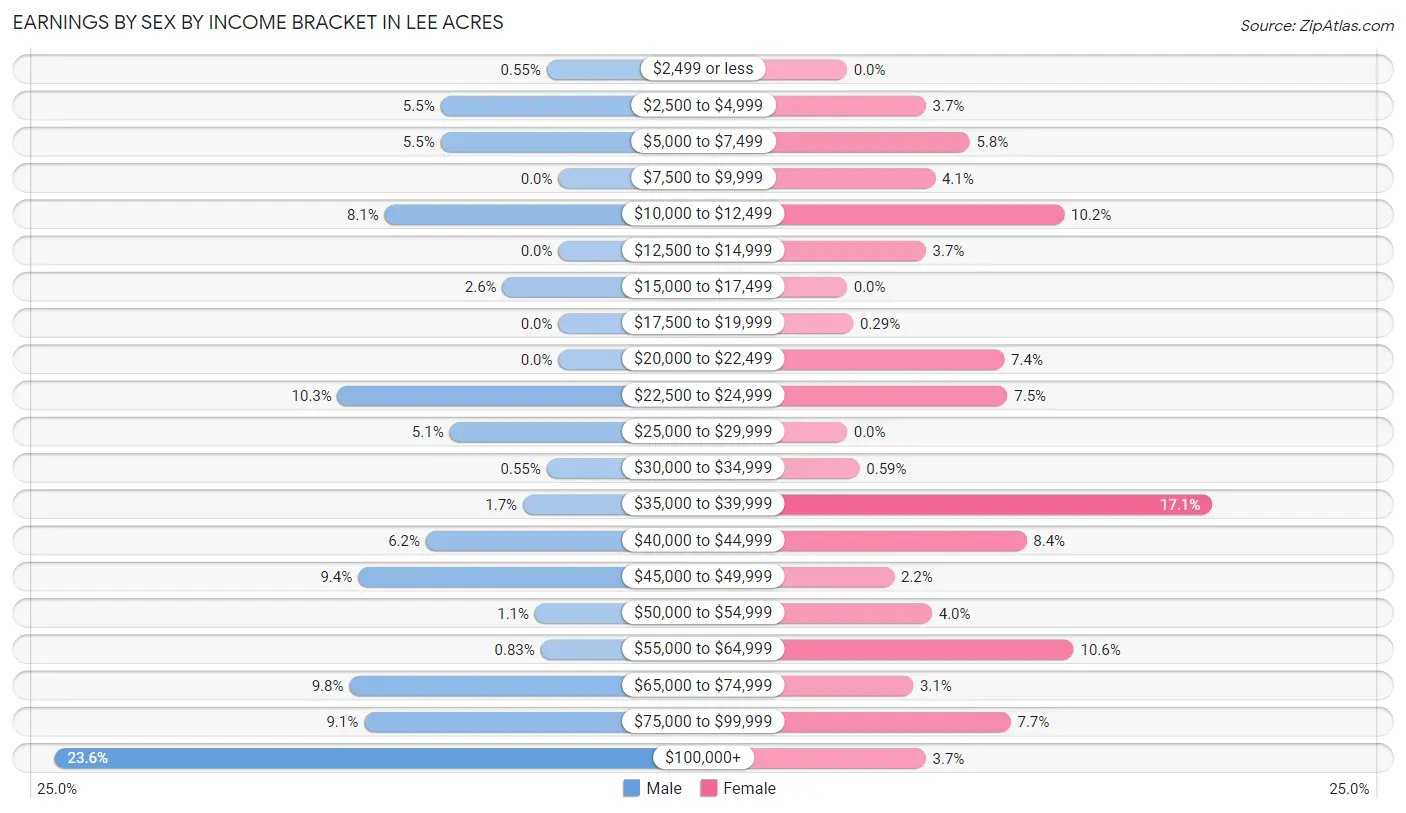
| Income | Male | Female |
| $2,499 or less | 4 (0.5%) | 0 (0.0%) |
| $2,500 to $4,999 | 40 (5.5%) | 25 (3.7%) |
| $5,000 to $7,499 | 40 (5.5%) | 39 (5.8%) |
| $7,500 to $9,999 | 0 (0.0%) | 28 (4.1%) |
| $10,000 to $12,499 | 59 (8.1%) | 69 (10.2%) |
| $12,500 to $14,999 | 0 (0.0%) | 25 (3.7%) |
| $15,000 to $17,499 | 19 (2.6%) | 0 (0.0%) |
| $17,500 to $19,999 | 0 (0.0%) | 2 (0.3%) |
| $20,000 to $22,499 | 0 (0.0%) | 50 (7.4%) |
| $22,500 to $24,999 | 75 (10.3%) | 51 (7.5%) |
| $25,000 to $29,999 | 37 (5.1%) | 0 (0.0%) |
| $30,000 to $34,999 | 4 (0.5%) | 4 (0.6%) |
| $35,000 to $39,999 | 12 (1.7%) | 116 (17.1%) |
| $40,000 to $44,999 | 45 (6.2%) | 57 (8.4%) |
| $45,000 to $49,999 | 68 (9.4%) | 15 (2.2%) |
| $50,000 to $54,999 | 8 (1.1%) | 27 (4.0%) |
| $55,000 to $64,999 | 6 (0.8%) | 72 (10.6%) |
| $65,000 to $74,999 | 71 (9.8%) | 21 (3.1%) |
| $75,000 to $99,999 | 66 (9.1%) | 52 (7.7%) |
| $100,000+ | 171 (23.6%) | 25 (3.7%) |
| Total | 725 (100.0%) | 678 (100.0%) |
Earnings by Sex by Educational Attainment in Lee Acres
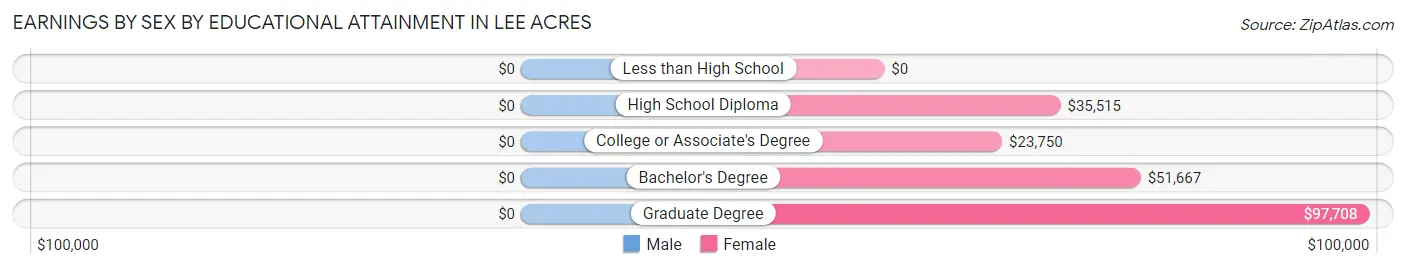
| Educational Attainment | Male Income | Female Income |
| Less than High School | - | - |
| High School Diploma | - | - |
| College or Associate's Degree | - | - |
| Bachelor's Degree | - | - |
| Graduate Degree | - | - |
| Total | $46,875 | $36,140 |
Family Income in Lee Acres
Family Income Brackets in Lee Acres
According to the Lee Acres family income data, there are 199 families falling into the $15,000 to $24,999 income range, which is the most common income bracket and makes up 19.0% of all families. Conversely, the less than $10,000 income bracket is the least frequent group with only 6 families (0.6%) belonging to this category.
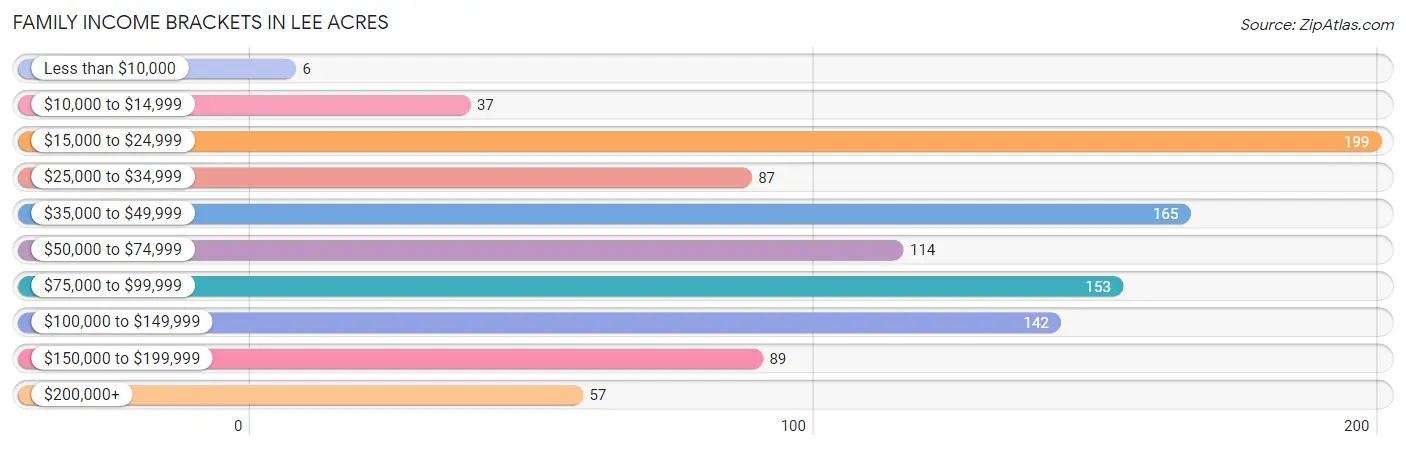
| Income Bracket | # Families | % Families |
| Less than $10,000 | 6 | 0.6% |
| $10,000 to $14,999 | 37 | 3.5% |
| $15,000 to $24,999 | 199 | 19.0% |
| $25,000 to $34,999 | 87 | 8.3% |
| $35,000 to $49,999 | 165 | 15.7% |
| $50,000 to $74,999 | 114 | 10.9% |
| $75,000 to $99,999 | 153 | 14.6% |
| $100,000 to $149,999 | 142 | 13.5% |
| $150,000 to $199,999 | 89 | 8.5% |
| $200,000+ | 57 | 5.4% |
Family Income by Famaliy Size in Lee Acres
4-person families (199 | 19.0%) account for the highest median family income in Lee Acres with $96,461 per family, while 2-person families (467 | 44.5%) have the highest median income of $43,802 per family member.
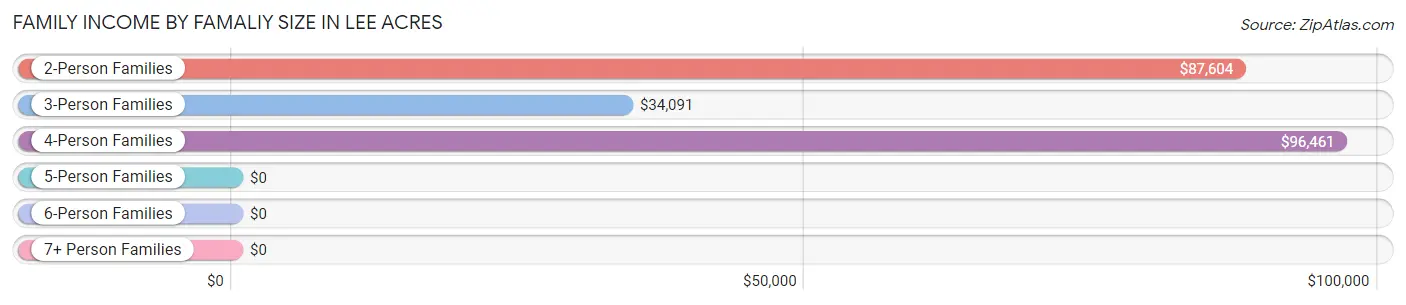
| Income Bracket | # Families | Median Income |
| 2-Person Families | 467 (44.5%) | $87,604 |
| 3-Person Families | 160 (15.2%) | $34,091 |
| 4-Person Families | 199 (19.0%) | $96,461 |
| 5-Person Families | 223 (21.3%) | $0 |
| 6-Person Families | 0 (0.0%) | $0 |
| 7+ Person Families | 0 (0.0%) | $0 |
| Total | 1,049 (100.0%) | $52,847 |
Family Income by Number of Earners in Lee Acres
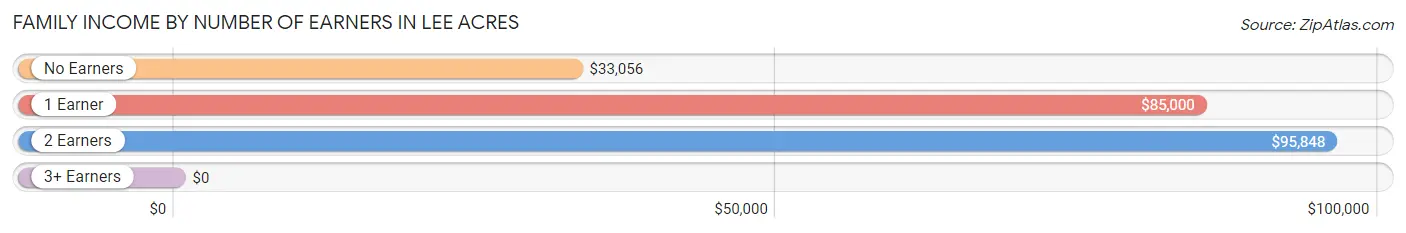
| Number of Earners | # Families | Median Income |
| No Earners | 410 (39.1%) | $33,056 |
| 1 Earner | 314 (29.9%) | $85,000 |
| 2 Earners | 321 (30.6%) | $95,848 |
| 3+ Earners | 4 (0.4%) | $0 |
| Total | 1,049 (100.0%) | $52,847 |
Household Income in Lee Acres
Household Income Brackets in Lee Acres
With 323 households falling in the category, the $35,000 to $49,999 income range is the most frequent in Lee Acres, accounting for 18.5% of all households. In contrast, only 58 households (3.3%) fall into the $200,000+ income bracket, making it the least populous group.
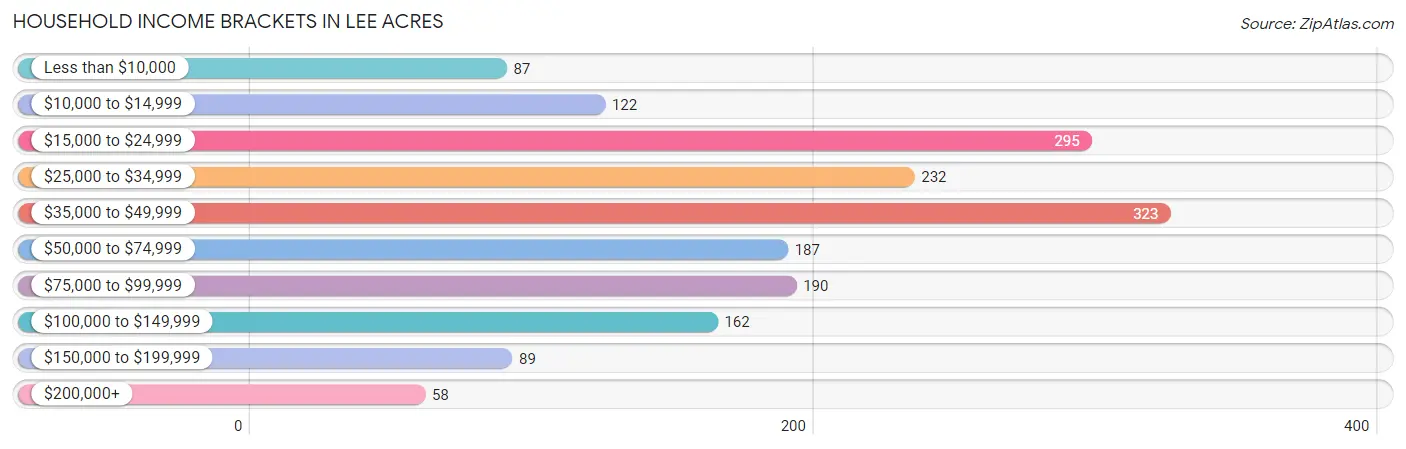
| Income Bracket | # Households | % Households |
| Less than $10,000 | 87 | 5.0% |
| $10,000 to $14,999 | 122 | 7.0% |
| $15,000 to $24,999 | 295 | 16.9% |
| $25,000 to $34,999 | 232 | 13.3% |
| $35,000 to $49,999 | 323 | 18.5% |
| $50,000 to $74,999 | 187 | 10.7% |
| $75,000 to $99,999 | 190 | 10.9% |
| $100,000 to $149,999 | 162 | 9.3% |
| $150,000 to $199,999 | 89 | 5.1% |
| $200,000+ | 58 | 3.3% |
Household Income by Householder Age in Lee Acres
The median household income in Lee Acres is $44,850, with the highest median household income of $55,000 found in the 45 to 64 years age bracket for the primary householder. A total of 628 households (36.0%) fall into this category. Meanwhile, the 15 to 24 years age bracket for the primary householder has the lowest median household income of $0, with 5 households (0.3%) in this group.
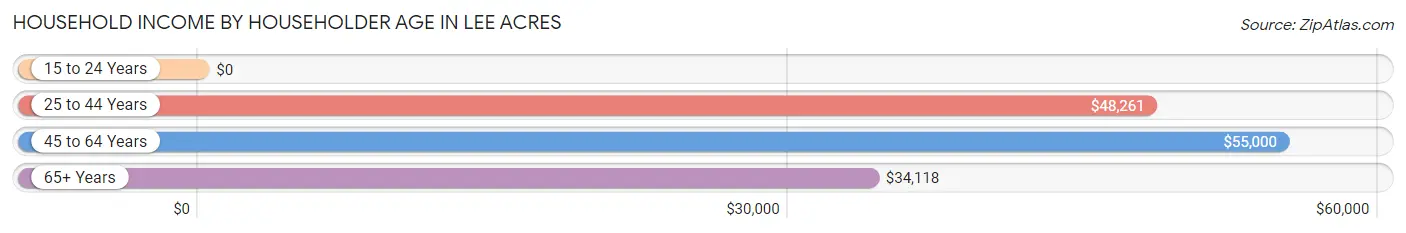
| Income Bracket | # Households | Median Income |
| 15 to 24 Years | 5 (0.3%) | $0 |
| 25 to 44 Years | 456 (26.1%) | $48,261 |
| 45 to 64 Years | 628 (36.0%) | $55,000 |
| 65+ Years | 656 (37.6%) | $34,118 |
| Total | 1,745 (100.0%) | $44,850 |
Poverty in Lee Acres
Income Below Poverty by Sex and Age in Lee Acres
With 41.2% poverty level for males and 28.7% for females among the residents of Lee Acres, 18 to 24 year old males and under 5 year old females are the most vulnerable to poverty, with 369 males (95.1%) and 8 females (100.0%) in their respective age groups living below the poverty level.
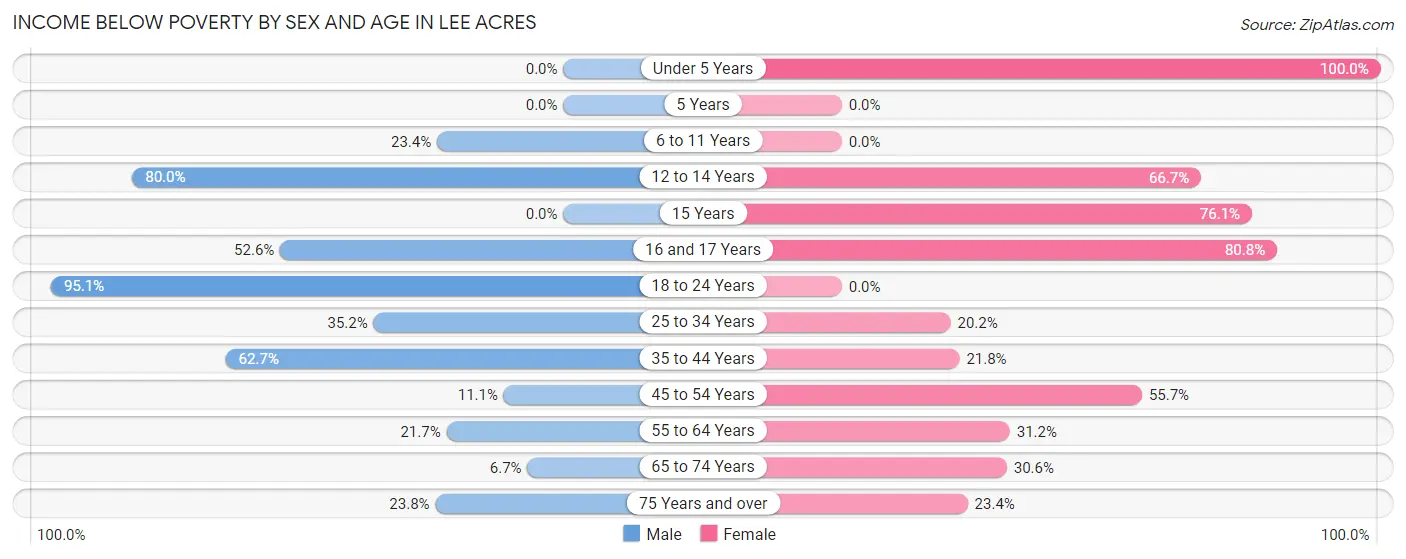
| Age Bracket | Male | Female |
| Under 5 Years | 0 (0.0%) | 8 (100.0%) |
| 5 Years | 0 (0.0%) | 0 (0.0%) |
| 6 to 11 Years | 79 (23.4%) | 0 (0.0%) |
| 12 to 14 Years | 76 (80.0%) | 34 (66.7%) |
| 15 Years | 0 (0.0%) | 51 (76.1%) |
| 16 and 17 Years | 82 (52.6%) | 63 (80.8%) |
| 18 to 24 Years | 369 (95.1%) | 0 (0.0%) |
| 25 to 34 Years | 68 (35.2%) | 67 (20.2%) |
| 35 to 44 Years | 163 (62.7%) | 69 (21.8%) |
| 45 to 54 Years | 19 (11.1%) | 122 (55.7%) |
| 55 to 64 Years | 72 (21.7%) | 121 (31.2%) |
| 65 to 74 Years | 11 (6.7%) | 109 (30.6%) |
| 75 Years and over | 57 (23.7%) | 57 (23.4%) |
| Total | 996 (41.2%) | 701 (28.7%) |
Income Above Poverty by Sex and Age in Lee Acres
According to the poverty statistics in Lee Acres, males aged under 5 years and females aged 6 to 11 years are the age groups that are most secure financially, with 100.0% of males and 100.0% of females in these age groups living above the poverty line.
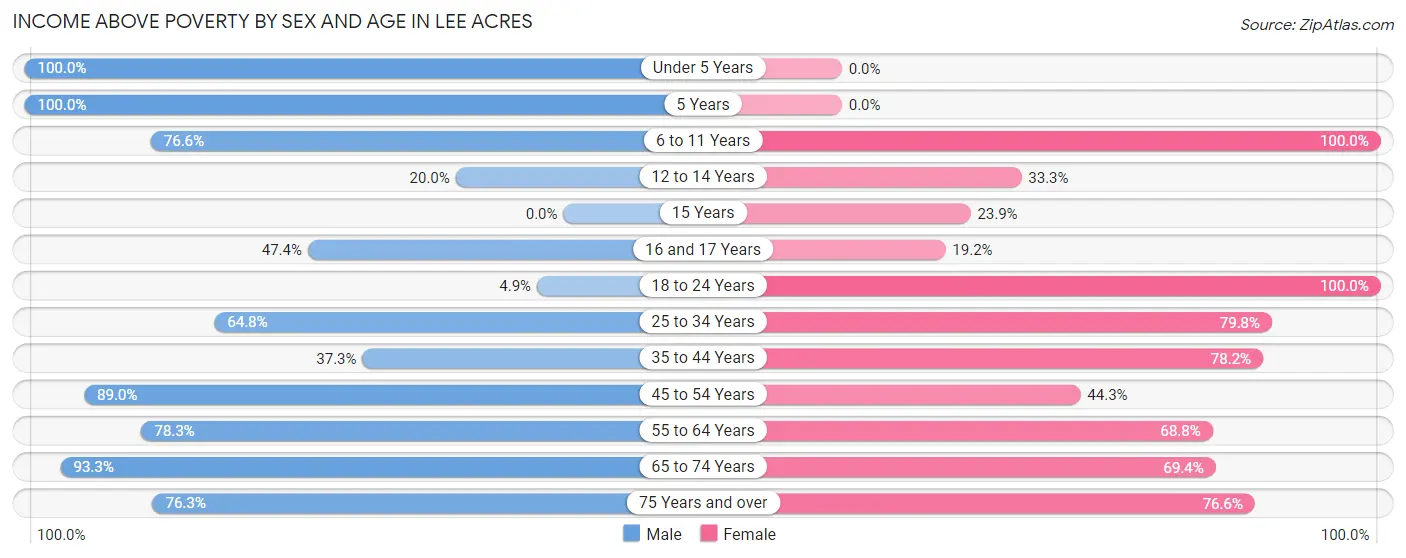
| Age Bracket | Male | Female |
| Under 5 Years | 76 (100.0%) | 0 (0.0%) |
| 5 Years | 3 (100.0%) | 0 (0.0%) |
| 6 to 11 Years | 258 (76.6%) | 343 (100.0%) |
| 12 to 14 Years | 19 (20.0%) | 17 (33.3%) |
| 15 Years | 0 (0.0%) | 16 (23.9%) |
| 16 and 17 Years | 74 (47.4%) | 15 (19.2%) |
| 18 to 24 Years | 19 (4.9%) | 39 (100.0%) |
| 25 to 34 Years | 125 (64.8%) | 265 (79.8%) |
| 35 to 44 Years | 97 (37.3%) | 247 (78.2%) |
| 45 to 54 Years | 153 (88.9%) | 97 (44.3%) |
| 55 to 64 Years | 260 (78.3%) | 267 (68.8%) |
| 65 to 74 Years | 154 (93.3%) | 247 (69.4%) |
| 75 Years and over | 183 (76.2%) | 187 (76.6%) |
| Total | 1,421 (58.8%) | 1,740 (71.3%) |
Income Below Poverty Among Married-Couple Families in Lee Acres
The poverty statistics for married-couple families in Lee Acres show that 18.4% or 162 of the total 882 families live below the poverty line. Families with 1 or 2 children have the highest poverty rate of 29.7%, comprising of 137 families. On the other hand, families with 3 or 4 children have the lowest poverty rate of 0.0%, which includes 0 families.
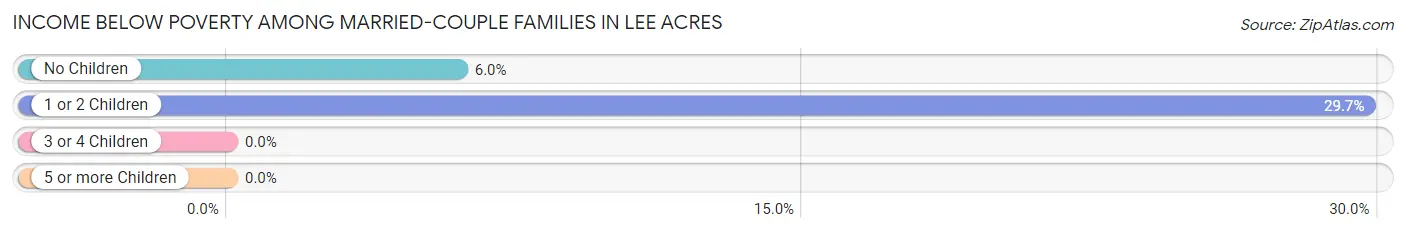
| Children | Above Poverty | Below Poverty |
| No Children | 392 (94.0%) | 25 (6.0%) |
| 1 or 2 Children | 324 (70.3%) | 137 (29.7%) |
| 3 or 4 Children | 4 (100.0%) | 0 (0.0%) |
| 5 or more Children | 0 (0.0%) | 0 (0.0%) |
| Total | 720 (81.6%) | 162 (18.4%) |
Income Below Poverty Among Single-Parent Households in Lee Acres
According to the poverty data in Lee Acres, 62.5% or 25 single-father households and 31.5% or 40 single-mother households are living below the poverty line. Among single-father households, those with 1 or 2 children have the highest poverty rate, with 25 households (71.4%) experiencing poverty. Likewise, among single-mother households, those with 3 or 4 children have the highest poverty rate, with 28 households (100.0%) falling below the poverty line.
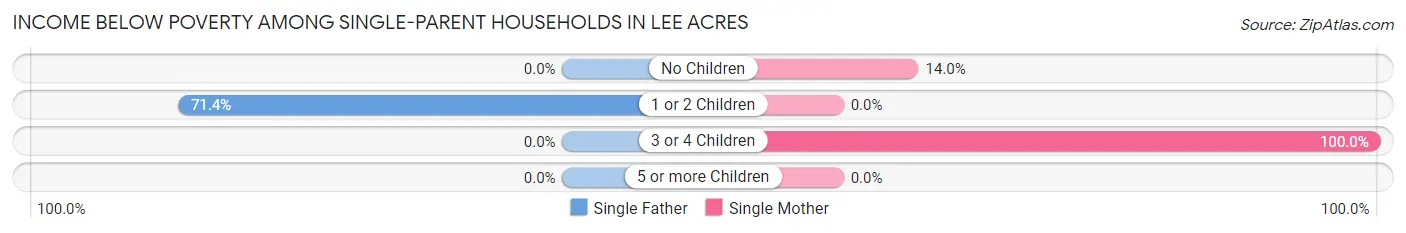
| Children | Single Father | Single Mother |
| No Children | 0 (0.0%) | 12 (14.0%) |
| 1 or 2 Children | 25 (71.4%) | 0 (0.0%) |
| 3 or 4 Children | 0 (0.0%) | 28 (100.0%) |
| 5 or more Children | 0 (0.0%) | 0 (0.0%) |
| Total | 25 (62.5%) | 40 (31.5%) |
Income Below Poverty Among Married-Couple vs Single-Parent Households in Lee Acres
The poverty data for Lee Acres shows that 162 of the married-couple family households (18.4%) and 65 of the single-parent households (38.9%) are living below the poverty level. Within the married-couple family households, those with 1 or 2 children have the highest poverty rate, with 137 households (29.7%) falling below the poverty line. Among the single-parent households, those with 3 or 4 children have the highest poverty rate, with 28 household (100.0%) living below poverty.
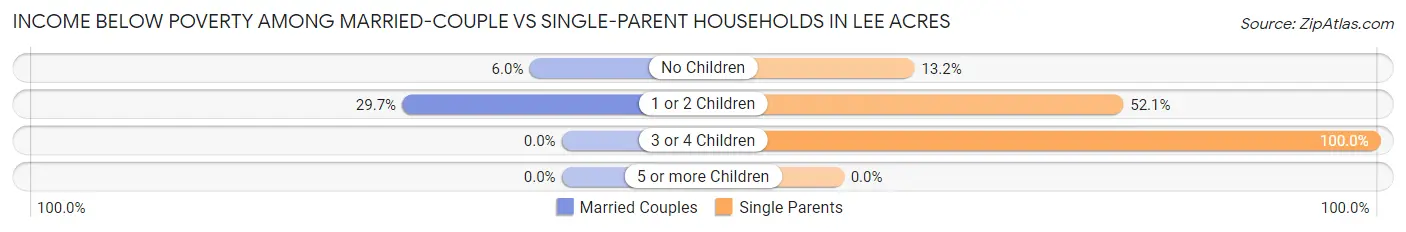
| Children | Married-Couple Families | Single-Parent Households |
| No Children | 25 (6.0%) | 12 (13.2%) |
| 1 or 2 Children | 137 (29.7%) | 25 (52.1%) |
| 3 or 4 Children | 0 (0.0%) | 28 (100.0%) |
| 5 or more Children | 0 (0.0%) | 0 (0.0%) |
| Total | 162 (18.4%) | 65 (38.9%) |
Employment Characteristics in Lee Acres
Employment by Class of Employer in Lee Acres
Among the 1,317 employed individuals in Lee Acres, private company employees (841 | 63.9%), local government employees (152 | 11.5%), and self-employed (not incorporated) (138 | 10.5%) make up the most common classes of employment.
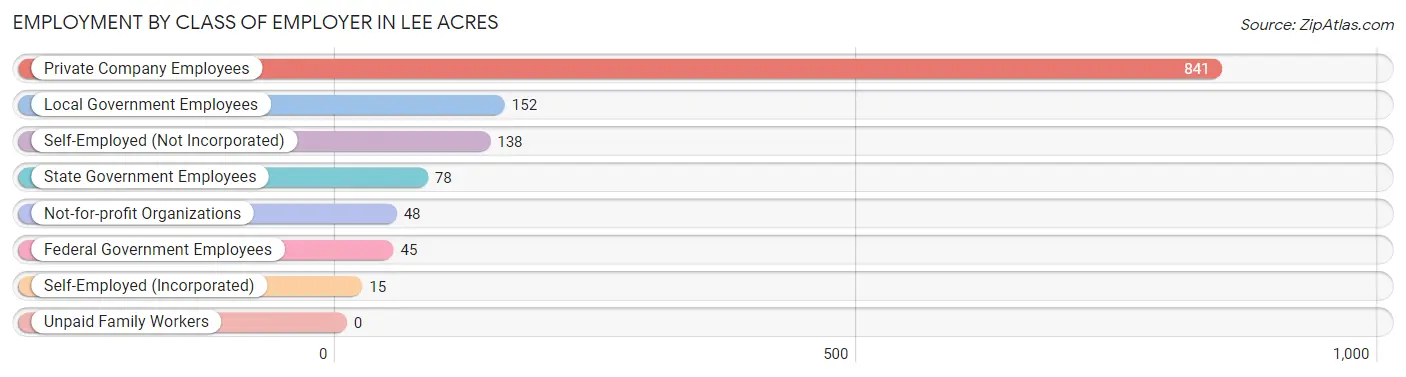
| Employer Class | # Employees | % Employees |
| Private Company Employees | 841 | 63.9% |
| Self-Employed (Incorporated) | 15 | 1.1% |
| Self-Employed (Not Incorporated) | 138 | 10.5% |
| Not-for-profit Organizations | 48 | 3.6% |
| Local Government Employees | 152 | 11.5% |
| State Government Employees | 78 | 5.9% |
| Federal Government Employees | 45 | 3.4% |
| Unpaid Family Workers | 0 | 0.0% |
| Total | 1,317 | 100.0% |
Employment Status by Age in Lee Acres
According to the labor force statistics for Lee Acres, out of the total population over 16 years of age (3,878), 44.8% or 1,737 individuals are in the labor force, with 22.3% or 387 of them unemployed. The age group with the highest labor force participation rate is 20 to 24 years, with 85.4% or 346 individuals in the labor force. Within the labor force, the 20 to 24 years age range has the highest percentage of unemployed individuals, with 97.4% or 337 of them being unemployed.
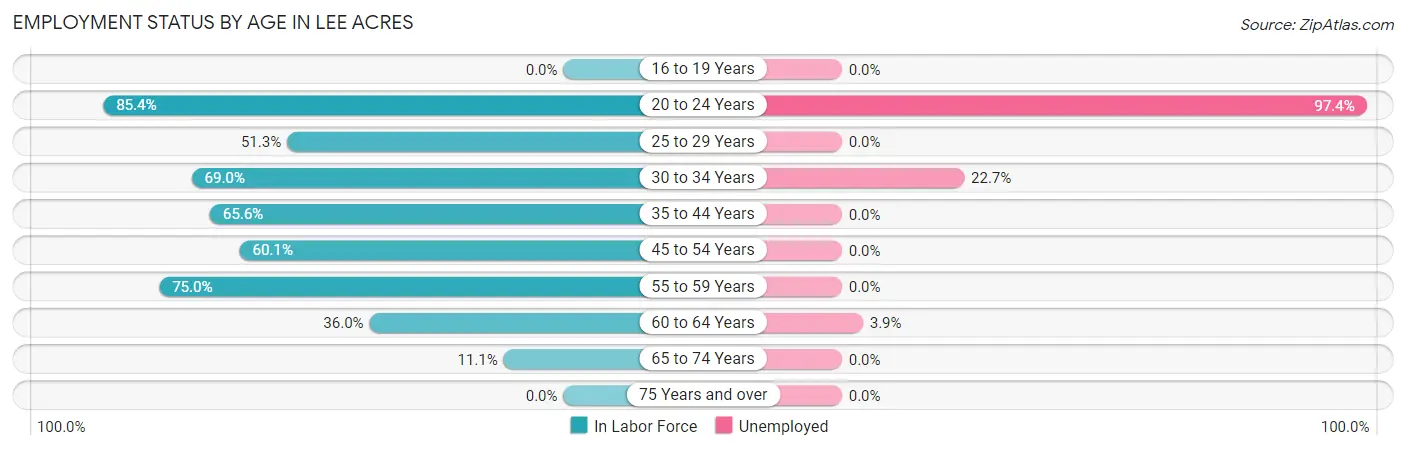
| Age Bracket | In Labor Force | Unemployed |
| 16 to 19 Years | 0 (0.0%) | 0 (0.0%) |
| 20 to 24 Years | 346 (85.4%) | 337 (97.4%) |
| 25 to 29 Years | 122 (51.3%) | 0 (0.0%) |
| 30 to 34 Years | 198 (69.0%) | 45 (22.7%) |
| 35 to 44 Years | 378 (65.6%) | 0 (0.0%) |
| 45 to 54 Years | 235 (60.1%) | 0 (0.0%) |
| 55 to 59 Years | 273 (75.0%) | 0 (0.0%) |
| 60 to 64 Years | 128 (36.0%) | 5 (3.9%) |
| 65 to 74 Years | 58 (11.1%) | 0 (0.0%) |
| 75 Years and over | 0 (0.0%) | 0 (0.0%) |
| Total | 1,737 (44.8%) | 387 (22.3%) |
Employment Status by Educational Attainment in Lee Acres
According to labor force statistics for Lee Acres, 60.3% of individuals (1,334) out of the total population between 25 and 64 years of age (2,212) are in the labor force, with 3.7% or 49 of them being unemployed. The group with the highest labor force participation rate are those with the educational attainment of college / associate degree, with 66.7% or 288 individuals in the labor force. Within the labor force, individuals with high school diploma education have the highest percentage of unemployment, with 6.6% or 45 of them being unemployed.
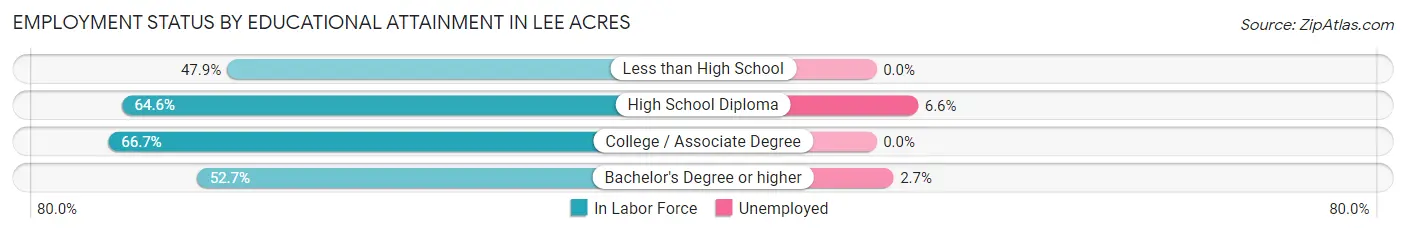
| Educational Attainment | In Labor Force | Unemployed |
| Less than High School | 175 (47.9%) | 0 (0.0%) |
| High School Diploma | 683 (64.6%) | 70 (6.6%) |
| College / Associate Degree | 288 (66.7%) | 0 (0.0%) |
| Bachelor's Degree or higher | 188 (52.7%) | 10 (2.7%) |
| Total | 1,334 (60.3%) | 82 (3.7%) |
Employment Occupations by Sex in Lee Acres
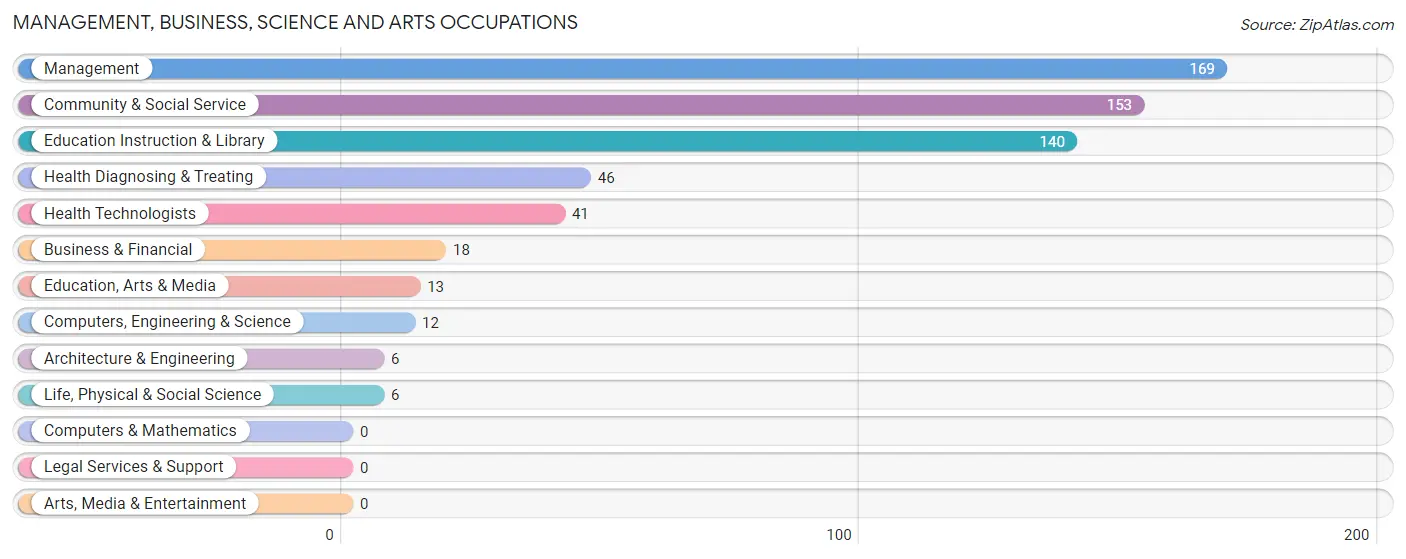
Management, Business, Science and Arts Occupations
The most common Management, Business, Science and Arts occupations in Lee Acres are Management (169 | 12.5%), Community & Social Service (153 | 11.3%), Education Instruction & Library (140 | 10.4%), Health Diagnosing & Treating (46 | 3.4%), and Health Technologists (41 | 3.0%).
Management, Business, Science and Arts Occupations by Sex
Within the Management, Business, Science and Arts occupations in Lee Acres, the most male-oriented occupations are Management (85.2%), Business & Financial (61.1%), and Architecture & Engineering (50.0%), while the most female-oriented occupations are Life, Physical & Social Science (100.0%), Community & Social Service (100.0%), and Education, Arts & Media (100.0%).
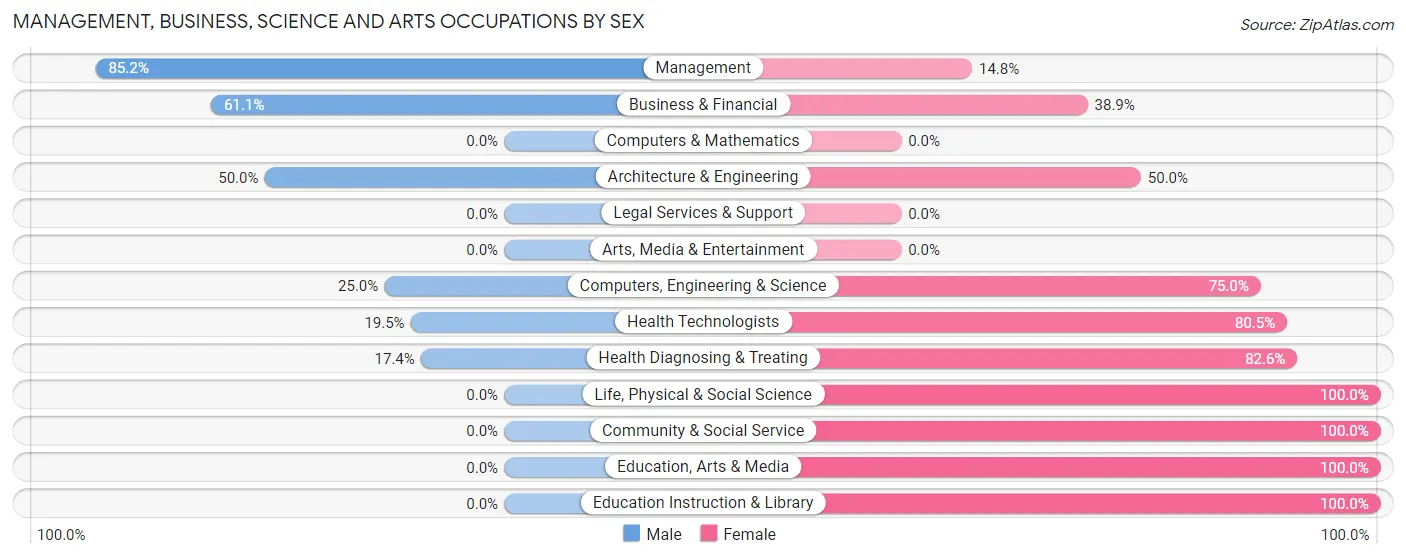
| Occupation | Male | Female |
| Management | 144 (85.2%) | 25 (14.8%) |
| Business & Financial | 11 (61.1%) | 7 (38.9%) |
| Computers, Engineering & Science | 3 (25.0%) | 9 (75.0%) |
| Computers & Mathematics | 0 (0.0%) | 0 (0.0%) |
| Architecture & Engineering | 3 (50.0%) | 3 (50.0%) |
| Life, Physical & Social Science | 0 (0.0%) | 6 (100.0%) |
| Community & Social Service | 0 (0.0%) | 153 (100.0%) |
| Education, Arts & Media | 0 (0.0%) | 13 (100.0%) |
| Legal Services & Support | 0 (0.0%) | 0 (0.0%) |
| Education Instruction & Library | 0 (0.0%) | 140 (100.0%) |
| Arts, Media & Entertainment | 0 (0.0%) | 0 (0.0%) |
| Health Diagnosing & Treating | 8 (17.4%) | 38 (82.6%) |
| Health Technologists | 8 (19.5%) | 33 (80.5%) |
| Total (Category) | 166 (41.7%) | 232 (58.3%) |
| Total (Overall) | 708 (52.4%) | 643 (47.6%) |
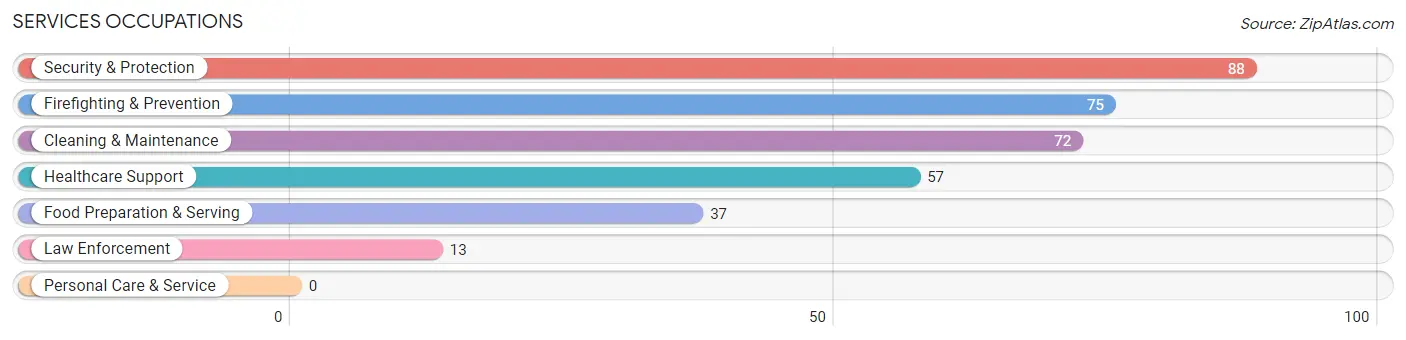
Services Occupations
The most common Services occupations in Lee Acres are Security & Protection (88 | 6.5%), Firefighting & Prevention (75 | 5.6%), Cleaning & Maintenance (72 | 5.3%), Healthcare Support (57 | 4.2%), and Food Preparation & Serving (37 | 2.7%).
Services Occupations by Sex
Within the Services occupations in Lee Acres, the most male-oriented occupations are Food Preparation & Serving (100.0%), Cleaning & Maintenance (100.0%), and Firefighting & Prevention (94.7%), while the most female-oriented occupations are Healthcare Support (100.0%), Law Enforcement (46.2%), and Security & Protection (11.4%).
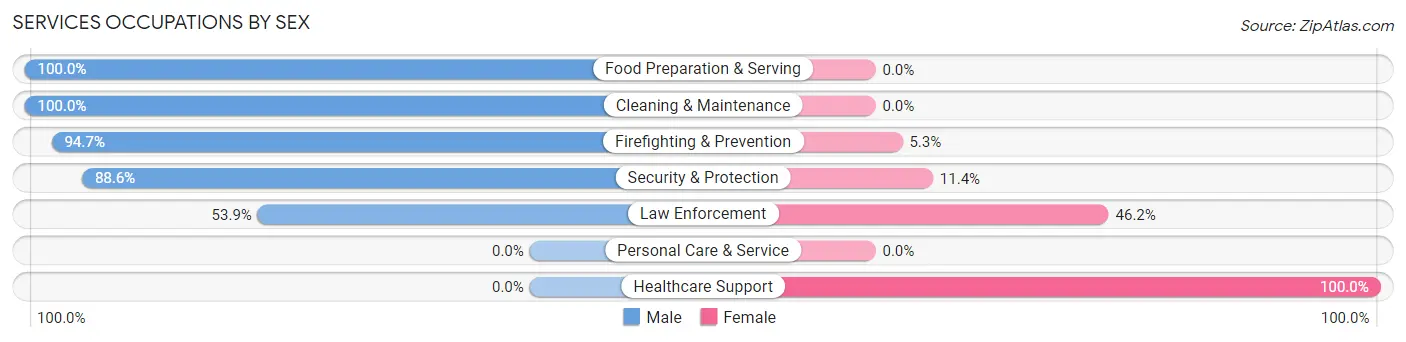
| Occupation | Male | Female |
| Healthcare Support | 0 (0.0%) | 57 (100.0%) |
| Security & Protection | 78 (88.6%) | 10 (11.4%) |
| Firefighting & Prevention | 71 (94.7%) | 4 (5.3%) |
| Law Enforcement | 7 (53.8%) | 6 (46.2%) |
| Food Preparation & Serving | 37 (100.0%) | 0 (0.0%) |
| Cleaning & Maintenance | 72 (100.0%) | 0 (0.0%) |
| Personal Care & Service | 0 (0.0%) | 0 (0.0%) |
| Total (Category) | 187 (73.6%) | 67 (26.4%) |
| Total (Overall) | 708 (52.4%) | 643 (47.6%) |
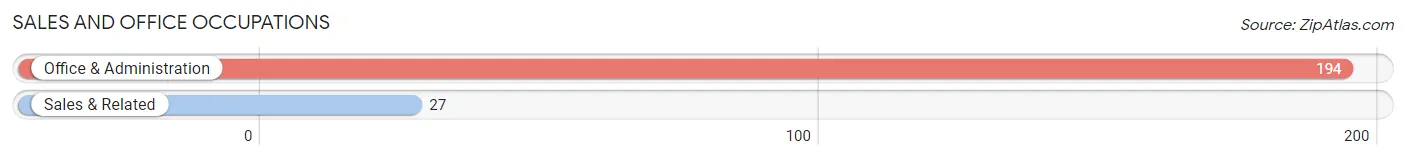
Sales and Office Occupations
The most common Sales and Office occupations in Lee Acres are Office & Administration (194 | 14.4%), and Sales & Related (27 | 2.0%).
Sales and Office Occupations by Sex
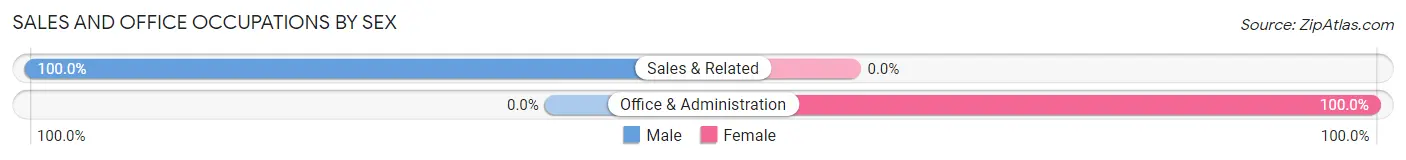
| Occupation | Male | Female |
| Sales & Related | 27 (100.0%) | 0 (0.0%) |
| Office & Administration | 0 (0.0%) | 194 (100.0%) |
| Total (Category) | 27 (12.2%) | 194 (87.8%) |
| Total (Overall) | 708 (52.4%) | 643 (47.6%) |
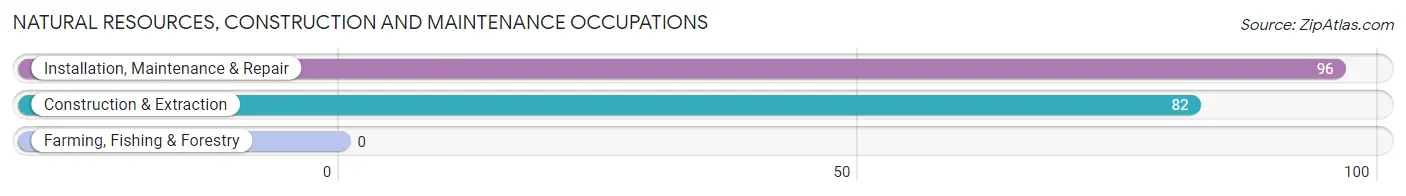
Natural Resources, Construction and Maintenance Occupations
The most common Natural Resources, Construction and Maintenance occupations in Lee Acres are Installation, Maintenance & Repair (96 | 7.1%), and Construction & Extraction (82 | 6.1%).
Natural Resources, Construction and Maintenance Occupations by Sex
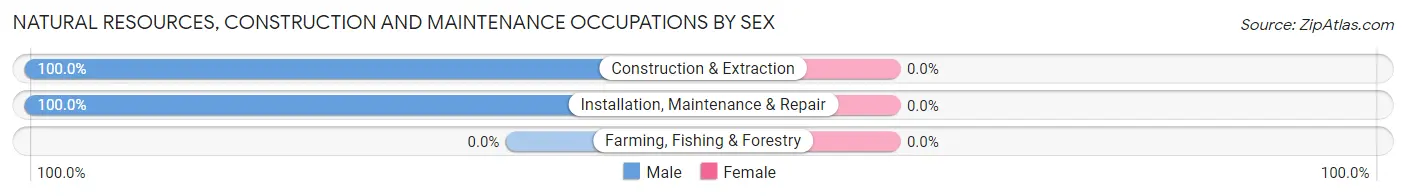
| Occupation | Male | Female |
| Farming, Fishing & Forestry | 0 (0.0%) | 0 (0.0%) |
| Construction & Extraction | 82 (100.0%) | 0 (0.0%) |
| Installation, Maintenance & Repair | 96 (100.0%) | 0 (0.0%) |
| Total (Category) | 178 (100.0%) | 0 (0.0%) |
| Total (Overall) | 708 (52.4%) | 643 (47.6%) |
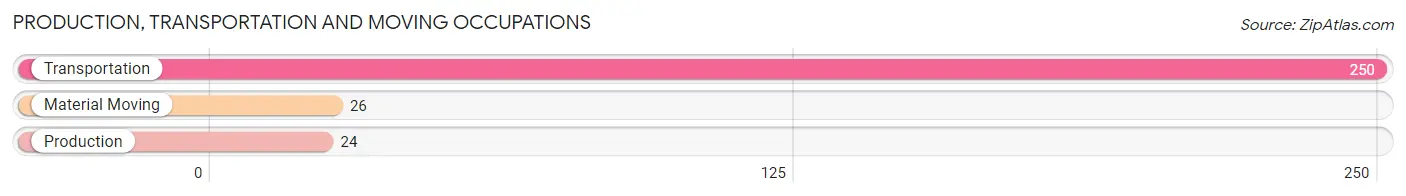
Production, Transportation and Moving Occupations
The most common Production, Transportation and Moving occupations in Lee Acres are Transportation (250 | 18.5%), Material Moving (26 | 1.9%), and Production (24 | 1.8%).
Production, Transportation and Moving Occupations by Sex
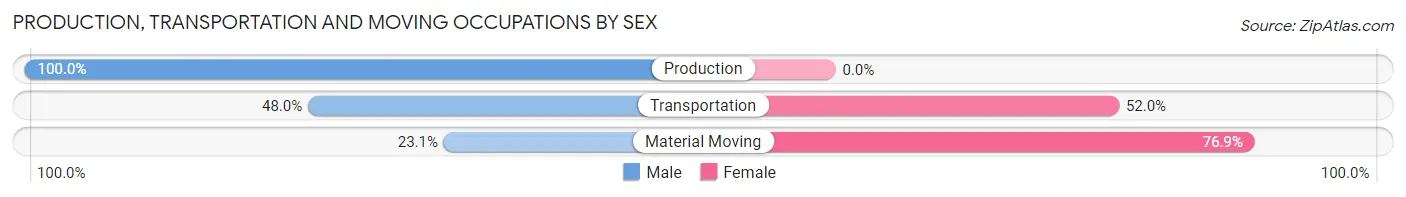
| Occupation | Male | Female |
| Production | 24 (100.0%) | 0 (0.0%) |
| Transportation | 120 (48.0%) | 130 (52.0%) |
| Material Moving | 6 (23.1%) | 20 (76.9%) |
| Total (Category) | 150 (50.0%) | 150 (50.0%) |
| Total (Overall) | 708 (52.4%) | 643 (47.6%) |
Employment Industries by Sex in Lee Acres
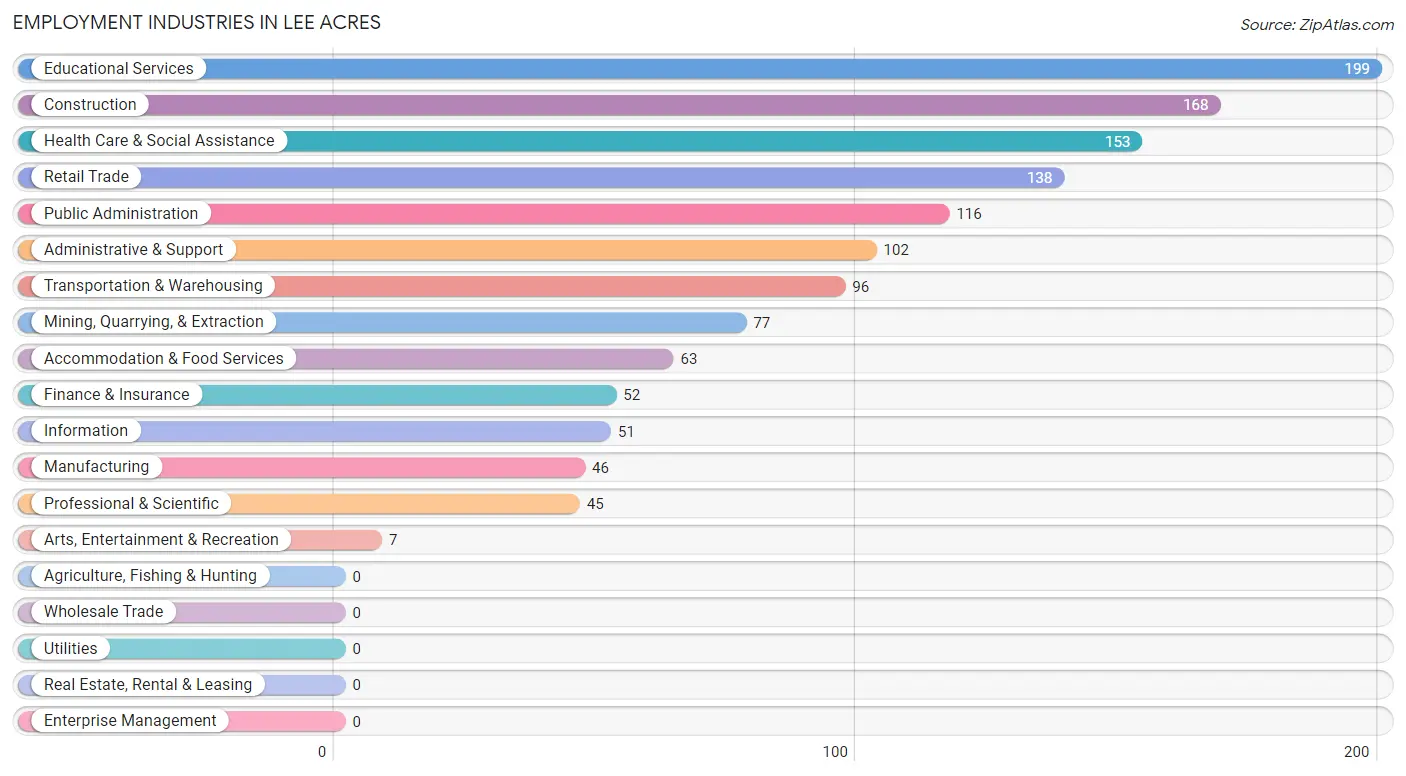
Employment Industries in Lee Acres
The major employment industries in Lee Acres include Educational Services (199 | 14.7%), Construction (168 | 12.4%), Health Care & Social Assistance (153 | 11.3%), Retail Trade (138 | 10.2%), and Public Administration (116 | 8.6%).
Employment Industries by Sex in Lee Acres
The Lee Acres industries that see more men than women are Manufacturing (100.0%), Professional & Scientific (100.0%), and Arts, Entertainment & Recreation (100.0%), whereas the industries that tend to have a higher number of women are Information (100.0%), Finance & Insurance (100.0%), and Administrative & Support (100.0%).
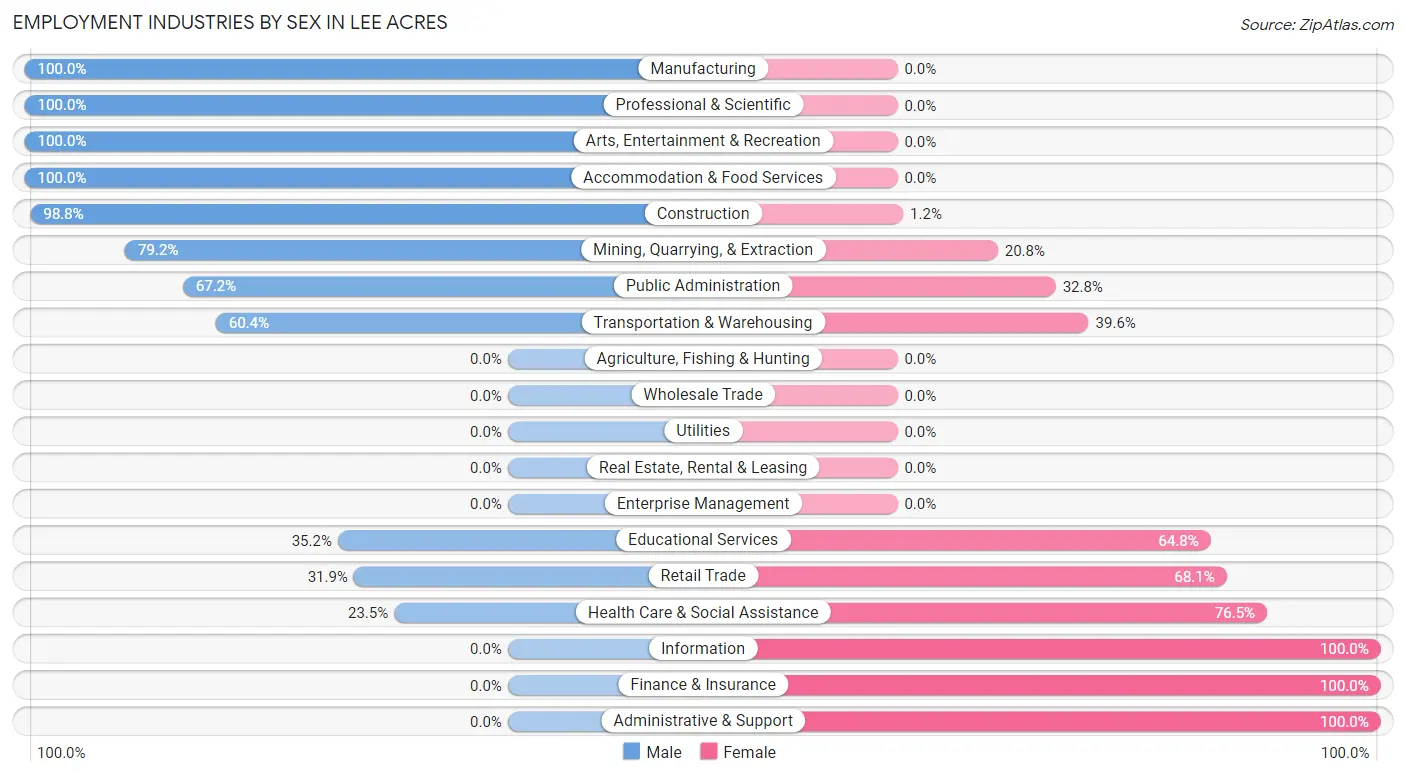
| Industry | Male | Female |
| Agriculture, Fishing & Hunting | 0 (0.0%) | 0 (0.0%) |
| Mining, Quarrying, & Extraction | 61 (79.2%) | 16 (20.8%) |
| Construction | 166 (98.8%) | 2 (1.2%) |
| Manufacturing | 46 (100.0%) | 0 (0.0%) |
| Wholesale Trade | 0 (0.0%) | 0 (0.0%) |
| Retail Trade | 44 (31.9%) | 94 (68.1%) |
| Transportation & Warehousing | 58 (60.4%) | 38 (39.6%) |
| Utilities | 0 (0.0%) | 0 (0.0%) |
| Information | 0 (0.0%) | 51 (100.0%) |
| Finance & Insurance | 0 (0.0%) | 52 (100.0%) |
| Real Estate, Rental & Leasing | 0 (0.0%) | 0 (0.0%) |
| Professional & Scientific | 45 (100.0%) | 0 (0.0%) |
| Enterprise Management | 0 (0.0%) | 0 (0.0%) |
| Administrative & Support | 0 (0.0%) | 102 (100.0%) |
| Educational Services | 70 (35.2%) | 129 (64.8%) |
| Health Care & Social Assistance | 36 (23.5%) | 117 (76.5%) |
| Arts, Entertainment & Recreation | 7 (100.0%) | 0 (0.0%) |
| Accommodation & Food Services | 63 (100.0%) | 0 (0.0%) |
| Public Administration | 78 (67.2%) | 38 (32.8%) |
| Total | 708 (52.4%) | 643 (47.6%) |
Education in Lee Acres
School Enrollment in Lee Acres
The most common levels of schooling among the 941 students in Lee Acres are elementary school (488 | 51.9%), middle school (191 | 20.3%), and high school (115 | 12.2%).
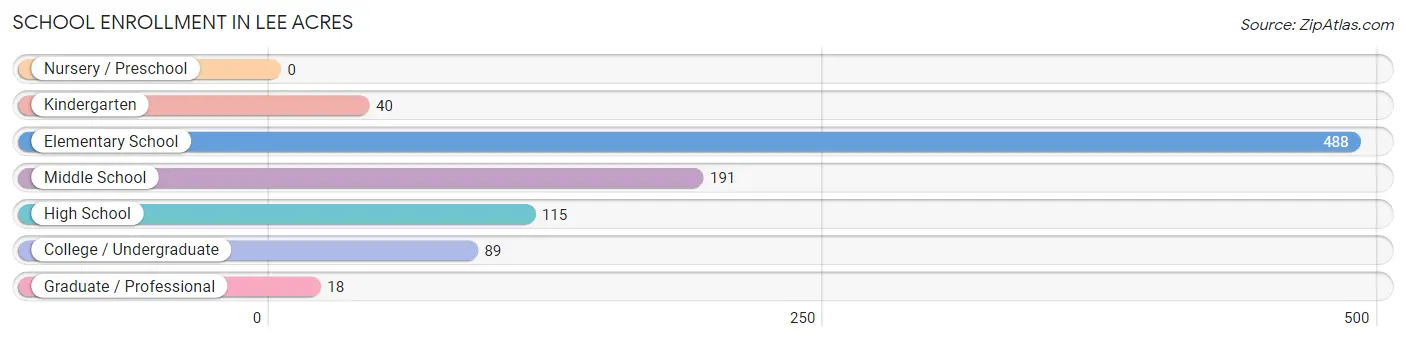
| School Level | # Students | % Students |
| Nursery / Preschool | 0 | 0.0% |
| Kindergarten | 40 | 4.3% |
| Elementary School | 488 | 51.9% |
| Middle School | 191 | 20.3% |
| High School | 115 | 12.2% |
| College / Undergraduate | 89 | 9.5% |
| Graduate / Professional | 18 | 1.9% |
| Total | 941 | 100.0% |
School Enrollment by Age by Funding Source in Lee Acres
Out of a total of 941 students who are enrolled in schools in Lee Acres, 57 (6.1%) attend a private institution, while the remaining 884 (93.9%) are enrolled in public schools. The age group of 5 to 9 year old has the highest likelihood of being enrolled in private schools, with 40 (11.8% in the age bracket) enrolled. Conversely, the age group of 15 to 17 year olds has the lowest likelihood of being enrolled in a private school, with 105 (100.0% in the age bracket) attending a public institution.
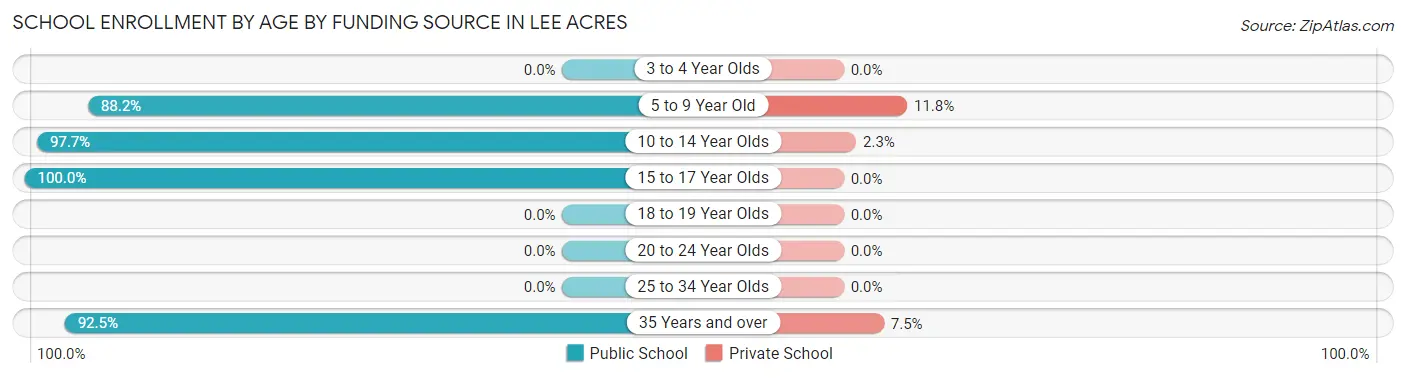
| Age Bracket | Public School | Private School |
| 3 to 4 Year Olds | 0 (0.0%) | 0 (0.0%) |
| 5 to 9 Year Old | 299 (88.2%) | 40 (11.8%) |
| 10 to 14 Year Olds | 381 (97.7%) | 9 (2.3%) |
| 15 to 17 Year Olds | 105 (100.0%) | 0 (0.0%) |
| 18 to 19 Year Olds | 0 (0.0%) | 0 (0.0%) |
| 20 to 24 Year Olds | 0 (0.0%) | 0 (0.0%) |
| 25 to 34 Year Olds | 0 (0.0%) | 0 (0.0%) |
| 35 Years and over | 99 (92.5%) | 8 (7.5%) |
| Total | 884 (93.9%) | 57 (6.1%) |
Educational Attainment by Field of Study in Lee Acres
Engineering (135 | 29.5%), education (91 | 19.9%), social sciences (49 | 10.7%), liberal arts & history (48 | 10.5%), and bio, nature & agricultural (33 | 7.2%) are the most common fields of study among 457 individuals in Lee Acres who have obtained a bachelor's degree or higher.
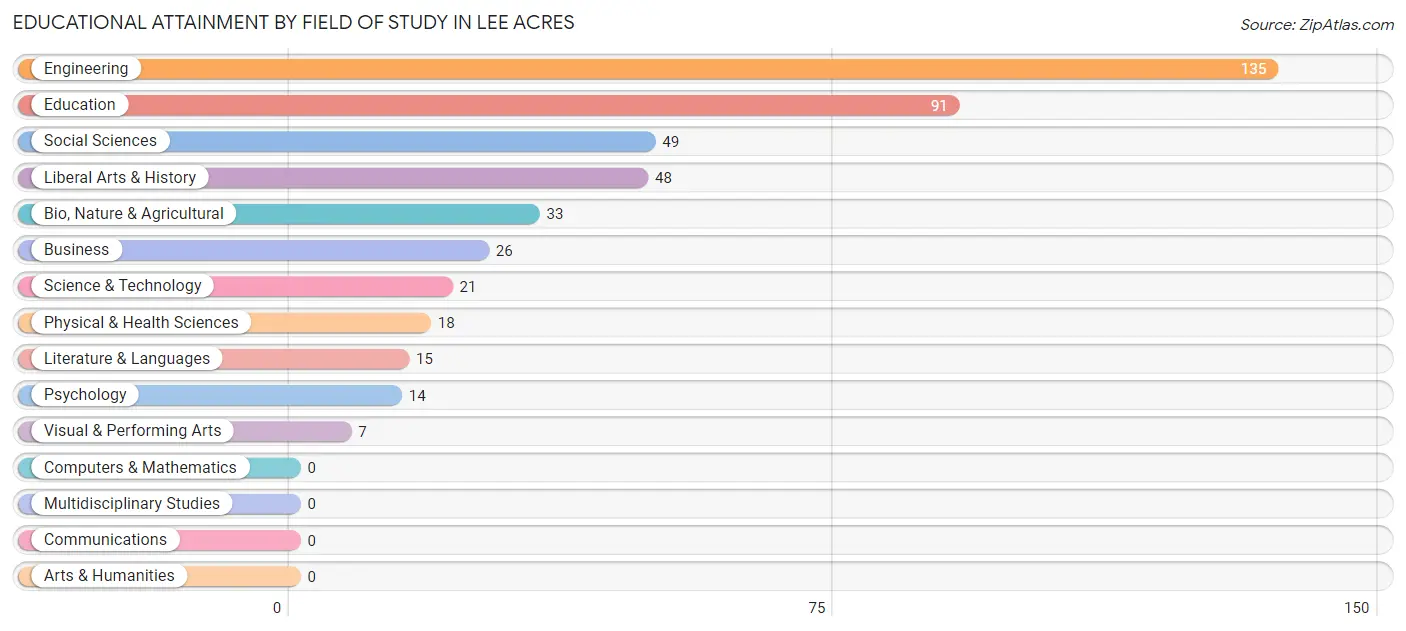
| Field of Study | # Graduates | % Graduates |
| Computers & Mathematics | 0 | 0.0% |
| Bio, Nature & Agricultural | 33 | 7.2% |
| Physical & Health Sciences | 18 | 3.9% |
| Psychology | 14 | 3.1% |
| Social Sciences | 49 | 10.7% |
| Engineering | 135 | 29.5% |
| Multidisciplinary Studies | 0 | 0.0% |
| Science & Technology | 21 | 4.6% |
| Business | 26 | 5.7% |
| Education | 91 | 19.9% |
| Literature & Languages | 15 | 3.3% |
| Liberal Arts & History | 48 | 10.5% |
| Visual & Performing Arts | 7 | 1.5% |
| Communications | 0 | 0.0% |
| Arts & Humanities | 0 | 0.0% |
| Total | 457 | 100.0% |
Transportation & Commute in Lee Acres
Vehicle Availability by Sex in Lee Acres
The most prevalent vehicle ownership categories in Lee Acres are males with 2 vehicles (290, accounting for 43.0%) and females with 2 vehicles (163, making up 45.1%).
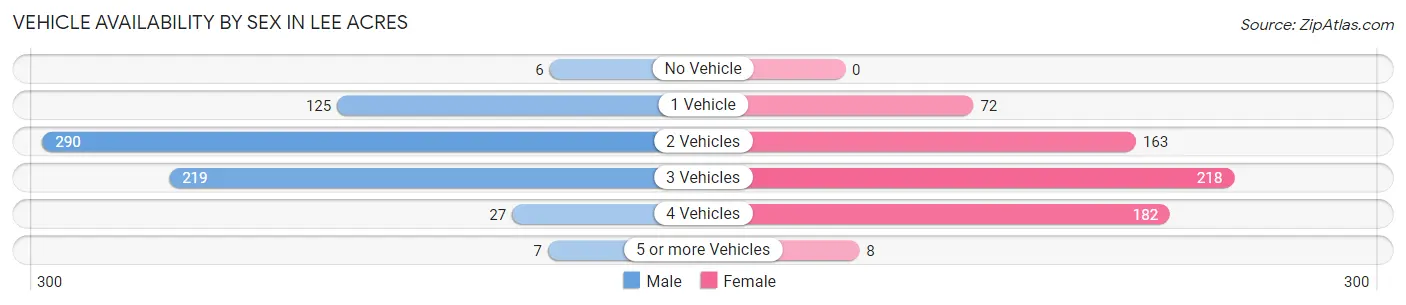
| Vehicles Available | Male | Female |
| No Vehicle | 6 (0.9%) | 0 (0.0%) |
| 1 Vehicle | 125 (18.5%) | 72 (11.2%) |
| 2 Vehicles | 290 (43.0%) | 163 (25.4%) |
| 3 Vehicles | 219 (32.5%) | 218 (33.9%) |
| 4 Vehicles | 27 (4.0%) | 182 (28.3%) |
| 5 or more Vehicles | 7 (1.0%) | 8 (1.2%) |
| Total | 674 (100.0%) | 643 (100.0%) |
Commute Time in Lee Acres
The most frequently occuring commute durations in Lee Acres are 20 to 24 minutes (425 commuters, 38.2%), 15 to 19 minutes (234 commuters, 21.0%), and 30 to 34 minutes (108 commuters, 9.7%).
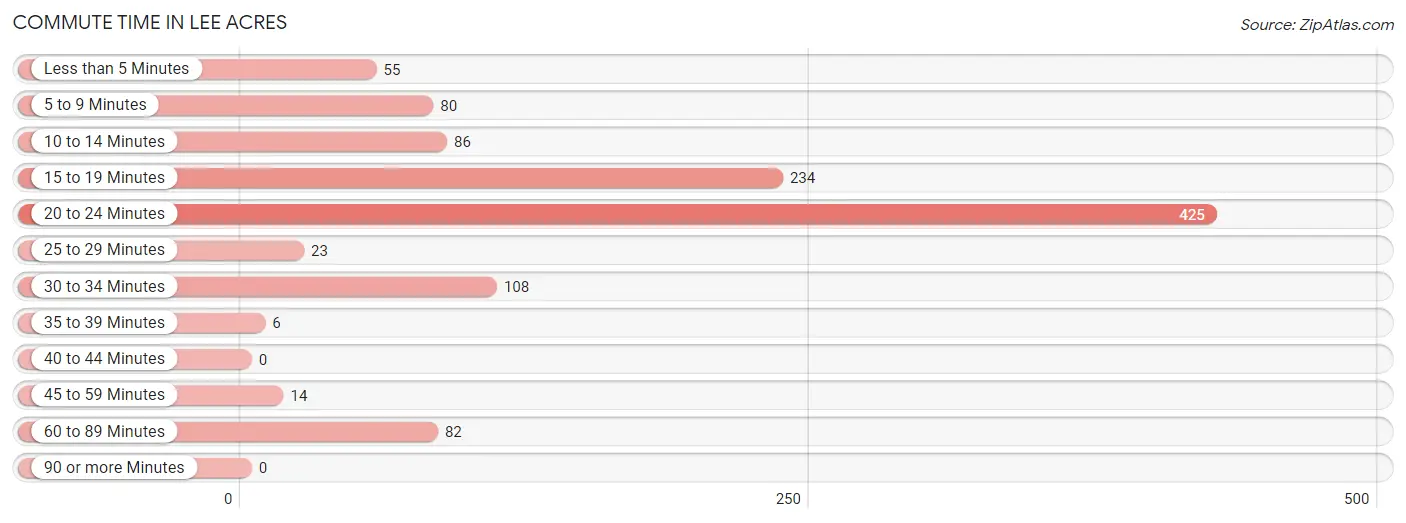
| Commute Time | # Commuters | % Commuters |
| Less than 5 Minutes | 55 | 4.9% |
| 5 to 9 Minutes | 80 | 7.2% |
| 10 to 14 Minutes | 86 | 7.7% |
| 15 to 19 Minutes | 234 | 21.0% |
| 20 to 24 Minutes | 425 | 38.2% |
| 25 to 29 Minutes | 23 | 2.1% |
| 30 to 34 Minutes | 108 | 9.7% |
| 35 to 39 Minutes | 6 | 0.5% |
| 40 to 44 Minutes | 0 | 0.0% |
| 45 to 59 Minutes | 14 | 1.3% |
| 60 to 89 Minutes | 82 | 7.4% |
| 90 or more Minutes | 0 | 0.0% |
Commute Time by Sex in Lee Acres
The most common commute times in Lee Acres are 20 to 24 minutes (185 commuters, 35.0%) for males and 20 to 24 minutes (240 commuters, 41.0%) for females.
| Commute Time | Male | Female |
| Less than 5 Minutes | 49 (9.3%) | 6 (1.0%) |
| 5 to 9 Minutes | 52 (9.9%) | 28 (4.8%) |
| 10 to 14 Minutes | 26 (4.9%) | 60 (10.3%) |
| 15 to 19 Minutes | 150 (28.4%) | 84 (14.4%) |
| 20 to 24 Minutes | 185 (35.0%) | 240 (41.0%) |
| 25 to 29 Minutes | 19 (3.6%) | 4 (0.7%) |
| 30 to 34 Minutes | 23 (4.4%) | 85 (14.5%) |
| 35 to 39 Minutes | 0 (0.0%) | 6 (1.0%) |
| 40 to 44 Minutes | 0 (0.0%) | 0 (0.0%) |
| 45 to 59 Minutes | 11 (2.1%) | 3 (0.5%) |
| 60 to 89 Minutes | 13 (2.5%) | 69 (11.8%) |
| 90 or more Minutes | 0 (0.0%) | 0 (0.0%) |
Time of Departure to Work by Sex in Lee Acres
The most frequent times of departure to work in Lee Acres are 12:00 PM to 3:59 PM (101, 19.1%) for males and 7:00 AM to 7:29 AM (185, 31.6%) for females.
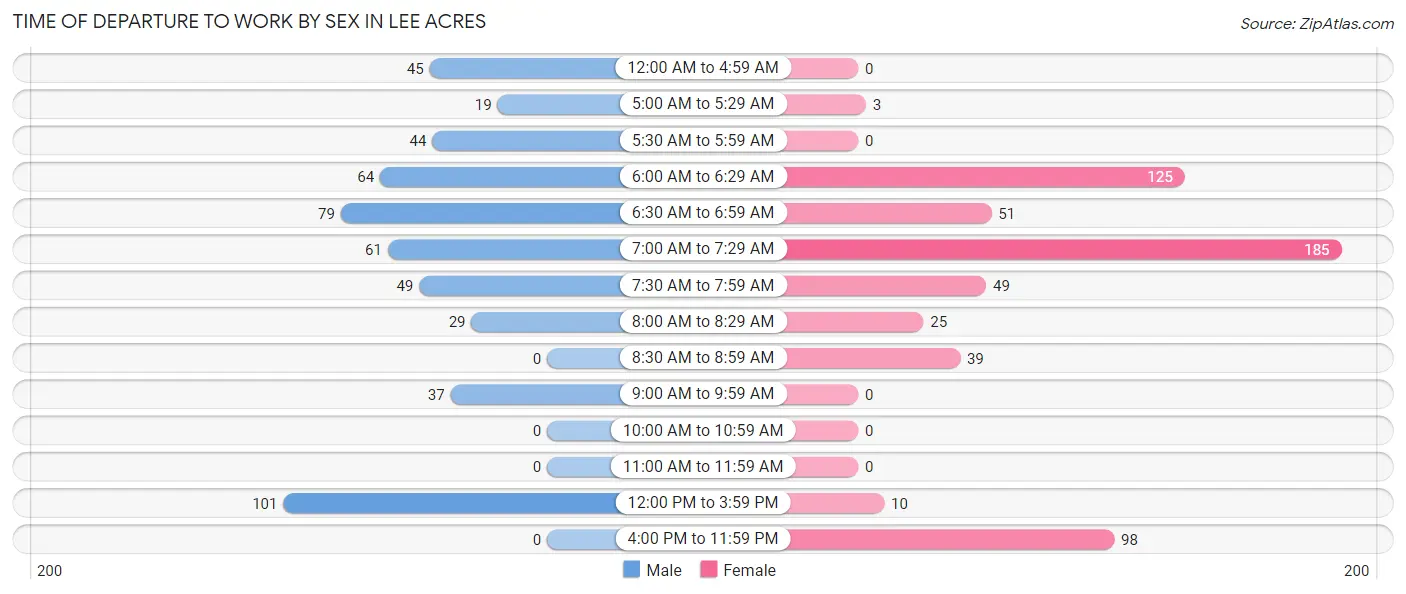
| Time of Departure | Male | Female |
| 12:00 AM to 4:59 AM | 45 (8.5%) | 0 (0.0%) |
| 5:00 AM to 5:29 AM | 19 (3.6%) | 3 (0.5%) |
| 5:30 AM to 5:59 AM | 44 (8.3%) | 0 (0.0%) |
| 6:00 AM to 6:29 AM | 64 (12.1%) | 125 (21.4%) |
| 6:30 AM to 6:59 AM | 79 (15.0%) | 51 (8.7%) |
| 7:00 AM to 7:29 AM | 61 (11.6%) | 185 (31.6%) |
| 7:30 AM to 7:59 AM | 49 (9.3%) | 49 (8.4%) |
| 8:00 AM to 8:29 AM | 29 (5.5%) | 25 (4.3%) |
| 8:30 AM to 8:59 AM | 0 (0.0%) | 39 (6.7%) |
| 9:00 AM to 9:59 AM | 37 (7.0%) | 0 (0.0%) |
| 10:00 AM to 10:59 AM | 0 (0.0%) | 0 (0.0%) |
| 11:00 AM to 11:59 AM | 0 (0.0%) | 0 (0.0%) |
| 12:00 PM to 3:59 PM | 101 (19.1%) | 10 (1.7%) |
| 4:00 PM to 11:59 PM | 0 (0.0%) | 98 (16.8%) |
| Total | 528 (100.0%) | 585 (100.0%) |
Housing Occupancy in Lee Acres
Occupancy by Ownership in Lee Acres
Of the total 1,745 dwellings in Lee Acres, owner-occupied units account for 1,289 (73.9%), while renter-occupied units make up 456 (26.1%).
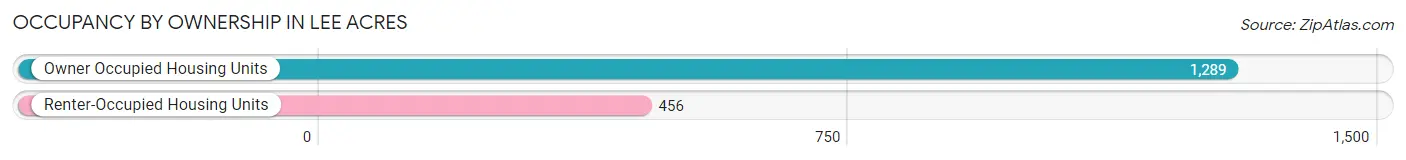
| Occupancy | # Housing Units | % Housing Units |
| Owner Occupied Housing Units | 1,289 | 73.9% |
| Renter-Occupied Housing Units | 456 | 26.1% |
| Total Occupied Housing Units | 1,745 | 100.0% |
Occupancy by Household Size in Lee Acres
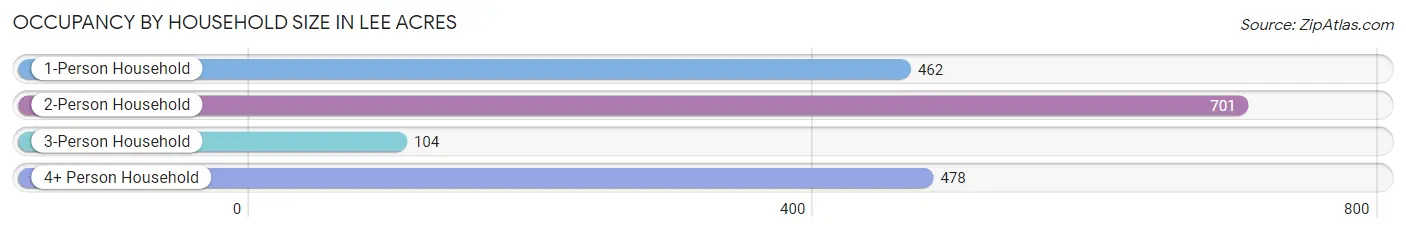
| Household Size | # Housing Units | % Housing Units |
| 1-Person Household | 462 | 26.5% |
| 2-Person Household | 701 | 40.2% |
| 3-Person Household | 104 | 6.0% |
| 4+ Person Household | 478 | 27.4% |
| Total Housing Units | 1,745 | 100.0% |
Occupancy by Ownership by Household Size in Lee Acres
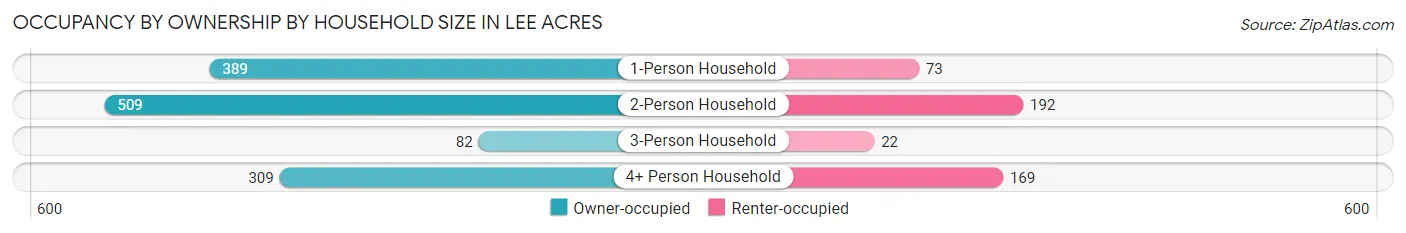
| Household Size | Owner-occupied | Renter-occupied |
| 1-Person Household | 389 (84.2%) | 73 (15.8%) |
| 2-Person Household | 509 (72.6%) | 192 (27.4%) |
| 3-Person Household | 82 (78.8%) | 22 (21.1%) |
| 4+ Person Household | 309 (64.6%) | 169 (35.4%) |
| Total Housing Units | 1,289 (73.9%) | 456 (26.1%) |
Occupancy by Educational Attainment in Lee Acres
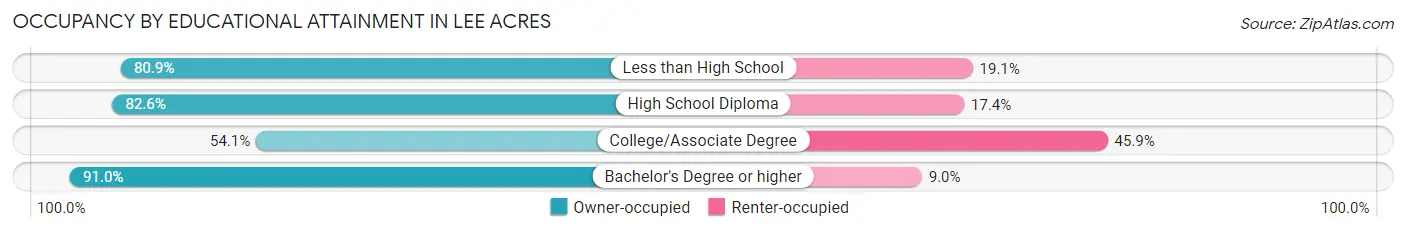
| Household Size | Owner-occupied | Renter-occupied |
| Less than High School | 203 (80.9%) | 48 (19.1%) |
| High School Diploma | 616 (82.6%) | 130 (17.4%) |
| College/Associate Degree | 309 (54.1%) | 262 (45.9%) |
| Bachelor's Degree or higher | 161 (91.0%) | 16 (9.0%) |
Occupancy by Age of Householder in Lee Acres
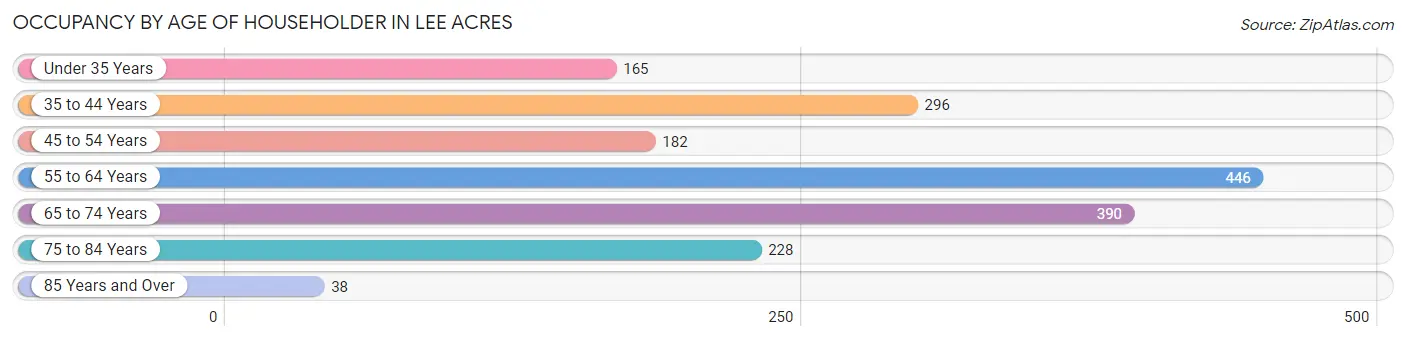
| Age Bracket | # Households | % Households |
| Under 35 Years | 165 | 9.5% |
| 35 to 44 Years | 296 | 17.0% |
| 45 to 54 Years | 182 | 10.4% |
| 55 to 64 Years | 446 | 25.6% |
| 65 to 74 Years | 390 | 22.4% |
| 75 to 84 Years | 228 | 13.1% |
| 85 Years and Over | 38 | 2.2% |
| Total | 1,745 | 100.0% |
Housing Finances in Lee Acres
Median Income by Occupancy in Lee Acres
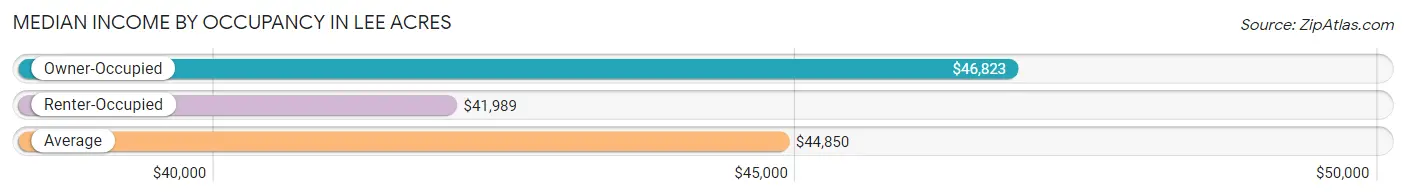
| Occupancy Type | # Households | Median Income |
| Owner-Occupied | 1,289 (73.9%) | $46,823 |
| Renter-Occupied | 456 (26.1%) | $41,989 |
| Average | 1,745 (100.0%) | $44,850 |
Occupancy by Householder Income Bracket in Lee Acres
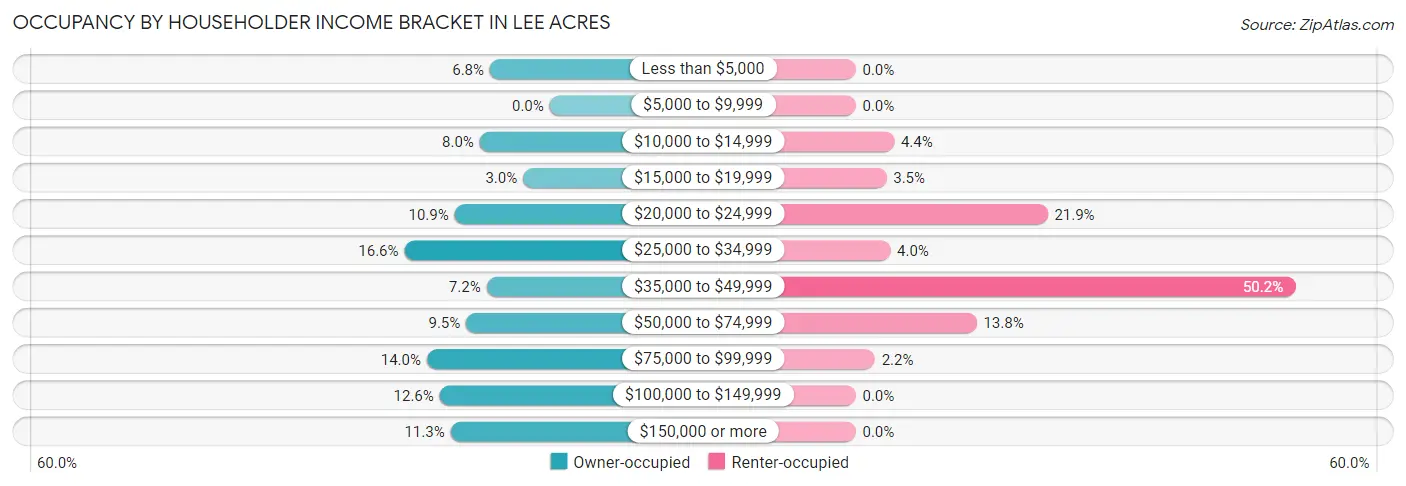
| Income Bracket | Owner-occupied | Renter-occupied |
| Less than $5,000 | 88 (6.8%) | 0 (0.0%) |
| $5,000 to $9,999 | 0 (0.0%) | 0 (0.0%) |
| $10,000 to $14,999 | 103 (8.0%) | 20 (4.4%) |
| $15,000 to $19,999 | 39 (3.0%) | 16 (3.5%) |
| $20,000 to $24,999 | 140 (10.9%) | 100 (21.9%) |
| $25,000 to $34,999 | 214 (16.6%) | 18 (4.0%) |
| $35,000 to $49,999 | 93 (7.2%) | 229 (50.2%) |
| $50,000 to $74,999 | 123 (9.5%) | 63 (13.8%) |
| $75,000 to $99,999 | 181 (14.0%) | 10 (2.2%) |
| $100,000 to $149,999 | 162 (12.6%) | 0 (0.0%) |
| $150,000 or more | 146 (11.3%) | 0 (0.0%) |
| Total | 1,289 (100.0%) | 456 (100.0%) |
Monthly Housing Cost Tiers in Lee Acres
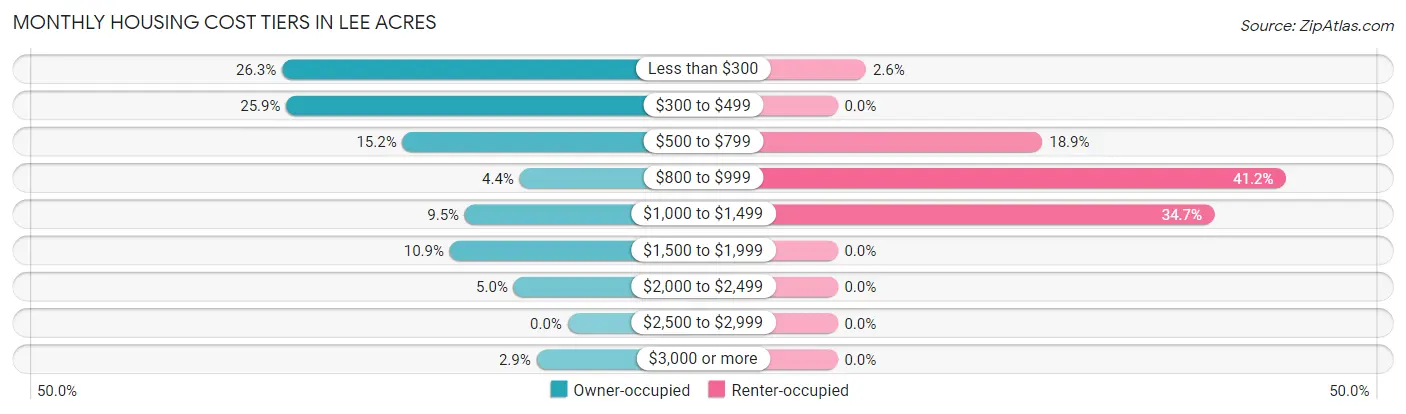
| Monthly Cost | Owner-occupied | Renter-occupied |
| Less than $300 | 339 (26.3%) | 12 (2.6%) |
| $300 to $499 | 334 (25.9%) | 0 (0.0%) |
| $500 to $799 | 196 (15.2%) | 86 (18.9%) |
| $800 to $999 | 57 (4.4%) | 188 (41.2%) |
| $1,000 to $1,499 | 122 (9.5%) | 158 (34.6%) |
| $1,500 to $1,999 | 140 (10.9%) | 0 (0.0%) |
| $2,000 to $2,499 | 64 (5.0%) | 0 (0.0%) |
| $2,500 to $2,999 | 0 (0.0%) | 0 (0.0%) |
| $3,000 or more | 37 (2.9%) | 0 (0.0%) |
| Total | 1,289 (100.0%) | 456 (100.0%) |
Physical Housing Characteristics in Lee Acres
Housing Structures in Lee Acres
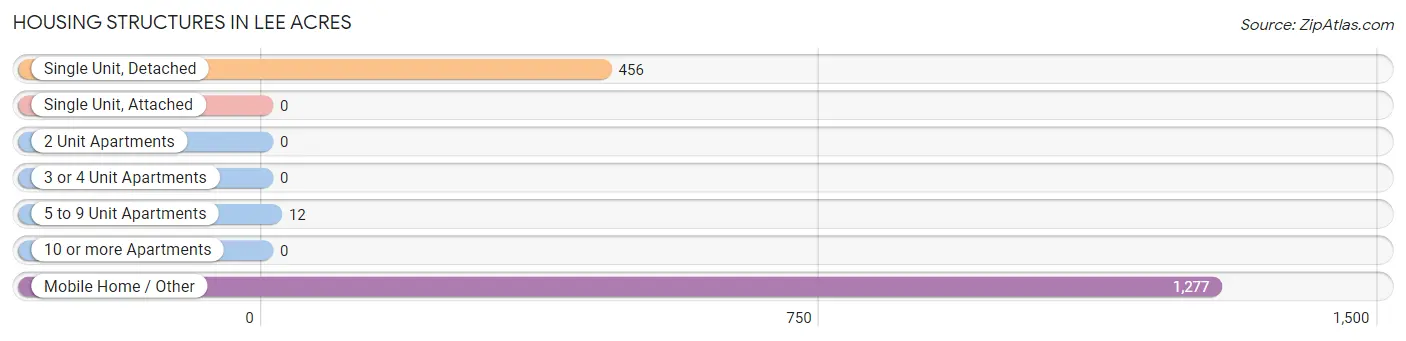
| Structure Type | # Housing Units | % Housing Units |
| Single Unit, Detached | 456 | 26.1% |
| Single Unit, Attached | 0 | 0.0% |
| 2 Unit Apartments | 0 | 0.0% |
| 3 or 4 Unit Apartments | 0 | 0.0% |
| 5 to 9 Unit Apartments | 12 | 0.7% |
| 10 or more Apartments | 0 | 0.0% |
| Mobile Home / Other | 1,277 | 73.2% |
| Total | 1,745 | 100.0% |
Housing Structures by Occupancy in Lee Acres
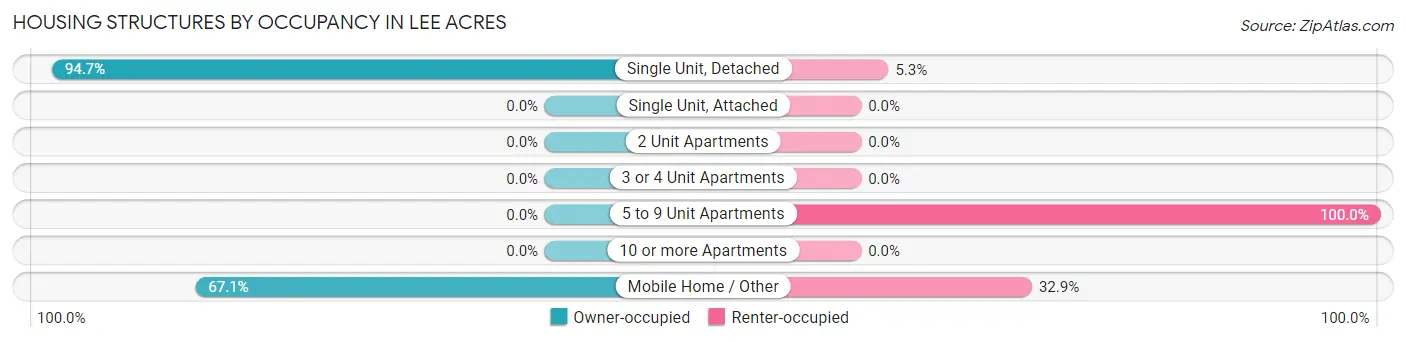
| Structure Type | Owner-occupied | Renter-occupied |
| Single Unit, Detached | 432 (94.7%) | 24 (5.3%) |
| Single Unit, Attached | 0 (0.0%) | 0 (0.0%) |
| 2 Unit Apartments | 0 (0.0%) | 0 (0.0%) |
| 3 or 4 Unit Apartments | 0 (0.0%) | 0 (0.0%) |
| 5 to 9 Unit Apartments | 0 (0.0%) | 12 (100.0%) |
| 10 or more Apartments | 0 (0.0%) | 0 (0.0%) |
| Mobile Home / Other | 857 (67.1%) | 420 (32.9%) |
| Total | 1,289 (73.9%) | 456 (26.1%) |
Housing Structures by Number of Rooms in Lee Acres
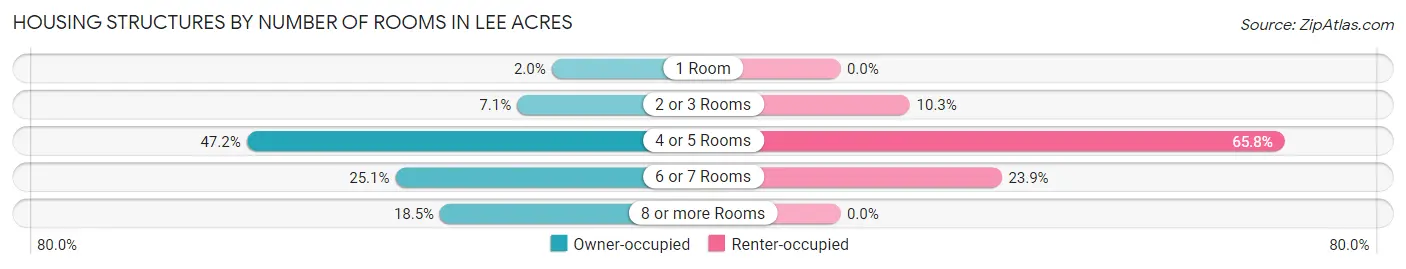
| Number of Rooms | Owner-occupied | Renter-occupied |
| 1 Room | 26 (2.0%) | 0 (0.0%) |
| 2 or 3 Rooms | 92 (7.1%) | 47 (10.3%) |
| 4 or 5 Rooms | 608 (47.2%) | 300 (65.8%) |
| 6 or 7 Rooms | 324 (25.1%) | 109 (23.9%) |
| 8 or more Rooms | 239 (18.5%) | 0 (0.0%) |
| Total | 1,289 (100.0%) | 456 (100.0%) |
Housing Structure by Heating Type in Lee Acres
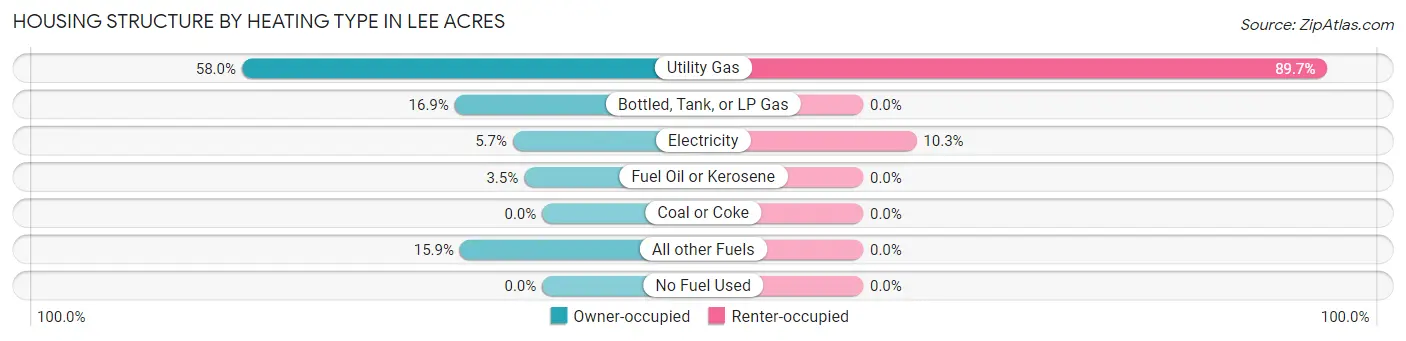
| Heating Type | Owner-occupied | Renter-occupied |
| Utility Gas | 748 (58.0%) | 409 (89.7%) |
| Bottled, Tank, or LP Gas | 218 (16.9%) | 0 (0.0%) |
| Electricity | 73 (5.7%) | 47 (10.3%) |
| Fuel Oil or Kerosene | 45 (3.5%) | 0 (0.0%) |
| Coal or Coke | 0 (0.0%) | 0 (0.0%) |
| All other Fuels | 205 (15.9%) | 0 (0.0%) |
| No Fuel Used | 0 (0.0%) | 0 (0.0%) |
| Total | 1,289 (100.0%) | 456 (100.0%) |
Household Vehicle Usage in Lee Acres
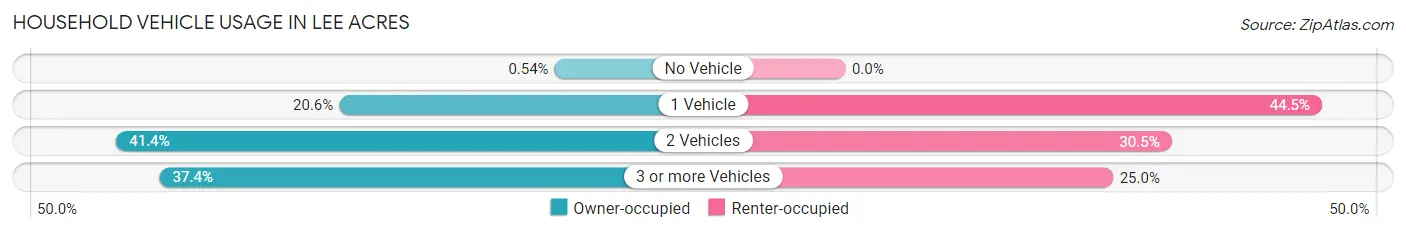
| Vehicles per Household | Owner-occupied | Renter-occupied |
| No Vehicle | 7 (0.5%) | 0 (0.0%) |
| 1 Vehicle | 266 (20.6%) | 203 (44.5%) |
| 2 Vehicles | 534 (41.4%) | 139 (30.5%) |
| 3 or more Vehicles | 482 (37.4%) | 114 (25.0%) |
| Total | 1,289 (100.0%) | 456 (100.0%) |
Real Estate & Mortgages in Lee Acres
Real Estate and Mortgage Overview in Lee Acres
| Characteristic | Without Mortgage | With Mortgage |
| Housing Units | 888 | 401 |
| Median Property Value | $111,000 | $207,700 |
| Median Household Income | $31,319 | $68 |
| Monthly Housing Costs | $418 | $37 |
| Real Estate Taxes | $589 | $9 |
Property Value by Mortgage Status in Lee Acres
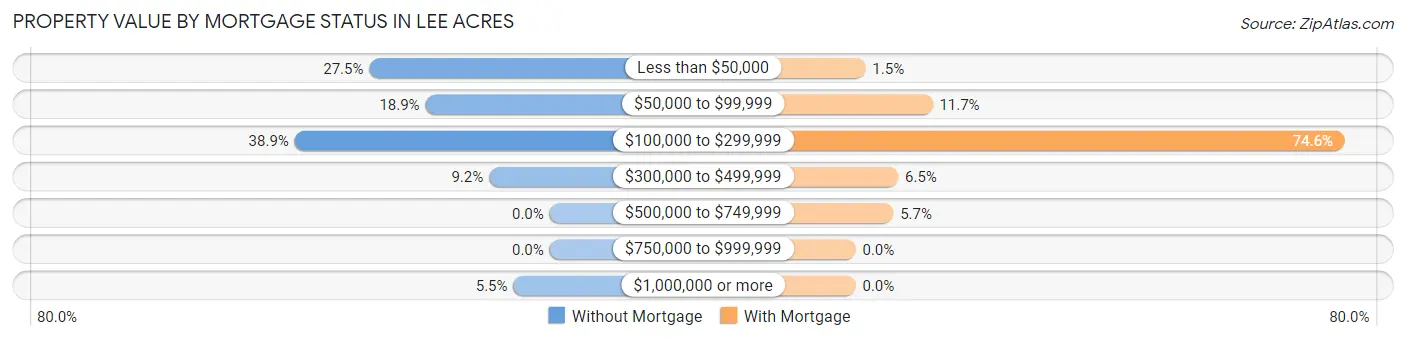
| Property Value | Without Mortgage | With Mortgage |
| Less than $50,000 | 244 (27.5%) | 6 (1.5%) |
| $50,000 to $99,999 | 168 (18.9%) | 47 (11.7%) |
| $100,000 to $299,999 | 345 (38.9%) | 299 (74.6%) |
| $300,000 to $499,999 | 82 (9.2%) | 26 (6.5%) |
| $500,000 to $749,999 | 0 (0.0%) | 23 (5.7%) |
| $750,000 to $999,999 | 0 (0.0%) | 0 (0.0%) |
| $1,000,000 or more | 49 (5.5%) | 0 (0.0%) |
| Total | 888 (100.0%) | 401 (100.0%) |
Household Income by Mortgage Status in Lee Acres
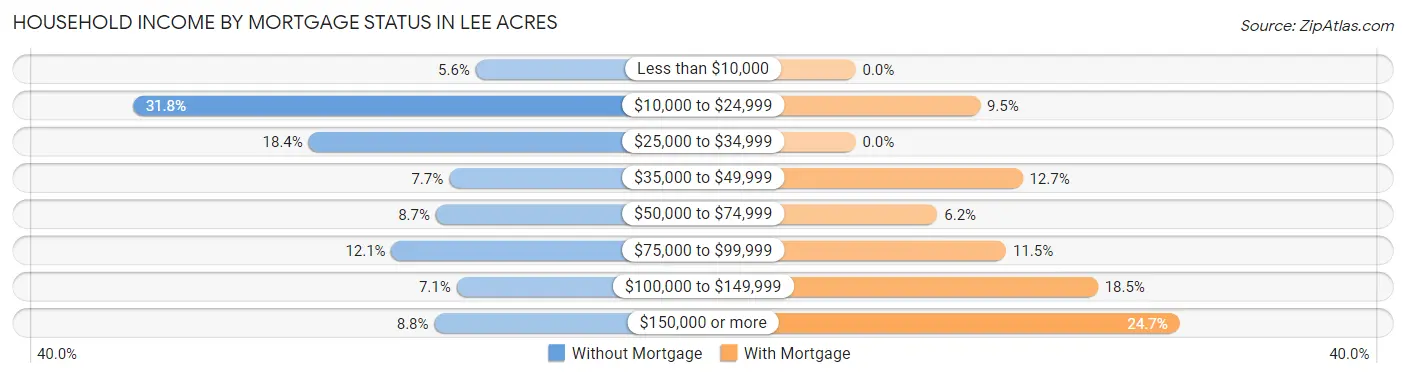
| Household Income | Without Mortgage | With Mortgage |
| Less than $10,000 | 50 (5.6%) | 0 (0.0%) |
| $10,000 to $24,999 | 282 (31.8%) | 38 (9.5%) |
| $25,000 to $34,999 | 163 (18.4%) | 0 (0.0%) |
| $35,000 to $49,999 | 68 (7.7%) | 51 (12.7%) |
| $50,000 to $74,999 | 77 (8.7%) | 25 (6.2%) |
| $75,000 to $99,999 | 107 (12.0%) | 46 (11.5%) |
| $100,000 to $149,999 | 63 (7.1%) | 74 (18.4%) |
| $150,000 or more | 78 (8.8%) | 99 (24.7%) |
| Total | 888 (100.0%) | 401 (100.0%) |
Property Value to Household Income Ratio in Lee Acres
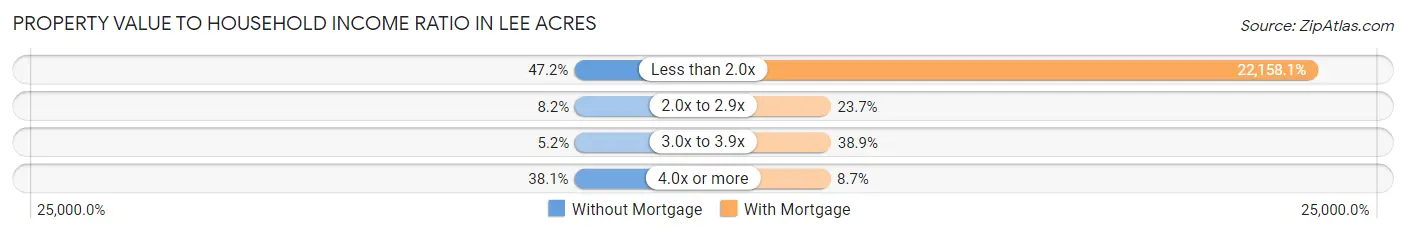
| Value-to-Income Ratio | Without Mortgage | With Mortgage |
| Less than 2.0x | 419 (47.2%) | 88,854 (22,158.1%) |
| 2.0x to 2.9x | 73 (8.2%) | 95 (23.7%) |
| 3.0x to 3.9x | 46 (5.2%) | 156 (38.9%) |
| 4.0x or more | 338 (38.1%) | 35 (8.7%) |
| Total | 888 (100.0%) | 401 (100.0%) |
Real Estate Taxes by Mortgage Status in Lee Acres
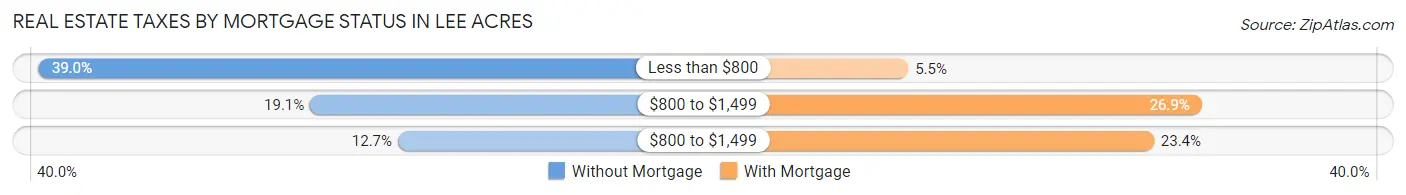
| Property Taxes | Without Mortgage | With Mortgage |
| Less than $800 | 346 (39.0%) | 22 (5.5%) |
| $800 to $1,499 | 170 (19.1%) | 108 (26.9%) |
| $800 to $1,499 | 113 (12.7%) | 94 (23.4%) |
| Total | 888 (100.0%) | 401 (100.0%) |
Health & Disability in Lee Acres
Health Insurance Coverage by Age in Lee Acres
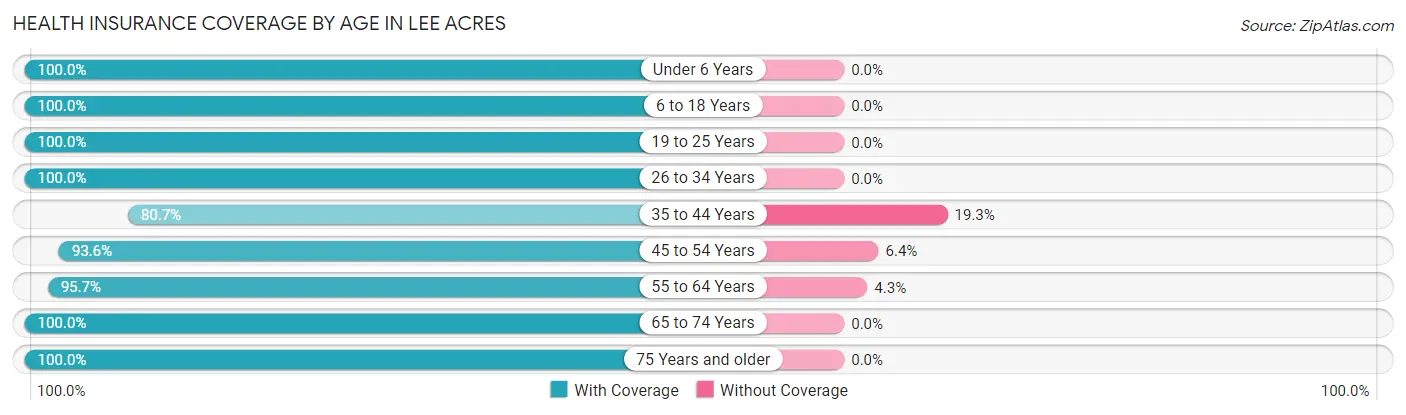
| Age Bracket | With Coverage | Without Coverage |
| Under 6 Years | 87 (100.0%) | 0 (0.0%) |
| 6 to 18 Years | 1,131 (100.0%) | 0 (0.0%) |
| 19 to 25 Years | 426 (100.0%) | 0 (0.0%) |
| 26 to 34 Years | 522 (100.0%) | 0 (0.0%) |
| 35 to 44 Years | 465 (80.7%) | 111 (19.3%) |
| 45 to 54 Years | 366 (93.6%) | 25 (6.4%) |
| 55 to 64 Years | 689 (95.7%) | 31 (4.3%) |
| 65 to 74 Years | 521 (100.0%) | 0 (0.0%) |
| 75 Years and older | 484 (100.0%) | 0 (0.0%) |
| Total | 4,691 (96.6%) | 167 (3.4%) |
Health Insurance Coverage by Citizenship Status in Lee Acres
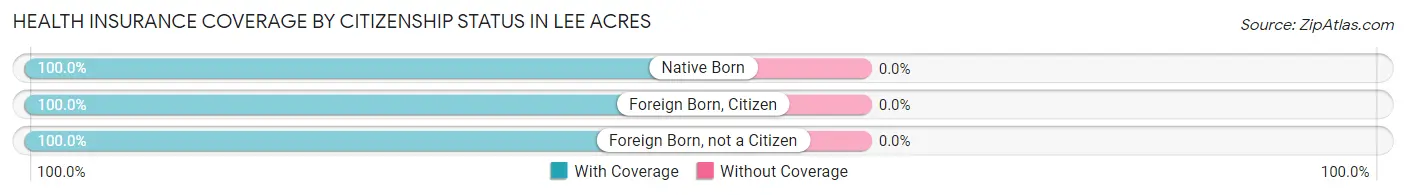
| Citizenship Status | With Coverage | Without Coverage |
| Native Born | 87 (100.0%) | 0 (0.0%) |
| Foreign Born, Citizen | 1,131 (100.0%) | 0 (0.0%) |
| Foreign Born, not a Citizen | 426 (100.0%) | 0 (0.0%) |
Health Insurance Coverage by Household Income in Lee Acres
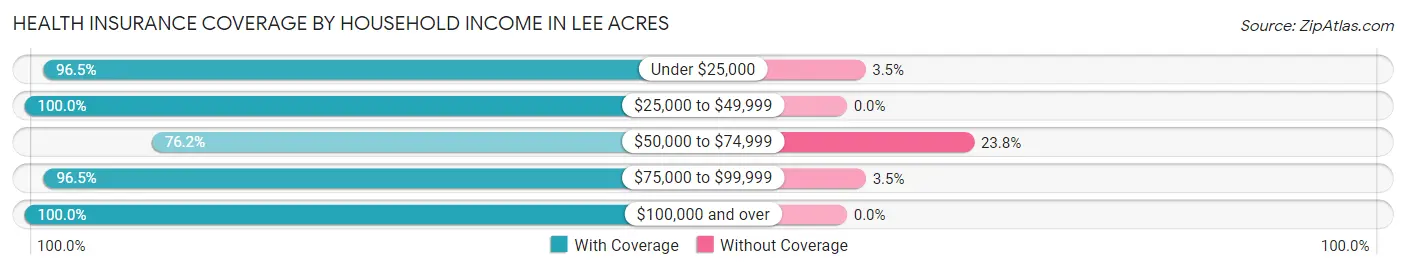
| Household Income | With Coverage | Without Coverage |
| Under $25,000 | 1,227 (96.5%) | 44 (3.5%) |
| $25,000 to $49,999 | 1,484 (100.0%) | 0 (0.0%) |
| $50,000 to $74,999 | 326 (76.2%) | 102 (23.8%) |
| $75,000 to $99,999 | 573 (96.5%) | 21 (3.5%) |
| $100,000 and over | 1,081 (100.0%) | 0 (0.0%) |
Public vs Private Health Insurance Coverage by Age in Lee Acres
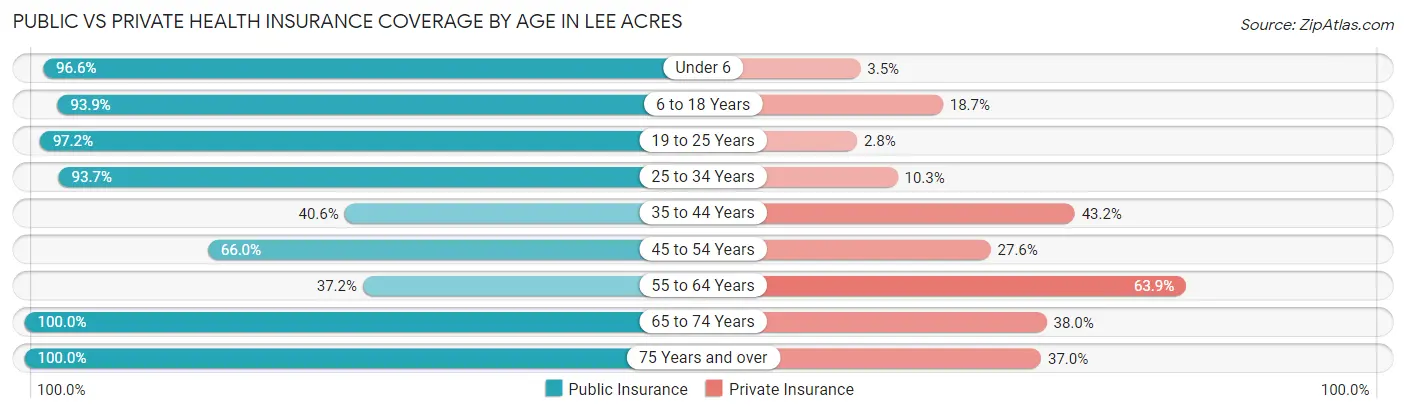
| Age Bracket | Public Insurance | Private Insurance |
| Under 6 | 84 (96.6%) | 3 (3.5%) |
| 6 to 18 Years | 1,062 (93.9%) | 212 (18.7%) |
| 19 to 25 Years | 414 (97.2%) | 12 (2.8%) |
| 25 to 34 Years | 489 (93.7%) | 54 (10.3%) |
| 35 to 44 Years | 234 (40.6%) | 249 (43.2%) |
| 45 to 54 Years | 258 (66.0%) | 108 (27.6%) |
| 55 to 64 Years | 268 (37.2%) | 460 (63.9%) |
| 65 to 74 Years | 521 (100.0%) | 198 (38.0%) |
| 75 Years and over | 484 (100.0%) | 179 (37.0%) |
| Total | 3,814 (78.5%) | 1,475 (30.4%) |
Disability Status by Sex by Age in Lee Acres
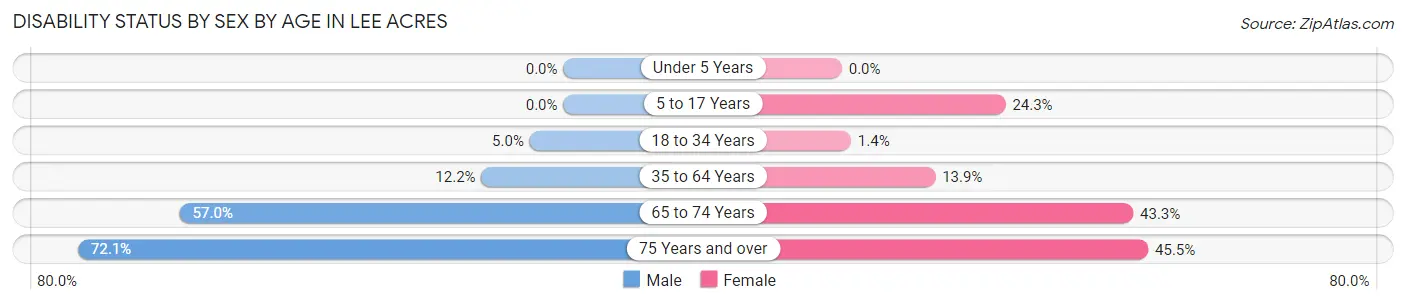
| Age Bracket | Male | Female |
| Under 5 Years | 0 (0.0%) | 0 (0.0%) |
| 5 to 17 Years | 0 (0.0%) | 131 (24.3%) |
| 18 to 34 Years | 29 (5.0%) | 5 (1.3%) |
| 35 to 64 Years | 93 (12.2%) | 128 (13.9%) |
| 65 to 74 Years | 94 (57.0%) | 154 (43.3%) |
| 75 Years and over | 173 (72.1%) | 111 (45.5%) |
Disability Class by Sex by Age in Lee Acres
Disability Class: Hearing Difficulty
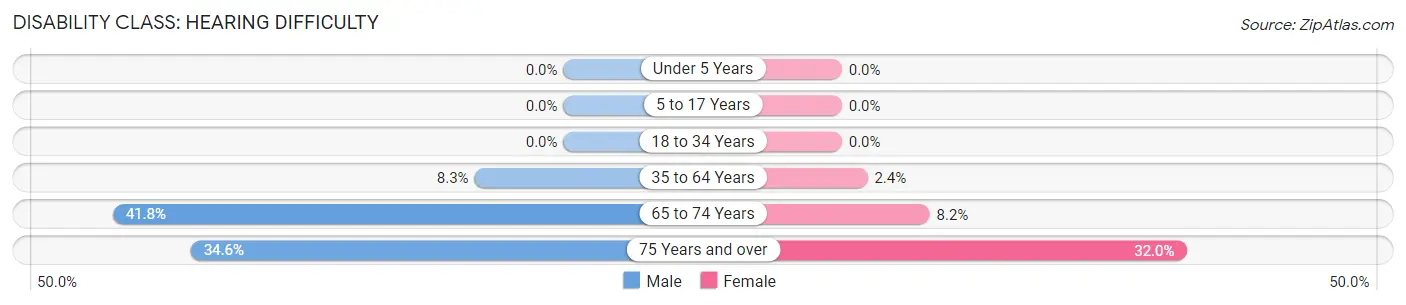
| Age Bracket | Male | Female |
| Under 5 Years | 0 (0.0%) | 0 (0.0%) |
| 5 to 17 Years | 0 (0.0%) | 0 (0.0%) |
| 18 to 34 Years | 0 (0.0%) | 0 (0.0%) |
| 35 to 64 Years | 63 (8.3%) | 22 (2.4%) |
| 65 to 74 Years | 69 (41.8%) | 29 (8.2%) |
| 75 Years and over | 83 (34.6%) | 78 (32.0%) |
Disability Class: Vision Difficulty
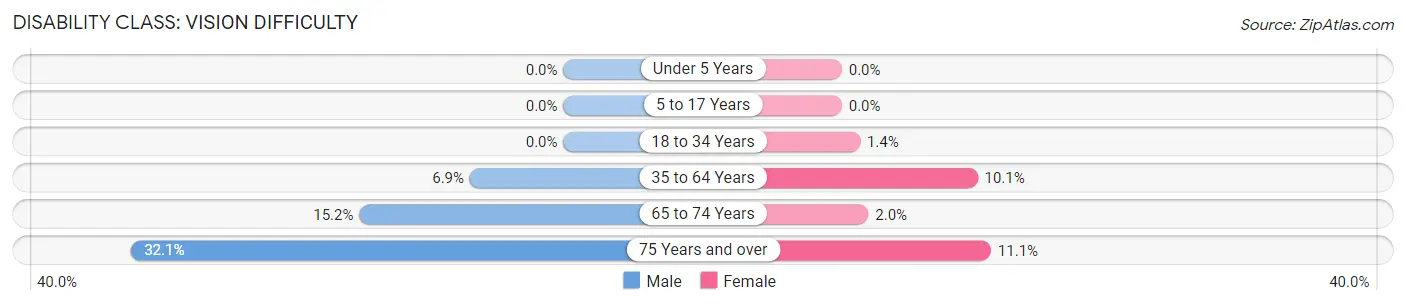
| Age Bracket | Male | Female |
| Under 5 Years | 0 (0.0%) | 0 (0.0%) |
| 5 to 17 Years | 0 (0.0%) | 0 (0.0%) |
| 18 to 34 Years | 0 (0.0%) | 5 (1.3%) |
| 35 to 64 Years | 53 (6.9%) | 93 (10.1%) |
| 65 to 74 Years | 25 (15.1%) | 7 (2.0%) |
| 75 Years and over | 77 (32.1%) | 27 (11.1%) |
Disability Class: Cognitive Difficulty
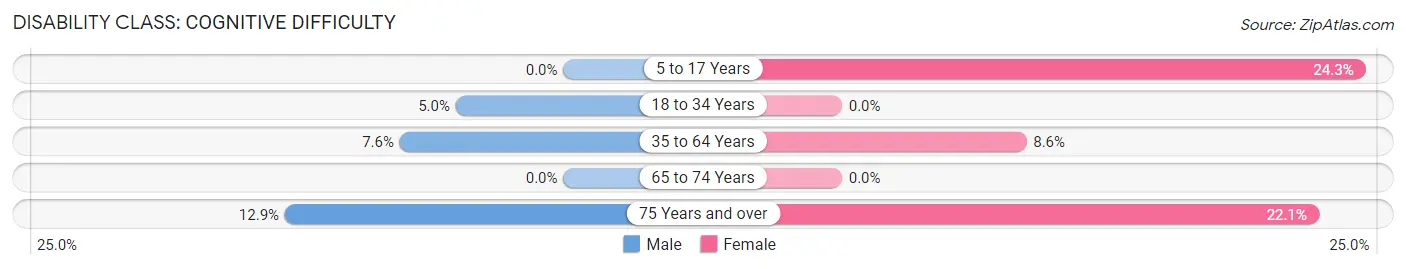
| Age Bracket | Male | Female |
| 5 to 17 Years | 0 (0.0%) | 131 (24.3%) |
| 18 to 34 Years | 29 (5.0%) | 0 (0.0%) |
| 35 to 64 Years | 58 (7.6%) | 79 (8.6%) |
| 65 to 74 Years | 0 (0.0%) | 0 (0.0%) |
| 75 Years and over | 31 (12.9%) | 54 (22.1%) |
Disability Class: Ambulatory Difficulty
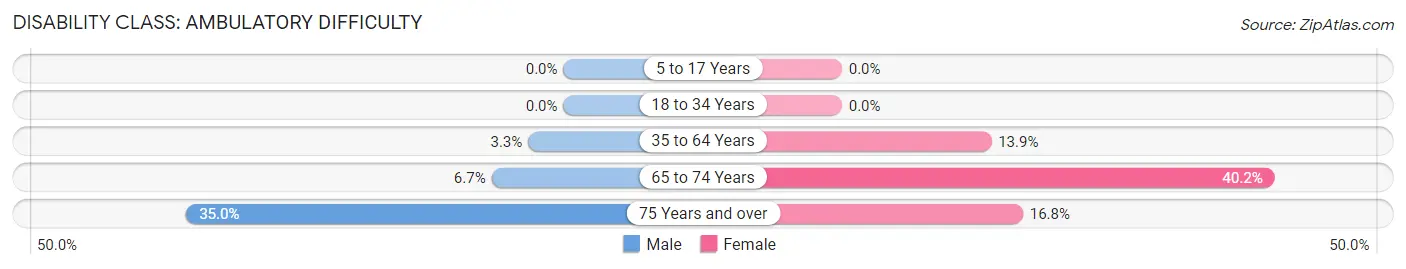
| Age Bracket | Male | Female |
| 5 to 17 Years | 0 (0.0%) | 0 (0.0%) |
| 18 to 34 Years | 0 (0.0%) | 0 (0.0%) |
| 35 to 64 Years | 25 (3.3%) | 128 (13.9%) |
| 65 to 74 Years | 11 (6.7%) | 143 (40.2%) |
| 75 Years and over | 84 (35.0%) | 41 (16.8%) |
Disability Class: Self-Care Difficulty
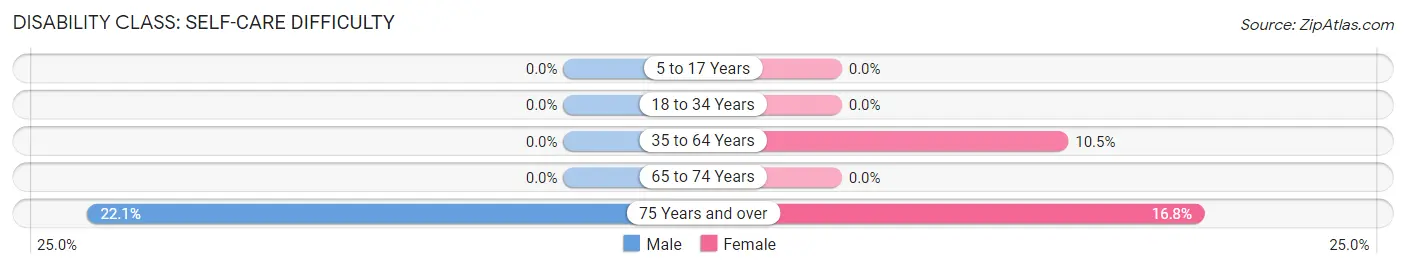
| Age Bracket | Male | Female |
| 5 to 17 Years | 0 (0.0%) | 0 (0.0%) |
| 18 to 34 Years | 0 (0.0%) | 0 (0.0%) |
| 35 to 64 Years | 0 (0.0%) | 97 (10.5%) |
| 65 to 74 Years | 0 (0.0%) | 0 (0.0%) |
| 75 Years and over | 53 (22.1%) | 41 (16.8%) |
Technology Access in Lee Acres
Computing Device Access in Lee Acres
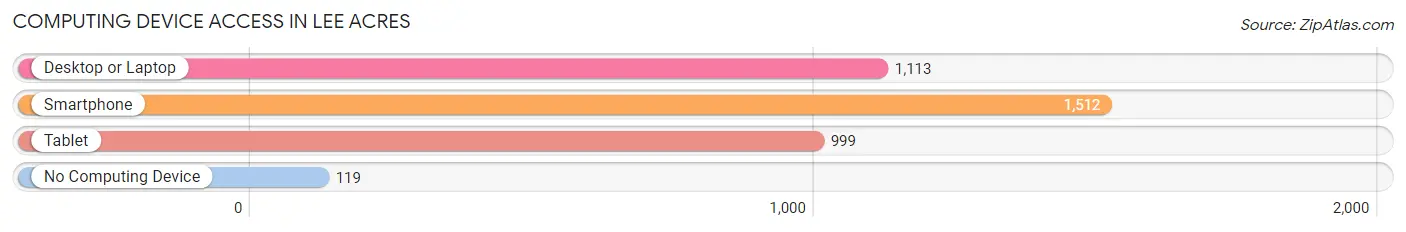
| Device Type | # Households | % Households |
| Desktop or Laptop | 1,113 | 63.8% |
| Smartphone | 1,512 | 86.7% |
| Tablet | 999 | 57.3% |
| No Computing Device | 119 | 6.8% |
| Total | 1,745 | 100.0% |
Internet Access in Lee Acres
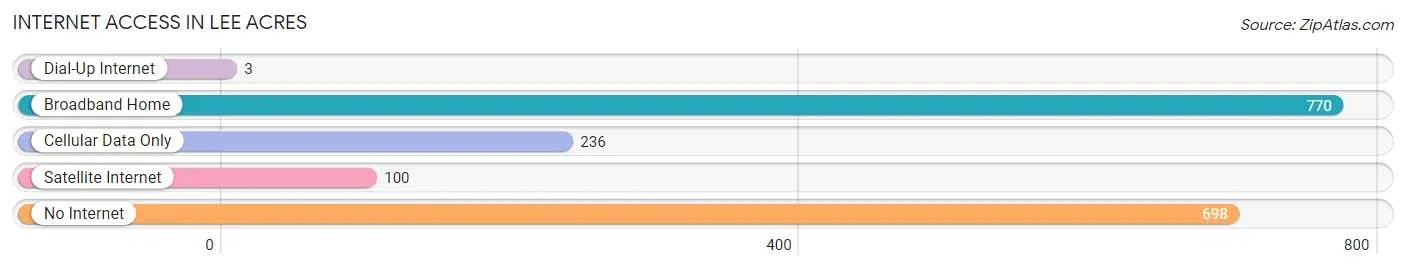
| Internet Type | # Households | % Households |
| Dial-Up Internet | 3 | 0.2% |
| Broadband Home | 770 | 44.1% |
| Cellular Data Only | 236 | 13.5% |
| Satellite Internet | 100 | 5.7% |
| No Internet | 698 | 40.0% |
| Total | 1,745 | 100.0% |
Lee Acres Summary
Lee Acres is a small unincorporated community located in the northwest corner of New Mexico, in San Juan County. It is situated on the Navajo Nation Reservation, and is home to a population of approximately 1,000 people.
History
Lee Acres was founded in the late 1800s by a group of Navajo families who were looking for a place to settle and raise their families. The area was originally known as “Lee’s Acres”, named after the first settler, Lee Yazzie. The community was officially established in the early 1900s, and the name was changed to “Lee Acres”.
The community was originally a farming and ranching community, and the residents relied heavily on the land for their livelihood. In the 1950s, the Navajo Nation began to develop the area, and the community began to grow. The Navajo Nation built a school, a clinic, and a post office in the area, and the population began to increase.
Geography
Lee Acres is located in the northwest corner of New Mexico, in San Juan County. It is situated on the Navajo Nation Reservation, and is bordered by the towns of Shiprock, Farmington, and Kirtland. The area is mostly flat, with some rolling hills and mesas. The climate is semi-arid, with hot summers and cold winters.
Economy
The economy of Lee Acres is largely based on agriculture and ranching. The area is home to a number of farms and ranches, and the residents rely heavily on the land for their livelihood. The Navajo Nation also provides employment opportunities in the area, and there are a number of businesses located in the community.
Demographics
As of the 2010 census, the population of Lee Acres was 1,000. The population is mostly Native American, with a small percentage of Hispanic and White residents. The median household income is $25,000, and the median age is 33. The majority of the population is employed in agriculture and ranching, and the unemployment rate is 8.5%.
Lee Acres is a small, rural community with a rich history and culture. The area is home to a diverse population, and the residents rely heavily on the land for their livelihood. The economy is largely based on agriculture and ranching, and the Navajo Nation provides employment opportunities in the area. The community is a great place to live and work, and is a great example of the beauty and culture of the Navajo Nation.
Common Questions
What is the Total Population of Lee Acres?
Total Population of Lee Acres is 4,858.
What is the Total Male Population of Lee Acres?
Total Male Population of Lee Acres is 2,417.
What is the Total Female Population of Lee Acres?
Total Female Population of Lee Acres is 2,441.
What is the Ratio of Males per 100 Females in Lee Acres?
There are 99.02 Males per 100 Females in Lee Acres.
What is the Ratio of Females per 100 Males in Lee Acres?
There are 100.99 Females per 100 Males in Lee Acres.
What is the Median Population Age in Lee Acres?
Median Population Age in Lee Acres is 41.6 Years.
What is the Average Family Size in Lee Acres
Average Family Size in Lee Acres is 3.5 People.
What is the Average Household Size in Lee Acres
Average Household Size in Lee Acres is 2.8 People.
What is Per Capita Income in Lee Acres?
Per Capita income in Lee Acres is $23,283.
What is the Median Family Income in Lee Acres?
Median Family Income in Lee Acres is $52,847.
What is the Median Household income in Lee Acres?
Median Household Income in Lee Acres is $44,850.
What is Income or Wage Gap in Lee Acres?
Income or Wage Gap in Lee Acres is 22.8%.
Women in Lee Acres earn 77.2 cents for every dollar earned by a man.
What is Inequality or Gini Index in Lee Acres?
Inequality or Gini Index in Lee Acres is 0.47.
How Large is the Labor Force in Lee Acres?
There are 1,737 People in the Labor Forcein in Lee Acres.
What is the Percentage of People in the Labor Force in Lee Acres?
44.8% of People are in the Labor Force in Lee Acres.
What is the Unemployment Rate in Lee Acres?
Unemployment Rate in Lee Acres is 22.3%.