Cities with the Highest Percentage of Population with a Degree in Education in Montana
RELATED REPORTS & OPTIONS
Education
Montana
Compare Cities
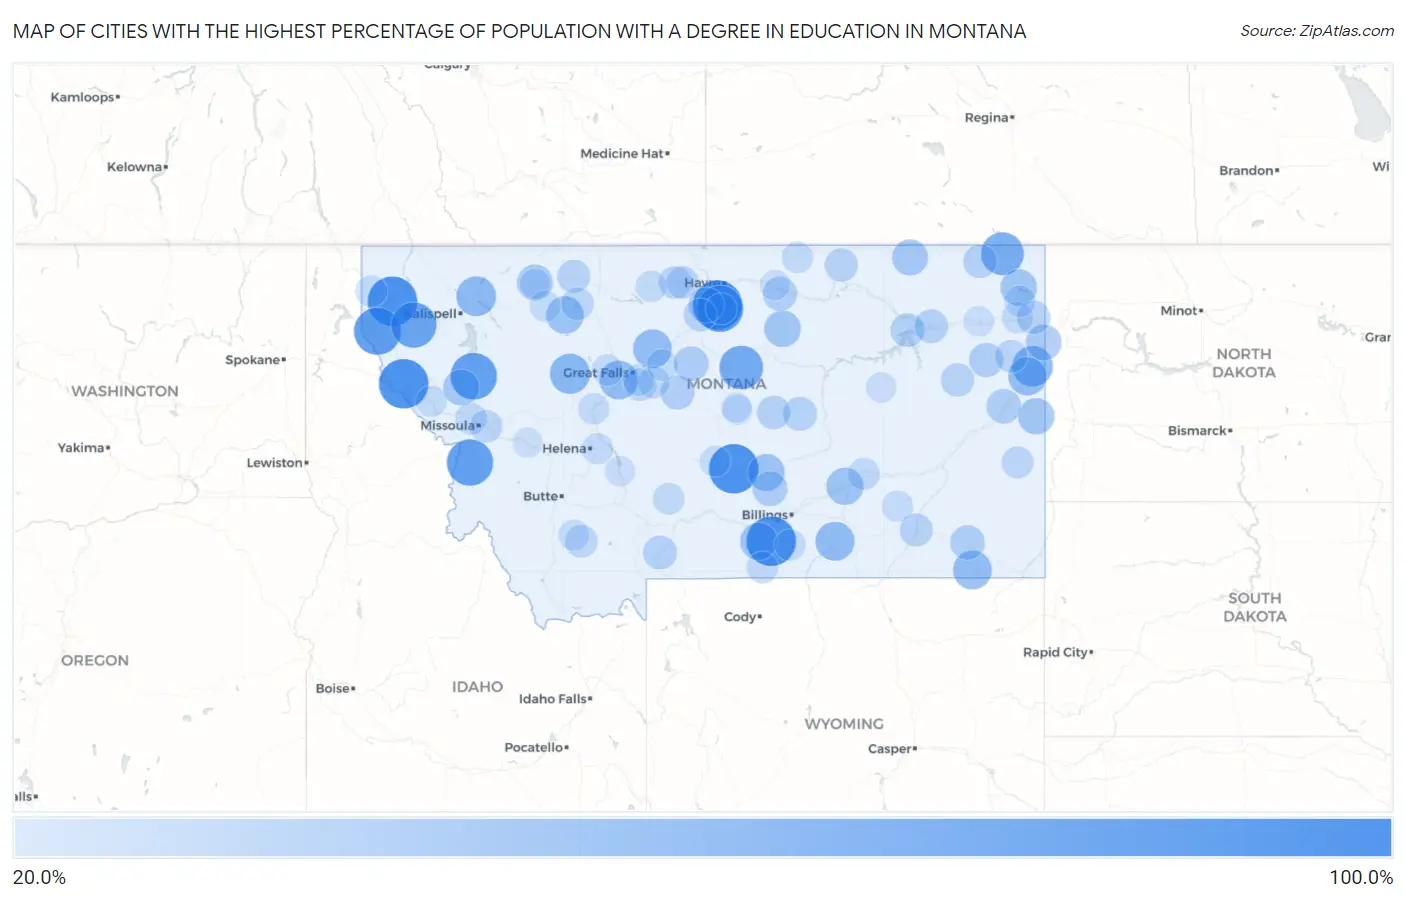
Map of Cities with the Highest Percentage of Population with a Degree in Education in Montana
0.0%
100.0%
Cities with the Highest Percentage of Population with a Degree in Education in Montana
| City | % Graduates | vs State | vs National | |
| 1. | White Haven | 100.0% | 15.2%(+84.8)#1 | 11.1%(+88.9)#25 |
| 2. | Azure | 100.0% | 15.2%(+84.8)#2 | 11.1%(+88.9)#74 |
| 3. | Edgar | 100.0% | 15.2%(+84.8)#3 | 11.1%(+88.9)#255 |
| 4. | De Borgia | 100.0% | 15.2%(+84.8)#4 | 11.1%(+88.9)#321 |
| 5. | Jeffers | 100.0% | 15.2%(+84.8)#5 | 11.1%(+88.9)#363 |
| 6. | Shawmut | 100.0% | 15.2%(+84.8)#6 | 11.1%(+88.9)#379 |
| 7. | Utica | 100.0% | 15.2%(+84.8)#7 | 11.1%(+88.9)#407 |
| 8. | Homestead | 100.0% | 15.2%(+84.8)#8 | 11.1%(+88.9)#417 |
| 9. | Noxon | 90.9% | 15.2%(+75.7)#9 | 11.1%(+79.9)#463 |
| 10. | Kicking Horse | 88.6% | 15.2%(+73.4)#10 | 11.1%(+77.5)#471 |
| 11. | Rocky Boy S Agency | 88.2% | 15.2%(+73.1)#11 | 11.1%(+77.2)#474 |
| 12. | Victor | 88.1% | 15.2%(+72.9)#12 | 11.1%(+77.0)#476 |
| 13. | Happys Inn | 84.3% | 15.2%(+69.2)#13 | 11.1%(+73.3)#500 |
| 14. | Winifred | 78.1% | 15.2%(+63.0)#14 | 11.1%(+67.1)#573 |
| 15. | Outlook | 75.0% | 15.2%(+59.8)#15 | 11.1%(+63.9)#641 |
| 16. | Crane | 66.7% | 15.2%(+51.5)#16 | 11.1%(+55.6)#831 |
| 17. | Glen | 66.7% | 15.2%(+51.5)#17 | 11.1%(+55.6)#858 |
| 18. | Grant | 66.7% | 15.2%(+51.5)#18 | 11.1%(+55.6)#865 |
| 19. | Augusta | 65.2% | 15.2%(+50.1)#19 | 11.1%(+54.2)#891 |
| 20. | Martin City | 63.3% | 15.2%(+48.2)#20 | 11.1%(+52.3)#946 |
| 21. | St Xavier | 61.1% | 15.2%(+45.9)#21 | 11.1%(+50.1)#1,022 |
| 22. | Carter | 60.0% | 15.2%(+44.8)#22 | 11.1%(+48.9)#1,099 |
| 23. | Biddle | 60.0% | 15.2%(+44.8)#23 | 11.1%(+48.9)#1,109 |
| 24. | Ulm | 59.8% | 15.2%(+44.6)#24 | 11.1%(+48.7)#1,111 |
| 25. | Savage | 58.5% | 15.2%(+43.3)#25 | 11.1%(+47.4)#1,160 |
| 26. | Dupuyer | 55.6% | 15.2%(+40.4)#26 | 11.1%(+44.5)#1,304 |
| 27. | Boyd | 54.5% | 15.2%(+39.4)#27 | 11.1%(+43.5)#1,353 |
| 28. | Custer | 53.8% | 15.2%(+38.7)#28 | 11.1%(+42.8)#1,393 |
| 29. | New Rockport Colony | 53.8% | 15.2%(+38.7)#29 | 11.1%(+42.8)#1,397 |
| 30. | Lavina | 53.3% | 15.2%(+38.2)#30 | 11.1%(+42.3)#1,438 |
| 31. | Hays | 52.1% | 15.2%(+36.9)#31 | 11.1%(+41.0)#1,495 |
| 32. | Medicine Lake | 51.1% | 15.2%(+35.9)#32 | 11.1%(+40.1)#1,556 |
| 33. | Wibaux | 51.1% | 15.2%(+35.9)#33 | 11.1%(+40.0)#1,559 |
| 34. | Opheim | 50.0% | 15.2%(+34.8)#34 | 11.1%(+38.9)#1,736 |
| 35. | Montaqua | 50.0% | 15.2%(+34.8)#35 | 11.1%(+38.9)#1,738 |
| 36. | Old Agency | 50.0% | 15.2%(+34.8)#36 | 11.1%(+38.9)#1,745 |
| 37. | Helmville | 50.0% | 15.2%(+34.8)#37 | 11.1%(+38.9)#1,755 |
| 38. | Browning | 49.4% | 15.2%(+34.2)#38 | 11.1%(+38.3)#1,813 |
| 39. | Fairview | 48.6% | 15.2%(+33.4)#39 | 11.1%(+37.5)#1,853 |
| 40. | Rocky Boy West | 47.4% | 15.2%(+32.2)#40 | 11.1%(+36.3)#1,946 |
| 41. | Broadview | 45.9% | 15.2%(+30.8)#41 | 11.1%(+34.9)#2,098 |
| 42. | Geraldine | 45.7% | 15.2%(+30.6)#42 | 11.1%(+34.7)#2,130 |
| 43. | Broadus | 44.8% | 15.2%(+29.7)#43 | 11.1%(+33.8)#2,232 |
| 44. | West Glendive | 44.7% | 15.2%(+29.5)#44 | 11.1%(+33.6)#2,247 |
| 45. | Richey | 44.1% | 15.2%(+29.0)#45 | 11.1%(+33.1)#2,325 |
| 46. | Fort Belknap Agency | 43.8% | 15.2%(+28.6)#46 | 11.1%(+32.7)#2,351 |
| 47. | Geyser | 42.9% | 15.2%(+27.7)#47 | 11.1%(+31.8)#2,519 |
| 48. | Floweree | 42.9% | 15.2%(+27.7)#48 | 11.1%(+31.8)#2,525 |
| 49. | Fort Peck | 42.6% | 15.2%(+27.5)#49 | 11.1%(+31.6)#2,543 |
| 50. | South Glastonbury | 42.4% | 15.2%(+27.2)#50 | 11.1%(+31.3)#2,571 |
| 51. | Winnett | 42.1% | 15.2%(+26.9)#51 | 11.1%(+31.0)#2,609 |
| 52. | Frazer | 41.7% | 15.2%(+26.5)#52 | 11.1%(+30.6)#2,662 |
| 53. | Grass Range | 41.2% | 15.2%(+26.0)#53 | 11.1%(+30.1)#2,736 |
| 54. | Flaxville | 41.2% | 15.2%(+26.0)#54 | 11.1%(+30.1)#2,739 |
| 55. | Circle | 40.1% | 15.2%(+25.0)#55 | 11.1%(+29.1)#2,872 |
| 56. | Bainville | 40.0% | 15.2%(+24.8)#56 | 11.1%(+28.9)#2,935 |
| 57. | Whitewater | 40.0% | 15.2%(+24.8)#57 | 11.1%(+28.9)#2,953 |
| 58. | Tracy | 40.0% | 15.2%(+24.8)#58 | 11.1%(+28.9)#2,960 |
| 59. | Ashland | 39.6% | 15.2%(+24.5)#59 | 11.1%(+28.6)#3,006 |
| 60. | Cut Bank | 39.3% | 15.2%(+24.1)#60 | 11.1%(+28.2)#3,051 |
| 61. | Big Sandy | 38.5% | 15.2%(+23.4)#61 | 11.1%(+27.5)#3,185 |
| 62. | Rudyard | 38.0% | 15.2%(+22.8)#62 | 11.1%(+26.9)#3,295 |
| 63. | Fox Lake | 37.9% | 15.2%(+22.8)#63 | 11.1%(+26.9)#3,307 |
| 64. | Valier | 37.8% | 15.2%(+22.7)#64 | 11.1%(+26.8)#3,319 |
| 65. | Sheridan | 37.8% | 15.2%(+22.6)#65 | 11.1%(+26.7)#3,333 |
| 66. | Hingham | 37.5% | 15.2%(+22.3)#66 | 11.1%(+26.4)#3,418 |
| 67. | Piltzville | 37.0% | 15.2%(+21.9)#67 | 11.1%(+26.0)#3,490 |
| 68. | Stockett | 36.4% | 15.2%(+21.2)#68 | 11.1%(+25.3)#3,653 |
| 69. | Plevna | 35.6% | 15.2%(+20.5)#69 | 11.1%(+24.6)#3,819 |
| 70. | Hysham | 35.5% | 15.2%(+20.3)#70 | 11.1%(+24.4)#3,860 |
| 71. | Hardy | 35.3% | 15.2%(+20.1)#71 | 11.1%(+24.2)#3,911 |
| 72. | Belfry | 34.9% | 15.2%(+19.7)#72 | 11.1%(+23.8)#3,996 |
| 73. | Belt | 34.8% | 15.2%(+19.6)#73 | 11.1%(+23.7)#4,017 |
| 74. | Wilsall | 34.8% | 15.2%(+19.6)#74 | 11.1%(+23.7)#4,022 |
| 75. | Wye | 34.5% | 15.2%(+19.3)#75 | 11.1%(+23.5)#4,087 |
| 76. | Troy | 34.0% | 15.2%(+18.8)#76 | 11.1%(+22.9)#4,218 |
| 77. | Chester | 33.3% | 15.2%(+18.2)#77 | 11.1%(+22.3)#4,364 |
| 78. | Culbertson | 33.3% | 15.2%(+18.2)#78 | 11.1%(+22.3)#4,374 |
| 79. | Pryor | 33.3% | 15.2%(+18.2)#79 | 11.1%(+22.3)#4,382 |
| 80. | Riverbend | 33.3% | 15.2%(+18.2)#80 | 11.1%(+22.3)#4,401 |
| 81. | Froid | 33.3% | 15.2%(+18.2)#81 | 11.1%(+22.3)#4,425 |
| 82. | Sand Coulee | 33.3% | 15.2%(+18.2)#82 | 11.1%(+22.3)#4,460 |
| 83. | Highwood | 33.3% | 15.2%(+18.2)#83 | 11.1%(+22.3)#4,481 |
| 84. | Turner | 33.3% | 15.2%(+18.2)#84 | 11.1%(+22.3)#4,563 |
| 85. | Sun River | 33.3% | 15.2%(+18.2)#85 | 11.1%(+22.3)#4,575 |
| 86. | Craig | 33.3% | 15.2%(+18.2)#86 | 11.1%(+22.3)#4,584 |
| 87. | Colstrip | 32.5% | 15.2%(+17.4)#87 | 11.1%(+21.5)#4,744 |
| 88. | East Helena | 32.5% | 15.2%(+17.3)#88 | 11.1%(+21.4)#4,766 |
| 89. | Heart Butte | 32.3% | 15.2%(+17.1)#89 | 11.1%(+21.2)#4,816 |
| 90. | Twin Bridges | 31.8% | 15.2%(+16.7)#90 | 11.1%(+20.8)#4,940 |
| 91. | Parker School | 31.6% | 15.2%(+16.4)#91 | 11.1%(+20.5)#5,019 |
| 92. | Harlowton | 31.3% | 15.2%(+16.2)#92 | 11.1%(+20.3)#5,106 |
| 93. | Poplar | 30.7% | 15.2%(+15.5)#93 | 11.1%(+19.6)#5,346 |
| 94. | Townsend | 30.6% | 15.2%(+15.5)#94 | 11.1%(+19.6)#5,358 |
| 95. | South Browning | 30.5% | 15.2%(+15.4)#95 | 11.1%(+19.5)#5,383 |
| 96. | Jordan | 30.3% | 15.2%(+15.1)#96 | 11.1%(+19.2)#5,453 |
| 97. | Harlem | 30.1% | 15.2%(+14.9)#97 | 11.1%(+19.0)#5,501 |
| 98. | Lewistown | 29.9% | 15.2%(+14.7)#98 | 11.1%(+18.8)#5,593 |
| 99. | Lewistown Heights | 29.1% | 15.2%(+13.9)#99 | 11.1%(+18.0)#5,930 |
| 100. | Drummond | 29.1% | 15.2%(+13.9)#100 | 11.1%(+18.0)#5,932 |
Common Questions
What are the Top 10 Cities with the Highest Percentage of Population with a Degree in Education in Montana?
Top 10 Cities with the Highest Percentage of Population with a Degree in Education in Montana are:
#1
100.0%
#2
100.0%
#3
100.0%
#4
100.0%
#5
100.0%
#6
90.9%
#7
88.6%
#8
88.2%
#9
88.1%
#10
84.3%
What city has the Highest Percentage of Population with a Degree in Education in Montana?
White Haven has the Highest Percentage of Population with a Degree in Education in Montana with 100.0%.
What is the Percentage of Population with a Degree in Education in the State of Montana?
Percentage of Population with a Degree in Education in Montana is 15.2%.
What is the Percentage of Population with a Degree in Education in the United States?
Percentage of Population with a Degree in Education in the United States is 11.1%.