Cities with the Highest Poverty Level Among Seniors Over the Age of 65 in Montana
RELATED REPORTS & OPTIONS
Highest Poverty | Seniors 65+
Montana
Compare Cities
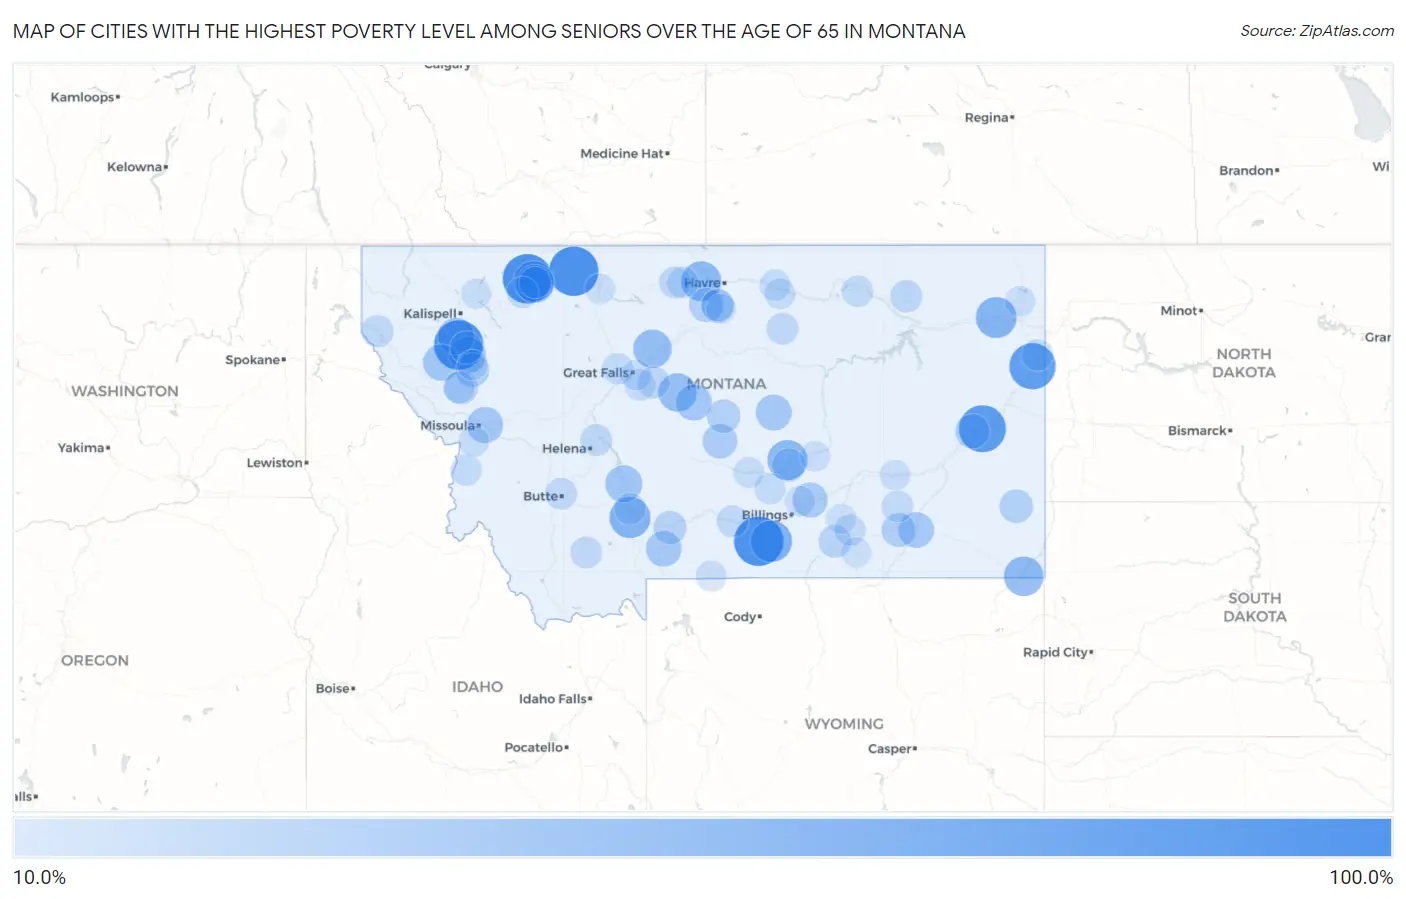
Map of Cities with the Highest Poverty Level Among Seniors Over the Age of 65 in Montana
0.0%
100.0%
Cities with the Highest Poverty Level Among Seniors Over the Age of 65 in Montana
| City | Senior Poverty | vs State | vs National | |
| 1. | Riverview Colony | 100.0% | 9.8%(+90.2)#1 | 10.0%(+90.0)#54 |
| 2. | Starr School | 100.0% | 9.8%(+90.2)#2 | 10.0%(+90.0)#63 |
| 3. | Elmo | 100.0% | 9.8%(+90.2)#3 | 10.0%(+90.0)#85 |
| 4. | New Rockport Colony | 100.0% | 9.8%(+90.2)#4 | 10.0%(+90.0)#110 |
| 5. | Argenta | 100.0% | 9.8%(+90.2)#5 | 10.0%(+90.0)#122 |
| 6. | Santa Rita | 100.0% | 9.8%(+90.2)#6 | 10.0%(+90.0)#159 |
| 7. | Boyd | 100.0% | 9.8%(+90.2)#7 | 10.0%(+90.0)#181 |
| 8. | Fallon | 89.4% | 9.8%(+79.6)#8 | 10.0%(+79.4)#233 |
| 9. | Moccasin | 87.5% | 9.8%(+77.7)#9 | 10.0%(+77.5)#240 |
| 10. | Crane | 86.4% | 9.8%(+76.6)#10 | 10.0%(+76.4)#246 |
| 11. | Canyon Creek | 82.9% | 9.8%(+73.1)#11 | 10.0%(+72.9)#264 |
| 12. | Edgar | 66.7% | 9.8%(+56.9)#12 | 10.0%(+56.7)#412 |
| 13. | Amsterdam | 64.3% | 9.8%(+54.5)#13 | 10.0%(+54.3)#449 |
| 14. | Norris | 63.6% | 9.8%(+53.9)#14 | 10.0%(+53.7)#457 |
| 15. | Brockton | 63.3% | 9.8%(+53.6)#15 | 10.0%(+53.4)#461 |
| 16. | North Browning | 60.9% | 9.8%(+51.1)#16 | 10.0%(+50.9)#491 |
| 17. | Camp Three | 60.5% | 9.8%(+50.7)#17 | 10.0%(+50.6)#501 |
| 18. | Kremlin | 60.0% | 9.8%(+50.2)#18 | 10.0%(+50.0)#512 |
| 19. | Alzada | 58.3% | 9.8%(+48.6)#19 | 10.0%(+48.4)#541 |
| 20. | Glacier Colony | 57.4% | 9.8%(+47.6)#20 | 10.0%(+47.4)#549 |
| 21. | Turner Colony | 57.1% | 9.8%(+47.4)#21 | 10.0%(+47.2)#556 |
| 22. | Bull Lake | 56.6% | 9.8%(+46.8)#22 | 10.0%(+46.6)#572 |
| 23. | Carter | 53.3% | 9.8%(+43.6)#23 | 10.0%(+43.4)#658 |
| 24. | Geyser | 53.3% | 9.8%(+43.6)#24 | 10.0%(+43.4)#659 |
| 25. | South Browning | 52.4% | 9.8%(+42.6)#25 | 10.0%(+42.4)#680 |
| 26. | New Miami Colony | 50.0% | 9.8%(+40.2)#26 | 10.0%(+40.0)#761 |
| 27. | Cyr | 50.0% | 9.8%(+40.2)#27 | 10.0%(+40.0)#778 |
| 28. | Danvers | 50.0% | 9.8%(+40.2)#28 | 10.0%(+40.0)#808 |
| 29. | Toston | 47.2% | 9.8%(+37.4)#29 | 10.0%(+37.2)#892 |
| 30. | Jette | 46.9% | 9.8%(+37.1)#30 | 10.0%(+37.0)#901 |
| 31. | Lake Mary Ronan | 46.7% | 9.8%(+36.9)#31 | 10.0%(+36.7)#915 |
| 32. | Camas | 45.0% | 9.8%(+35.2)#32 | 10.0%(+35.0)#979 |
| 33. | Big Stone Colony | 44.4% | 9.8%(+34.7)#33 | 10.0%(+34.5)#1,005 |
| 34. | Bonner West Riverside | 43.6% | 9.8%(+33.8)#34 | 10.0%(+33.7)#1,044 |
| 35. | Stanford | 43.4% | 9.8%(+33.6)#35 | 10.0%(+33.5)#1,058 |
| 36. | Grass Range | 43.1% | 9.8%(+33.3)#36 | 10.0%(+33.2)#1,070 |
| 37. | Emigrant | 42.1% | 9.8%(+32.3)#37 | 10.0%(+32.1)#1,122 |
| 38. | Ashland | 41.7% | 9.8%(+31.9)#38 | 10.0%(+31.8)#1,135 |
| 39. | Worden | 40.3% | 9.8%(+30.5)#39 | 10.0%(+30.4)#1,218 |
| 40. | Rapelje | 40.0% | 9.8%(+30.2)#40 | 10.0%(+30.0)#1,249 |
| 41. | Silver Star | 38.9% | 9.8%(+29.1)#41 | 10.0%(+28.9)#1,326 |
| 42. | Judith Gap | 38.5% | 9.8%(+28.7)#42 | 10.0%(+28.5)#1,356 |
| 43. | Twodot | 37.5% | 9.8%(+27.7)#43 | 10.0%(+27.5)#1,424 |
| 44. | Terry | 36.9% | 9.8%(+27.1)#44 | 10.0%(+27.0)#1,466 |
| 45. | Rocky Boy West | 35.9% | 9.8%(+26.1)#45 | 10.0%(+25.9)#1,552 |
| 46. | Lame Deer | 35.7% | 9.8%(+25.9)#46 | 10.0%(+25.8)#1,570 |
| 47. | Ronan | 34.4% | 9.8%(+24.7)#47 | 10.0%(+24.5)#1,677 |
| 48. | Ekalaka | 34.1% | 9.8%(+24.3)#48 | 10.0%(+24.1)#1,710 |
| 49. | Moore | 33.3% | 9.8%(+23.6)#49 | 10.0%(+23.4)#1,778 |
| 50. | Old Agency | 33.3% | 9.8%(+23.6)#50 | 10.0%(+23.4)#1,813 |
| 51. | Wineglass | 32.4% | 9.8%(+22.7)#51 | 10.0%(+22.5)#1,896 |
| 52. | Klein | 32.1% | 9.8%(+22.3)#52 | 10.0%(+22.1)#1,928 |
| 53. | Sangrey | 31.2% | 9.8%(+21.5)#53 | 10.0%(+21.3)#2,043 |
| 54. | St Xavier | 30.0% | 9.8%(+20.2)#54 | 10.0%(+20.0)#2,208 |
| 55. | Lindisfarne | 29.5% | 9.8%(+19.7)#55 | 10.0%(+19.5)#2,283 |
| 56. | Azure | 28.6% | 9.8%(+18.8)#56 | 10.0%(+18.6)#2,432 |
| 57. | St Marie | 27.8% | 9.8%(+18.0)#57 | 10.0%(+17.8)#2,578 |
| 58. | Belt | 27.6% | 9.8%(+17.9)#58 | 10.0%(+17.7)#2,614 |
| 59. | Noxon | 27.3% | 9.8%(+17.5)#59 | 10.0%(+17.3)#2,682 |
| 60. | Hays | 27.0% | 9.8%(+17.3)#60 | 10.0%(+17.1)#2,723 |
| 61. | Rudyard | 26.9% | 9.8%(+17.1)#61 | 10.0%(+17.0)#2,742 |
| 62. | Reed Point | 26.8% | 9.8%(+17.0)#62 | 10.0%(+16.9)#2,759 |
| 63. | Walkerville | 26.4% | 9.8%(+16.6)#63 | 10.0%(+16.5)#2,838 |
| 64. | Alder | 26.3% | 9.8%(+16.5)#64 | 10.0%(+16.4)#2,863 |
| 65. | Helena Valley Northeast | 26.1% | 9.8%(+16.3)#65 | 10.0%(+16.2)#2,903 |
| 66. | Dixon | 25.6% | 9.8%(+15.9)#66 | 10.0%(+15.7)#2,995 |
| 67. | Sidney | 25.6% | 9.8%(+15.8)#67 | 10.0%(+15.6)#3,014 |
| 68. | Colstrip | 25.6% | 9.8%(+15.8)#68 | 10.0%(+15.6)#3,018 |
| 69. | East Glacier Park Village | 25.4% | 9.8%(+15.6)#69 | 10.0%(+15.5)#3,061 |
| 70. | Manhattan | 25.4% | 9.8%(+15.6)#70 | 10.0%(+15.4)#3,073 |
| 71. | Browning | 25.0% | 9.8%(+15.2)#71 | 10.0%(+15.0)#3,145 |
| 72. | Saco | 25.0% | 9.8%(+15.2)#72 | 10.0%(+15.0)#3,188 |
| 73. | Hingham | 25.0% | 9.8%(+15.2)#73 | 10.0%(+15.0)#3,197 |
| 74. | Birch Creek Colony | 25.0% | 9.8%(+15.2)#74 | 10.0%(+15.0)#3,200 |
| 75. | Tracy | 25.0% | 9.8%(+15.2)#75 | 10.0%(+15.0)#3,215 |
| 76. | Floweree | 25.0% | 9.8%(+15.2)#76 | 10.0%(+15.0)#3,232 |
| 77. | Vaughn | 24.8% | 9.8%(+15.0)#77 | 10.0%(+14.8)#3,261 |
| 78. | Crow Agency | 24.6% | 9.8%(+14.8)#78 | 10.0%(+14.6)#3,286 |
| 79. | Stockett | 24.5% | 9.8%(+14.7)#79 | 10.0%(+14.6)#3,300 |
| 80. | Harlem | 24.4% | 9.8%(+14.6)#80 | 10.0%(+14.4)#3,336 |
| 81. | Jeffers | 24.0% | 9.8%(+14.2)#81 | 10.0%(+14.0)#3,453 |
| 82. | Pinesdale | 23.9% | 9.8%(+14.1)#82 | 10.0%(+14.0)#3,466 |
| 83. | Broadview | 23.5% | 9.8%(+13.7)#83 | 10.0%(+13.6)#3,576 |
| 84. | Fort Belknap Agency | 23.0% | 9.8%(+13.2)#84 | 10.0%(+13.1)#3,727 |
| 85. | Ryegate | 22.9% | 9.8%(+13.1)#85 | 10.0%(+12.9)#3,760 |
| 86. | Carlton | 22.8% | 9.8%(+13.0)#86 | 10.0%(+12.9)#3,788 |
| 87. | Cooke City | 22.7% | 9.8%(+12.9)#87 | 10.0%(+12.8)#3,815 |
| 88. | Gibson Flats | 22.0% | 9.8%(+12.2)#88 | 10.0%(+12.0)#4,038 |
| 89. | Musselshell | 21.4% | 9.8%(+11.6)#89 | 10.0%(+11.5)#4,195 |
| 90. | Shepherd | 21.2% | 9.8%(+11.5)#90 | 10.0%(+11.3)#4,245 |
| 91. | Froid | 21.2% | 9.8%(+11.4)#91 | 10.0%(+11.3)#4,259 |
| 92. | Forsyth | 20.9% | 9.8%(+11.1)#92 | 10.0%(+10.9)#4,379 |
| 93. | Shelby | 20.8% | 9.8%(+11.0)#93 | 10.0%(+10.8)#4,422 |
| 94. | Pablo | 20.7% | 9.8%(+11.0)#94 | 10.0%(+10.8)#4,432 |
| 95. | Coram | 20.7% | 9.8%(+10.9)#95 | 10.0%(+10.7)#4,449 |
| 96. | Hardin | 20.5% | 9.8%(+10.8)#96 | 10.0%(+10.6)#4,503 |
| 97. | Lodge Grass | 20.5% | 9.8%(+10.7)#97 | 10.0%(+10.6)#4,515 |
| 98. | Parker School | 20.0% | 9.8%(+10.2)#98 | 10.0%(+10.0)#4,722 |
| 99. | Acton | 20.0% | 9.8%(+10.2)#99 | 10.0%(+10.0)#4,775 |
| 100. | Pinnacle | 20.0% | 9.8%(+10.2)#100 | 10.0%(+10.0)#4,788 |
Common Questions
What are the Top 10 Cities with the Highest Poverty Level Among Seniors Over the Age of 65 in Montana?
Top 10 Cities with the Highest Poverty Level Among Seniors Over the Age of 65 in Montana are:
#1
100.0%
#2
100.0%
#3
100.0%
#4
100.0%
#5
89.4%
#6
86.4%
#7
66.7%
#8
64.3%
#9
63.3%
#10
60.9%
What city has the Highest Poverty Level Among Seniors Over the Age of 65 in Montana?
Starr School has the Highest Poverty Level Among Seniors Over the Age of 65 in Montana with 100.0%.
What is the Poverty Level Among Seniors Over the Age of 65 in the State of Montana?
Poverty Level Among Seniors Over the Age of 65 in Montana is 9.8%.
What is the Poverty Level Among Seniors Over the Age of 65 in the United States?
Poverty Level Among Seniors Over the Age of 65 in the United States is 10.0%.