Immigrants from Venezuela vs Immigrants from Bahamas Disability Age 5 to 17

COMPARE

Immigrants from Venezuela
Race
Ancestry
AfghanAfricanAlaska NativeAlaskan AthabascanAlbanianAleutAlsatianAmericanApacheArabArapahoArgentineanArmenianAssyrian/Chaldean/SyriacAustralianAustrianBahamianBangladeshiBarbadianBasqueBelgianBelizeanBermudanBhutaneseBlackfeetBolivianBrazilianBritishBritish West IndianBulgarianBurmeseCajunCambodianCanadianCape VerdeanCarpatho RusynCelticCentral AmericanCentral American IndianCherokeeCheyenneChickasawChileanChineseChippewaChoctawColombianColvilleComancheCosta RicanCreeCreekCroatianCrowCubanCypriotCzechCzechoslovakianDanishDelawareDominicanDutchDutch West IndianEastern EuropeanEcuadorianEgyptianEnglishEstonianEthiopianEuropeanFijianFilipinoFinnishFrenchFrench American IndianFrench CanadianGermanGerman RussianGhanaianGreekGuamanian/ChamorroGuatemalanGuyaneseHaitianHmongHonduranHopiHoumaHungarianIcelanderIndian (Asian)IndonesianInupiatIranianIraqiIrishIroquoisIsraeliItalianJamaicanJapaneseJordanianKenyanKiowaKoreanLaotianLatvianLebaneseLiberianLithuanianLumbeeLuxembourgerMacedonianMalaysianMalteseMarshalleseMenomineeMexicanMexican American IndianMongolianMoroccanNative HawaiianNavajoNepaleseNew ZealanderNicaraguanNigerianNorthern EuropeanNorwegianOkinawanOsageOttawaPaiutePakistaniPalestinianPanamanianParaguayanPennsylvania GermanPeruvianPimaPolishPortuguesePotawatomiPuebloPuerto RicanPuget Sound SalishRomanianRussianSalvadoranSamoanScandinavianScotch-IrishScottishSeminoleSenegaleseSerbianShoshoneSierra LeoneanSiouxSlavicSlovakSloveneSomaliSouth AfricanSouth AmericanSouth American IndianSoviet UnionSpaniardSpanishSpanish AmericanSpanish American IndianSri LankanSubsaharan AfricanSudaneseSwedishSwissSyrianTaiwaneseThaiTlingit-HaidaTohono O'OdhamTonganTrinidadian and TobagonianTsimshianTurkishU.S. Virgin IslanderUgandanUkrainianUruguayanUteVenezuelanVietnameseWelshWest IndianYakamaYaquiYugoslavianYumanYup'ikZimbabwean
Immigration
NonimmigrantsImmigrantsAfghanistanAfricaAlbaniaArgentinaArmeniaAsiaAustraliaAustriaBangladeshBarbadosBelarusBelgiumBelizeBoliviaBosnia and HerzegovinaBrazilBulgariaBurma/MyanmarCabo VerdeCambodiaCameroonCanadaCaribbeanCentral AmericaChileChinaColombiaCongoCosta RicaCroatiaCubaCzechoslovakiaDenmarkDominicaDominican RepublicEastern AfricaEastern AsiaEastern EuropeEcuadorEgyptEl SalvadorEnglandEritreaEthiopiaEuropeFijiFranceGermanyGhanaGreeceGrenadaGuatemalaGuyanaHaitiHondurasHong KongHungaryIndiaIndonesiaIranIraqIrelandIsraelItalyJamaicaJapanJordanKazakhstanKenyaKoreaKuwaitLaosLatin AmericaLatviaLebanonLiberiaLithuaniaMalaysiaMexicoMicronesiaMiddle AfricaMoldovaMoroccoNepalNetherlandsNicaraguaNigeriaNorth AmericaNorth MacedoniaNorthern AfricaNorthern EuropeNorwayOceaniaPakistanPanamaPeruPhilippinesPolandPortugalRomaniaRussiaSaudi ArabiaScotlandSenegalSerbiaSierra LeoneSingaporeSomaliaSouth AfricaSouth AmericaSouth Central AsiaSouth Eastern AsiaSouthern EuropeSpainSri LankaSt. Vincent and the GrenadinesSudanSwedenSwitzerlandSyriaTaiwanThailandTrinidad and TobagoTurkeyUgandaUkraineUruguayUzbekistanVenezuelaVietnamWest IndiesWestern AfricaWestern AsiaWestern EuropeYemenZaireZimbabweAzores
Immigrants from Bahamas
Race
Ancestry
AfghanAfricanAlaska NativeAlaskan AthabascanAlbanianAleutAlsatianAmericanApacheArabArapahoArgentineanArmenianAssyrian/Chaldean/SyriacAustralianAustrianBahamianBangladeshiBarbadianBasqueBelgianBelizeanBermudanBhutaneseBlackfeetBolivianBrazilianBritishBritish West IndianBulgarianBurmeseCajunCambodianCanadianCape VerdeanCarpatho RusynCelticCentral AmericanCentral American IndianCherokeeCheyenneChickasawChileanChineseChippewaChoctawColombianColvilleComancheCosta RicanCreeCreekCroatianCrowCubanCypriotCzechCzechoslovakianDanishDelawareDominicanDutchDutch West IndianEastern EuropeanEcuadorianEgyptianEnglishEstonianEthiopianEuropeanFijianFilipinoFinnishFrenchFrench American IndianFrench CanadianGermanGerman RussianGhanaianGreekGuamanian/ChamorroGuatemalanGuyaneseHaitianHmongHonduranHopiHoumaHungarianIcelanderIndian (Asian)IndonesianInupiatIranianIraqiIrishIroquoisIsraeliItalianJamaicanJapaneseJordanianKenyanKiowaKoreanLaotianLatvianLebaneseLiberianLithuanianLumbeeLuxembourgerMacedonianMalaysianMalteseMarshalleseMenomineeMexicanMexican American IndianMongolianMoroccanNative HawaiianNavajoNepaleseNew ZealanderNicaraguanNigerianNorthern EuropeanNorwegianOkinawanOsageOttawaPaiutePakistaniPalestinianPanamanianParaguayanPennsylvania GermanPeruvianPimaPolishPortuguesePotawatomiPuebloPuerto RicanPuget Sound SalishRomanianRussianSalvadoranSamoanScandinavianScotch-IrishScottishSeminoleSenegaleseSerbianShoshoneSierra LeoneanSiouxSlavicSlovakSloveneSomaliSouth AfricanSouth AmericanSouth American IndianSoviet UnionSpaniardSpanishSpanish AmericanSpanish American IndianSri LankanSubsaharan AfricanSudaneseSwedishSwissSyrianTaiwaneseThaiTlingit-HaidaTohono O'OdhamTonganTrinidadian and TobagonianTsimshianTurkishU.S. Virgin IslanderUgandanUkrainianUruguayanUteVenezuelanVietnameseWelshWest IndianYakamaYaquiYugoslavianYumanYup'ikZimbabwean
Immigration
NonimmigrantsImmigrantsAfghanistanAfricaAlbaniaArgentinaArmeniaAsiaAustraliaAustriaBahamasBangladeshBarbadosBelarusBelgiumBelizeBoliviaBosnia and HerzegovinaBrazilBulgariaBurma/MyanmarCabo VerdeCambodiaCameroonCanadaCaribbeanCentral AmericaChileChinaColombiaCongoCosta RicaCroatiaCubaCzechoslovakiaDenmarkDominicaDominican RepublicEastern AfricaEastern AsiaEastern EuropeEcuadorEgyptEl SalvadorEnglandEritreaEthiopiaEuropeFijiFranceGermanyGhanaGreeceGrenadaGuatemalaGuyanaHaitiHondurasHong KongHungaryIndiaIndonesiaIranIraqIrelandIsraelItalyJamaicaJapanJordanKazakhstanKenyaKoreaKuwaitLaosLatin AmericaLatviaLebanonLiberiaLithuaniaMalaysiaMexicoMicronesiaMiddle AfricaMoldovaMoroccoNepalNetherlandsNicaraguaNigeriaNorth AmericaNorth MacedoniaNorthern AfricaNorthern EuropeNorwayOceaniaPakistanPanamaPeruPhilippinesPolandPortugalRomaniaRussiaSaudi ArabiaScotlandSenegalSerbiaSierra LeoneSingaporeSomaliaSouth AfricaSouth AmericaSouth Central AsiaSouth Eastern AsiaSouthern EuropeSpainSri LankaSt. Vincent and the GrenadinesSudanSwedenSwitzerlandSyriaTaiwanThailandTrinidad and TobagoTurkeyUgandaUkraineUruguayUzbekistanVietnamWest IndiesWestern AfricaWestern AsiaWestern EuropeYemenZaireZimbabweAzores
Disability Age 5 to 17
Income
Poverty
Unemployment
Labor Participation
Family Structure
Vehicle Availability
Education Level
Disability

Disability Age 5 to 17 Comparison

Immigrants from Venezuela

Immigrants from Bahamas

Exceptional
Tragic
5.4%
DISABILITY AGE 5 TO 17
94.5/ 100
METRIC RATING
128th/ 347
METRIC RANK
6.2%
DISABILITY AGE 5 TO 17
0.0/ 100
METRIC RATING
297th/ 347
METRIC RANK

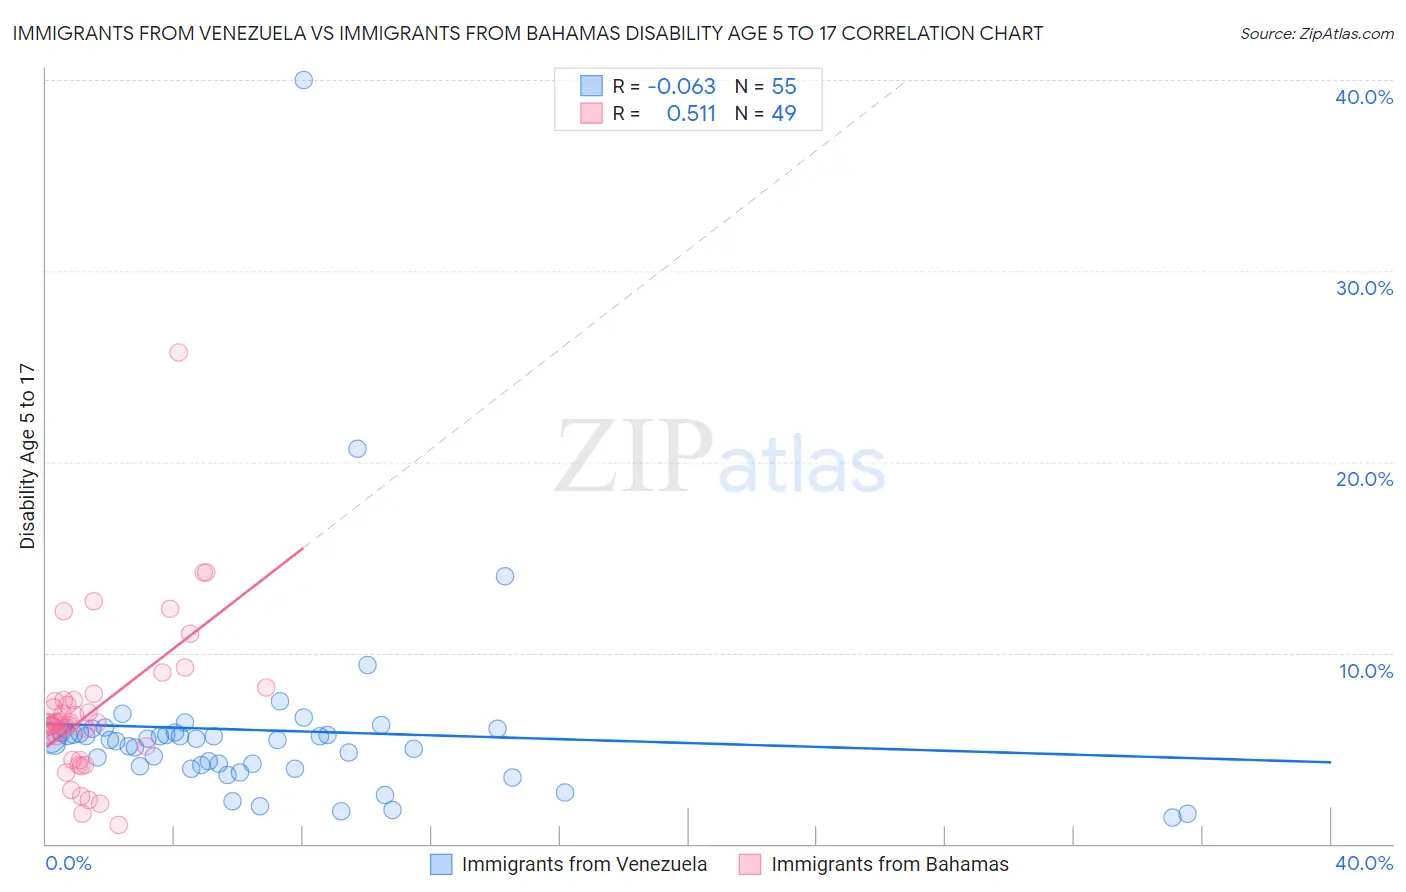
Immigrants from Venezuela vs Immigrants from Bahamas Disability Age 5 to 17 Correlation Chart

The statistical analysis conducted on geographies consisting of 286,570,135 people shows a slight negative correlation between the proportion of Immigrants from Venezuela and percentage of population with a disability between the ages 5 and 17 in the United States with a correlation coefficient (R) of -0.063 and weighted average of 5.4%. Similarly, the statistical analysis conducted on geographies consisting of 104,453,975 people shows a substantial positive correlation between the proportion of Immigrants from Bahamas and percentage of population with a disability between the ages 5 and 17 in the United States with a correlation coefficient (R) of 0.511 and weighted average of 6.2%, a difference of 15.5%.
Immigrants from Venezuela vs Immigrants from Bahamas Disability Age 5 to 17

Disability Age 5 to 17 Correlation Summary

MeasurementImmigrants from VenezuelaImmigrants from Bahamas
Minimum1.4%0.96%
Maximum40.0%25.7%
Range38.6%24.8%
Mean5.9%6.9%
Median5.5%6.3%
Interquartile 25% (IQ1)4.1%4.7%
Interquartile 75% (IQ3)5.8%7.5%
Interquartile Range (IQR)1.8%2.8%
Standard Deviation (Sample)5.5%4.0%
Standard Deviation (Population)5.5%4.0%

Similar Demographics by Disability Age 5 to 17

Demographics Similar to Immigrants from Venezuela by Disability Age 5 to 17

In terms of disability age 5 to 17, the demographic groups most similar to Immigrants from Venezuela are Romanian (5.4%, a difference of 0.090%), Latvian (5.4%, a difference of 0.11%), Immigrants from Bulgaria (5.4%, a difference of 0.11%), New Zealander (5.4%, a difference of 0.12%), and Immigrants from Chile (5.4%, a difference of 0.13%).
DemographicsRating | RankDisability Age 5 to 17
Maltese
96.0
/100
|
#121
Exceptional
5.4%
Chileans
95.8
/100
|
#122
Exceptional
5.4%
Immigrants | Ethiopia
95.5
/100
|
#123
Exceptional
5.4%
Crow
95.0
/100
|
#124
Exceptional
5.4%
Immigrants | Chile
95.0
/100
|
#125
Exceptional
5.4%
New Zealanders
95.0
/100
|
#126
Exceptional
5.4%
Latvians
95.0
/100
|
#127
Exceptional
5.4%
Immigrants | Venezuela
94.5
/100
|
#128
Exceptional
5.4%
Romanians
94.1
/100
|
#129
Exceptional
5.4%
Immigrants | Bulgaria
94.0
/100
|
#130
Exceptional
5.4%
Arabs
92.9
/100
|
#131
Exceptional
5.4%
Immigrants | Colombia
92.9
/100
|
#132
Exceptional
5.4%
Venezuelans
92.7
/100
|
#133
Exceptional
5.4%
Yuman
92.3
/100
|
#134
Exceptional
5.4%
Immigrants | Belize
91.7
/100
|
#135
Exceptional
5.4%

Demographics Similar to Immigrants from Bahamas by Disability Age 5 to 17

In terms of disability age 5 to 17, the demographic groups most similar to Immigrants from Bahamas are Lumbee (6.2%, a difference of 0.070%), Spanish American (6.2%, a difference of 0.12%), Cree (6.2%, a difference of 0.15%), Welsh (6.3%, a difference of 0.22%), and Carpatho Rusyn (6.3%, a difference of 0.34%).
DemographicsRating | RankDisability Age 5 to 17
Immigrants | Congo
0.0
/100
|
#290
Tragic
6.2%
Whites/Caucasians
0.0
/100
|
#291
Tragic
6.2%
Immigrants | Senegal
0.0
/100
|
#292
Tragic
6.2%
Central American Indians
0.0
/100
|
#293
Tragic
6.2%
Irish
0.0
/100
|
#294
Tragic
6.2%
Cree
0.0
/100
|
#295
Tragic
6.2%
Spanish Americans
0.0
/100
|
#296
Tragic
6.2%
Immigrants | Bahamas
0.0
/100
|
#297
Tragic
6.2%
Lumbee
0.0
/100
|
#298
Tragic
6.2%
Welsh
0.0
/100
|
#299
Tragic
6.3%
Carpatho Rusyns
0.0
/100
|
#300
Tragic
6.3%
U.S. Virgin Islanders
0.0
/100
|
#301
Tragic
6.3%
Celtics
0.0
/100
|
#302
Tragic
6.3%
Yakama
0.0
/100
|
#303
Tragic
6.3%
Senegalese
0.0
/100
|
#304
Tragic
6.3%