Immigrants from Ireland vs Peruvian Self-Care Disability

COMPARE

Immigrants from Ireland
Race
Ancestry
AfghanAfricanAlaska NativeAlaskan AthabascanAlbanianAleutAlsatianAmericanApacheArabArapahoArgentineanArmenianAssyrian/Chaldean/SyriacAustralianAustrianBahamianBangladeshiBarbadianBasqueBelgianBelizeanBermudanBhutaneseBlackfeetBolivianBrazilianBritishBritish West IndianBulgarianBurmeseCajunCambodianCanadianCape VerdeanCarpatho RusynCelticCentral AmericanCentral American IndianCherokeeCheyenneChickasawChileanChineseChippewaChoctawColombianColvilleComancheCosta RicanCreeCreekCroatianCrowCubanCypriotCzechCzechoslovakianDanishDelawareDominicanDutchDutch West IndianEastern EuropeanEcuadorianEgyptianEnglishEstonianEthiopianEuropeanFijianFilipinoFinnishFrenchFrench American IndianFrench CanadianGermanGerman RussianGhanaianGreekGuamanian/ChamorroGuatemalanGuyaneseHaitianHmongHonduranHopiHoumaHungarianIcelanderIndian (Asian)IndonesianInupiatIranianIraqiIrishIroquoisIsraeliItalianJamaicanJapaneseJordanianKenyanKiowaKoreanLaotianLatvianLebaneseLiberianLithuanianLumbeeLuxembourgerMacedonianMalaysianMalteseMarshalleseMenomineeMexicanMexican American IndianMongolianMoroccanNative HawaiianNavajoNepaleseNew ZealanderNicaraguanNigerianNorthern EuropeanNorwegianOkinawanOsageOttawaPaiutePakistaniPalestinianPanamanianParaguayanPennsylvania GermanPimaPolishPortuguesePotawatomiPuebloPuerto RicanPuget Sound SalishRomanianRussianSalvadoranSamoanScandinavianScotch-IrishScottishSeminoleSenegaleseSerbianShoshoneSierra LeoneanSiouxSlavicSlovakSloveneSomaliSouth AfricanSouth AmericanSouth American IndianSoviet UnionSpaniardSpanishSpanish AmericanSpanish American IndianSri LankanSubsaharan AfricanSudaneseSwedishSwissSyrianTaiwaneseThaiTlingit-HaidaTohono O'OdhamTonganTrinidadian and TobagonianTsimshianTurkishU.S. Virgin IslanderUgandanUkrainianUruguayanUteVenezuelanVietnameseWelshWest IndianYakamaYaquiYugoslavianYumanYup'ikZimbabwean
Immigration
NonimmigrantsImmigrantsAfghanistanAfricaAlbaniaArgentinaArmeniaAsiaAustraliaAustriaBahamasBangladeshBarbadosBelarusBelgiumBelizeBoliviaBosnia and HerzegovinaBrazilBulgariaBurma/MyanmarCabo VerdeCambodiaCameroonCanadaCaribbeanCentral AmericaChileChinaColombiaCongoCosta RicaCroatiaCubaCzechoslovakiaDenmarkDominicaDominican RepublicEastern AfricaEastern AsiaEastern EuropeEcuadorEgyptEl SalvadorEnglandEritreaEthiopiaEuropeFijiFranceGermanyGhanaGreeceGrenadaGuatemalaGuyanaHaitiHondurasHong KongHungaryIndiaIndonesiaIranIraqIrelandIsraelItalyJamaicaJapanJordanKazakhstanKenyaKoreaKuwaitLaosLatin AmericaLatviaLebanonLiberiaLithuaniaMalaysiaMexicoMicronesiaMiddle AfricaMoldovaMoroccoNepalNetherlandsNicaraguaNigeriaNorth AmericaNorth MacedoniaNorthern AfricaNorthern EuropeNorwayOceaniaPakistanPanamaPeruPhilippinesPolandPortugalRomaniaRussiaSaudi ArabiaScotlandSenegalSerbiaSierra LeoneSingaporeSomaliaSouth AfricaSouth AmericaSouth Central AsiaSouth Eastern AsiaSouthern EuropeSpainSri LankaSt. Vincent and the GrenadinesSudanSwedenSwitzerlandSyriaTaiwanThailandTrinidad and TobagoTurkeyUgandaUkraineUruguayUzbekistanVenezuelaVietnamWest IndiesWestern AfricaWestern AsiaWestern EuropeYemenZaireZimbabweAzores
Peruvian
Race
Ancestry
AfghanAfricanAlaska NativeAlaskan AthabascanAlbanianAleutAlsatianAmericanApacheArabArapahoArgentineanArmenianAssyrian/Chaldean/SyriacAustralianAustrianBahamianBangladeshiBarbadianBasqueBelgianBelizeanBermudanBhutaneseBlackfeetBolivianBrazilianBritishBritish West IndianBulgarianBurmeseCajunCambodianCanadianCape VerdeanCarpatho RusynCelticCentral AmericanCentral American IndianCherokeeCheyenneChickasawChileanChineseChippewaChoctawColombianColvilleComancheCosta RicanCreeCreekCroatianCrowCubanCypriotCzechCzechoslovakianDanishDelawareDominicanDutchDutch West IndianEastern EuropeanEcuadorianEgyptianEnglishEstonianEthiopianEuropeanFijianFilipinoFinnishFrenchFrench American IndianFrench CanadianGermanGerman RussianGhanaianGreekGuamanian/ChamorroGuatemalanGuyaneseHaitianHmongHonduranHopiHoumaHungarianIcelanderIndian (Asian)IndonesianInupiatIranianIraqiIrishIroquoisIsraeliItalianJamaicanJapaneseJordanianKenyanKiowaKoreanLaotianLatvianLebaneseLiberianLithuanianLumbeeLuxembourgerMacedonianMalaysianMalteseMarshalleseMenomineeMexicanMexican American IndianMongolianMoroccanNative HawaiianNavajoNepaleseNew ZealanderNicaraguanNigerianNorthern EuropeanNorwegianOkinawanOsageOttawaPaiutePakistaniPalestinianPanamanianParaguayanPennsylvania GermanPeruvianPimaPolishPortuguesePotawatomiPuebloPuerto RicanPuget Sound SalishRomanianRussianSalvadoranSamoanScandinavianScotch-IrishScottishSeminoleSenegaleseSerbianShoshoneSierra LeoneanSiouxSlavicSlovakSloveneSomaliSouth AfricanSouth AmericanSouth American IndianSoviet UnionSpaniardSpanishSpanish AmericanSpanish American IndianSri LankanSubsaharan AfricanSudaneseSwedishSwissSyrianTaiwaneseThaiTlingit-HaidaTohono O'OdhamTonganTrinidadian and TobagonianTsimshianTurkishU.S. Virgin IslanderUgandanUkrainianUruguayanUteVenezuelanVietnameseWelshWest IndianYakamaYaquiYugoslavianYumanYup'ikZimbabwean
Immigration
NonimmigrantsImmigrantsAfghanistanAfricaAlbaniaArgentinaArmeniaAsiaAustraliaAustriaBahamasBangladeshBarbadosBelarusBelgiumBelizeBoliviaBosnia and HerzegovinaBrazilBulgariaBurma/MyanmarCabo VerdeCambodiaCameroonCanadaCaribbeanCentral AmericaChileChinaColombiaCongoCosta RicaCroatiaCubaCzechoslovakiaDenmarkDominicaDominican RepublicEastern AfricaEastern AsiaEastern EuropeEcuadorEgyptEl SalvadorEnglandEritreaEthiopiaEuropeFijiFranceGermanyGhanaGreeceGrenadaGuatemalaGuyanaHaitiHondurasHong KongHungaryIndiaIndonesiaIranIraqIsraelItalyJamaicaJapanJordanKazakhstanKenyaKoreaKuwaitLaosLatin AmericaLatviaLebanonLiberiaLithuaniaMalaysiaMexicoMicronesiaMiddle AfricaMoldovaMoroccoNepalNetherlandsNicaraguaNigeriaNorth AmericaNorth MacedoniaNorthern AfricaNorthern EuropeNorwayOceaniaPakistanPanamaPeruPhilippinesPolandPortugalRomaniaRussiaSaudi ArabiaScotlandSenegalSerbiaSierra LeoneSingaporeSomaliaSouth AfricaSouth AmericaSouth Central AsiaSouth Eastern AsiaSouthern EuropeSpainSri LankaSt. Vincent and the GrenadinesSudanSwedenSwitzerlandSyriaTaiwanThailandTrinidad and TobagoTurkeyUgandaUkraineUruguayUzbekistanVenezuelaVietnamWest IndiesWestern AfricaWestern AsiaWestern EuropeYemenZaireZimbabweAzores
Self-Care Disability
Income
Poverty
Unemployment
Labor Participation
Family Structure
Vehicle Availability
Education Level
Disability

Self-Care Disability Comparison

Immigrants from Ireland

Peruvians

Exceptional
Exceptional
2.3%
SELF-CARE DISABILITY
99.0/ 100
METRIC RATING
78th/ 347
METRIC RANK
2.4%
SELF-CARE DISABILITY
91.3/ 100
METRIC RATING
121st/ 347
METRIC RANK

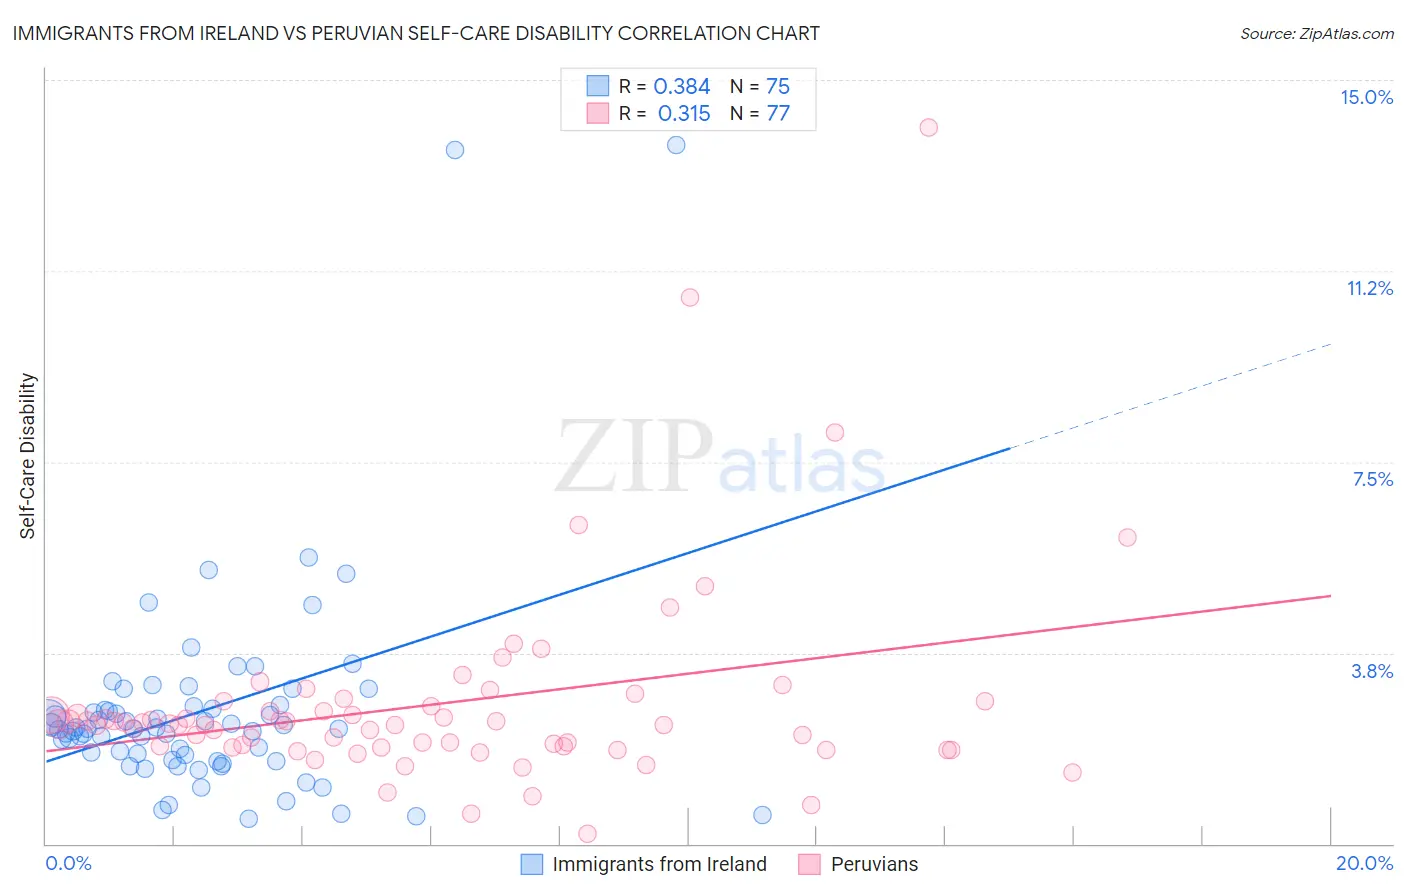
Immigrants from Ireland vs Peruvian Self-Care Disability Correlation Chart

The statistical analysis conducted on geographies consisting of 240,643,513 people shows a mild positive correlation between the proportion of Immigrants from Ireland and percentage of population with self-care disability in the United States with a correlation coefficient (R) of 0.384 and weighted average of 2.3%. Similarly, the statistical analysis conducted on geographies consisting of 362,873,301 people shows a mild positive correlation between the proportion of Peruvians and percentage of population with self-care disability in the United States with a correlation coefficient (R) of 0.315 and weighted average of 2.4%, a difference of 2.8%.
Immigrants from Ireland vs Peruvian Self-Care Disability

Self-Care Disability Correlation Summary

MeasurementImmigrants from IrelandPeruvian
Minimum0.50%0.20%
Maximum13.7%14.1%
Range13.2%13.9%
Mean2.6%2.7%
Median2.3%2.3%
Interquartile 25% (IQ1)1.7%1.9%
Interquartile 75% (IQ3)2.7%2.8%
Interquartile Range (IQR)1.0%0.86%
Standard Deviation (Sample)2.1%2.0%
Standard Deviation (Population)2.1%2.0%

Similar Demographics by Self-Care Disability

Demographics Similar to Immigrants from Ireland by Self-Care Disability

In terms of self-care disability, the demographic groups most similar to Immigrants from Ireland are Immigrants from Middle Africa (2.3%, a difference of 0.0%), Immigrants from Kenya (2.3%, a difference of 0.010%), Immigrants from China (2.3%, a difference of 0.080%), Immigrants from Netherlands (2.3%, a difference of 0.090%), and Immigrants from Switzerland (2.3%, a difference of 0.13%).
DemographicsRating | RankSelf-Care Disability
Asians
99.2
/100
|
#71
Exceptional
2.3%
Eastern Europeans
99.2
/100
|
#72
Exceptional
2.3%
Immigrants | Egypt
99.1
/100
|
#73
Exceptional
2.3%
Immigrants | Switzerland
99.1
/100
|
#74
Exceptional
2.3%
Immigrants | Netherlands
99.1
/100
|
#75
Exceptional
2.3%
Immigrants | China
99.1
/100
|
#76
Exceptional
2.3%
Immigrants | Middle Africa
99.0
/100
|
#77
Exceptional
2.3%
Immigrants | Ireland
99.0
/100
|
#78
Exceptional
2.3%
Immigrants | Kenya
99.0
/100
|
#79
Exceptional
2.3%
Chileans
98.8
/100
|
#80
Exceptional
2.3%
Ugandans
98.8
/100
|
#81
Exceptional
2.3%
Immigrants | Denmark
98.8
/100
|
#82
Exceptional
2.3%
Indians (Asian)
98.7
/100
|
#83
Exceptional
2.3%
Immigrants | Spain
98.7
/100
|
#84
Exceptional
2.3%
Estonians
98.3
/100
|
#85
Exceptional
2.3%

Demographics Similar to Peruvians by Self-Care Disability

In terms of self-care disability, the demographic groups most similar to Peruvians are Uruguayan (2.4%, a difference of 0.030%), Immigrants from Sierra Leone (2.4%, a difference of 0.070%), Belgian (2.4%, a difference of 0.070%), Immigrants from Canada (2.4%, a difference of 0.11%), and Immigrants from Nigeria (2.4%, a difference of 0.15%).
DemographicsRating | RankSelf-Care Disability
Immigrants | North Macedonia
93.1
/100
|
#114
Exceptional
2.4%
Immigrants | Hong Kong
93.1
/100
|
#115
Exceptional
2.4%
Northern Europeans
92.9
/100
|
#116
Exceptional
2.4%
Taiwanese
92.5
/100
|
#117
Exceptional
2.4%
Immigrants | Canada
92.0
/100
|
#118
Exceptional
2.4%
Immigrants | Sierra Leone
91.8
/100
|
#119
Exceptional
2.4%
Uruguayans
91.5
/100
|
#120
Exceptional
2.4%
Peruvians
91.3
/100
|
#121
Exceptional
2.4%
Belgians
90.9
/100
|
#122
Exceptional
2.4%
Immigrants | Nigeria
90.3
/100
|
#123
Exceptional
2.4%
Immigrants | North America
90.2
/100
|
#124
Exceptional
2.4%
Immigrants | Morocco
90.2
/100
|
#124
Exceptional
2.4%
Hmong
89.9
/100
|
#126
Excellent
2.4%
Colombians
89.7
/100
|
#127
Excellent
2.4%
Immigrants | Hungary
89.6
/100
|
#128
Excellent
2.4%